


Serviços Personalizados
Artigo
 Inglês (pdf)
 Artigo em XML
 Referências do artigo
Indicadores

Links relacionados
-
 Citado por Google
 -
 Similares em Google
Compartilhar

 Permalink
Journal of the Southern African Institute of Mining and Metallurgy
versão On-line ISSN 2411-9717
versão impressa ISSN 2225-6253
J. S. Afr. Inst. Min. Metall. vol.114 no.7 Johannesburg Jul. 2014
PHYSICAL BENEFICIATION
A simple framework for developing a concept beneficiation flow sheet
J. Rabe
Pesco
SYNOPSIS
Tasked with developing a flow sheet for a new resource, one typically turns the experts for help. The advice of an expert can be invaluable in reducing the time and costs associated with characterizing an ore (not to mention extracting maximum information from limited samples). While guiding and optimizing a metallurgical concept study requires a certain skill set, selling a project is something different.
The metallurgical specialist is usually not responsible for sharing the results of investigations with potential investors. However, the person responsible for selling the project can ensure that a metallurgical concept study is conducted thoroughly and responsibly without having the ability to do the work, while being sufficiently familiar with the metallurgical aspects to authoritatively sell the project.
The process of identifying suitable process routes through to constructing a concept flow sheet and mass balance is discussed as a basic example.
From basic mineralogical information and a thorough literature survey, the most likely beneficiation routes can be identified and targeted testing conducted. The final top size will depend on the required product properties (mainly grade), the selected beneficiation technology, and the ore's liberation properties.
Once the required top size has been identified, comminution options can be evaluated. Once again, literature surveys can be used to supplement concept-level comminution property information, and select possible equipment and circuit configurations.
Marketing, material handling, and logistics-related information can be used to determine required dewatering technologies. At this stage, enough information is available to develop a concept mass balance and conduct basic equipment sizing.
Keywords: comminution, ore beneficiation, characterization, titanomagnetite. Conceptual flowsheet.
Introduction
The project manager responsible for delivery of a concept study on any resource does not always have an indepth knowledge of the metallurgical processes required to generate a saleable product at a competitive cost.
In larger companies, the project manager will have access to a metallurgist, but in most exploration companies and junior mining houses, this will be an outsourced function -at least at this stage of the project. This means that the project manager has to trust an external expert to do the necessary work thoroughly enough to be able to submit the final study results to a competent reviewer without any come-backs. The primary marketer of the project also needs to gain enough insight into the process choices, opportunities, and challenges to be able to confidently sell the project to potential investors while being able to answer most of their technical as well as financial questions.
This may sound like a daunting challenge, but building on a few basic concepts enables one to understand the process choices and sell the project with confidence. For a typical concept study, a single technically and financially viable solution needs to be proven, with a typical accuracy of 30% for cost estimation - although this varies between companies. At the conclusion of the concept stage, targeted ore characterization and processing tests are typically identified for option generation and analysis in the project phases to follow. Depending on how well known the target ore is, as well as the expected ore properties and the acceptable amount of risk for the project, certain aspects of the ore processing may be based on literature reviews at this stage of the project.
Chemical characteristics, such as gold, iron, or copper grades, might give an indication of the potential value of a resource, but do not yield any information on the extractability of the target mineral, nor do they enable the final achievable product grades to be identified with regard to the target element as well as undesirable impurities. Knowledge of the mineral associations in the resource is essential to develop a suitable beneficiation strategy. With the use of information from literature reviews, basic processing options can be identified at this stage.
Separation based on particle size represents the simplest basis of beneficiation. In such a process, if either the product or gangue minerals can be broken down selectively, the ore can be upgraded by classification. Separation based on particle density is one of the most widely used beneficiation strategies, finding application in fields as diverse as gold panning and vegetable classification. Separations based on magnetic and surface properties have also been utilized for hundreds of years.
Along with each of the processing options being investigated, the top size that is required to produce the required product grade needs to be investigated. Liberation is a word with different meanings for different people, and even when the same definition is applied, there is still plenty of room for confusion.
At this stage preliminary beneficiation flow sheets can be drawn up, and relevant testing initiated. Typical tests will include liberation testing and confirmation of product grades and yields. Ore hardness and related comminution properties may be investigated at this stage of the project - although typically the lack of sufficient sample mass at coarse enough top sizes prohibits most such test work at this stage. Literature reviews and vendor experience are invaluable resources for conducting conceptual designs.
A schematic summary of the proposed methodology for developing a process flow diagram (PFD) is shown in Figure 1.

Although not discussed in detail in this overview, sorting of particles based on surface properties such as fluorescence or colour can also be considered. Traditionally this has been limited to coarse top sizes only, but as sorting technology has evolved the range of properties that can be used to discriminate between particles, as well as machine capacities, has improved.
Results from tests conducted on a titaniferous magnetite from the Bushveld Complex will be used as examples for discussion.
Mineralogy
For the purposes of this discussion, bulk mineralogy refers to techniques like X-ray diffraction (XRD), and automated mineralogy refers to the Mineral Liberation Analyser (MLA) or QEMSCAN (derived from the QEMSEM - Quantitative Evaluation of Minerals by Scanning Electron Microscopy). The term 'bulk' is not meant to refer to large sample sizes, but rather to the fact that the techniques give information regarding the average mineralogy of the entire sample -nothing can be said about mineral associations based on XRD only. QEMSCAN gives information on a micro-scale, meaning information about grain sizes and mineral associations at this level can be provided.
With the development of sophisticated mineralogical characterization tools such as the MLA and QEMSEM, obtaining copious amounts of mineralogical information early on in the project is becoming the norm rather than the exception. It is unfortunate that metallurgical interpretation of this rich mineralogical information is often lacking, and the potential of simpler techniques such as XRD is often forgotten.
One of the most important aspects of interpretation of mineralogical results is that certain mineral properties cannot be measured by or inferred from either micro-mineralogy such as the MLA or bulk mineralogy such as XRD with 100% accuracy - magnetic and flotation response are two typical examples of this.
Bulk mineralogy
XRD has been used to identify minerals based on their crystal structure since the 1920s. The commonly used term XRD refers to X-ray powder diffraction; a rapid non-destructive test to determine mineralogical make-up of a crystalline specimen. The basic principle involves impinging an X-ray beam onto a sample and measuring the intensity of the diffracted beam at a range of angles. Depending on the spacing and orientation of the crystal planes, higher intensity peaks will be observed at certain positions. Although it may not be possible to distinguish chemically between, for example, the titanium oxides anatase and rutile, their crystal structures are different, allowing each to be uniquely identified by XRD (Figure 2).
The patterns of all minerals in a sample are superimposed on each other in an XRD spectrum. The superimposed fingerprints of each mineral in the sample are then separated, allowing the relative quantity of each component to be estimated.
Automated mineralogy
Development of the QEMSEM started in the 1970s at CSIRO (FEI Natural Resources, n.d. (b)), with the first commercial sales from 1987. Following significant improvements to the system in the following decade, Windows™-based systems were developed in 1997, and called the QEM SCAN. FEI (originally Field Emission Inc.) bought all intellectual property as well as the software related to the QEMSCAN early in 2009. The MLA was developed by JKMRC in the late 1990s, and commercialized in 2000. In mid-2009 FEI bought the MLA business from JKTech.
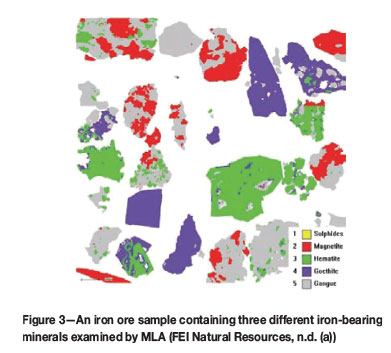
The case for mineralogy can be illustrated by using an iron ore as example, where iron might be present in a number of different minerals, ranging from haematite and magnetite through hydrated oxides such as goethite to iron- bearing silicates.
The geological samples have been analysed, and high iron concentrations confirmed, but the target mineral has not been identified. Based on geological interpretations, magnetite has been targeted for extraction, and the relevant tests conducted to prove a business case.
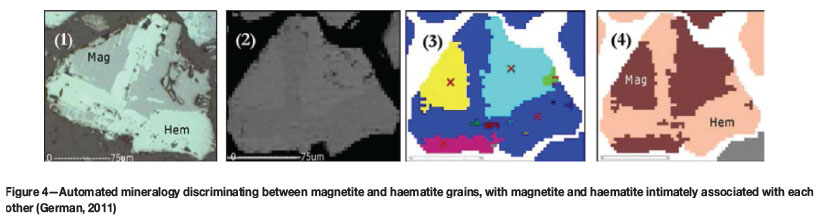
An acceptable iron grade was produced in the concentrate, but recovery of iron was disappointing. XRD analysis of the ore would have indicated that a number of iron-bearing minerals are present, with some of them having weak magnetic responses. While this would raise concerns about using only magnetic separation to recover iron, the low recovery could also be due to weathering of the magnetite, in which case the magnetite could be intimately associated with haematite.
For the hypothetical ore depicted in Figure 3, only partial iron recovery would be expected by magnetic separation, while a high recovery would be obtained from the example in Figure 4.
Liberation
Defining liberation
The concept of liberation is a complex one, with a multitude of definitions. At one extreme, the liberation size of an ore is the size at which the smallest valuable mineral grain is liberated from its host matrix.
This definition is offen used in automated mineralogy reports, and a common interpretation implies that a product with no gangue minerals is being aimed for - which is usually not the case. For example, a typical haematite product consists of around 63% iron with 10% gangue minerals. If a homogenous piece of ore with a grade of 63% iron and a liberation size of 100 µm is crushed to a top size of 31 mm, the resulting fragments will also consist of 63% Fe. A liberation investigation will indicate that significant further crushing is required, even though no further process is required to achieve the required product grade.
Top size
In many cases the ultimate mineralogical liberation is fairly simple to quantify, but the actual top size at which an ore will be sufficiently liberated to produce the required product grade is not so obvious. In the over-simplified example discussed previously, it may be obvious that the top size required for the production of a saleable product is dictated by factors other than liberation, which highlights the difference between top size and liberation size.
The goal is to determine the coarsest size at which an acceptable product grade can be produced. The optimum top size will typically be coarser than the liberation size, unless extremely pure products are required. Although there is a correlation between the mineralogical liberation size and optimum top size, the relationship is a function of factors such as:
► The grain size distribution of both valuable and gangue minerals
► The exact mineralogical chemistry for gangue and valuable minerals
► The relative abundance of the valuable mineral in the ore
► The required product grade
► Beneficiation process efficiency.
The best way to confirm the required top size for an ore is to crush representative samples to a range of top sizes and subject them to tests simulating the selected beneficiation option. The sizes at which testing is conducted will range around a size indicated by considering the list of factors mentioned above.
If more than one beneficiation technology will be applied (such as pre-concentration by DMS before milling and flotation), the final product grade can be estimated by testing an un-concentrated sample with the final process, unless feed grade has a significant effect on the achievable product grade (this is a typical challenge when flotation is involved).
In most cases the only factor that will require compensation is the recovery of the valuable mineral, with valuables discarded during pre-concentration typically lost to final waste.
Beneficiation tests
Based on the mineralogical results, one can identify the valuable mineral (or minerals) of interest, as well as the important gangue minerals. There are very few resources or types of resources that have not been investigated in the past, and information about successful beneficiation strategies can be obtained by conducting a thorough literature review, or by technical discussions with similar operations.
Once particles have been broken down to the required top size, the properties of the gangue and valuable minerals can be used to separate them to produce a saleable product.
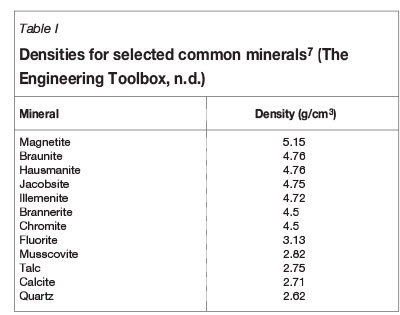
The basis of separation for most ore types can be ascertained by surveying similar operations, and there are significant sources of mineral properties in the public domain. A few examples these are shown in Table I and Figure 5. Detailed information of most minerals can also be obtained through general literature surveys or from dedicated web sites like Webmineral (Mineralogy Database, 2012)and Mindat (Mindat, n.d.).
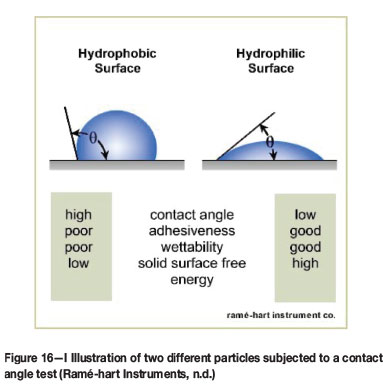
Certain separation techniques are applicable at various top sizes. Floating a 30 cm rock by attaching air bubbles to its surface is unlikely to succeed, as is optically sorting 100 µm particles. A good summary is provided by Kelly and Spottiswood (1982) (Figure 6). In the decades following publication of this textbook, some separation processes have been refined to allow a wider application, but these ranges remain a good rule of thumb in the absence of other information.
Beneficiation based on size
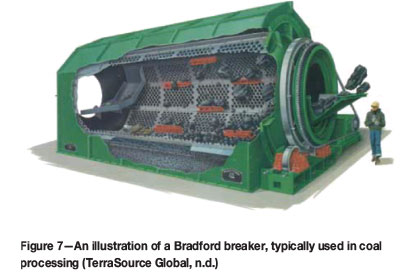
The typical run-of-mine ore is too large for easy handling during downstream processes and further crushing and screening, which also provides a convenient opportunity to separate minerals based on their relative hardness, is required.
Typical examples of this are the use of Bradford breakers in coal processing (Figure 7), and scrubbing for upgrading of bauxites, manganese, diamond-bearing kimberlites, and other weathered materials.
Confirming the amenability of an ore to upgrading by classification can be done at a high level by wet screening of a representative sample, but the attritioning effect of particles being tumbled or mechanically agitated in a slurry is best simulated by conducting small-scale tumbling tests.
For smaller samples, these tests can be conducted by tumbling an ore in a vessel such as a cement mixer, followed by screening. If a few hundred kilograms of material are available, small scrubbing units can be used (Figure 8).

Beneficiation based on density
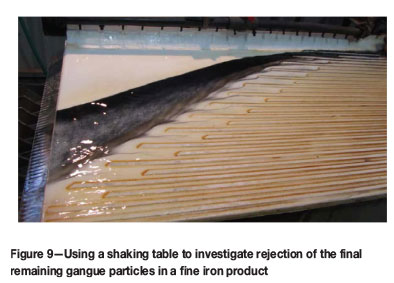
Separation of minerals based on differences in density dates back to the early Roman Empire, when alluvial gold deposits were mined using panning and sluices (Mining & Metallurgy, n.d.). Coal washing in South Africa dates back to the early 1900s (De Korte, 2010).
The upgrading of a weathered iron ore on a shaking table is shown in Figure 9, with the higher density particles in the dark band at the top of the picture, and the lighter gangue washed to the edge of the table at the bottom.
If mineralogical work indicates that gangue and valuable minerals can be separated based on density differences, testing needs to be done to show if this is will be feasible and at which top size optimal results are obtained. The most fundamental test of an ore's amenability to density-based separation is a sink-float test. In this procedure, a crushed ore sample is immersed in a liquid at a certain density. The lower density particles float, and are removed. The higher density 'sinks' are removed separately, and immersed in a fluid with higher density than the first bath. This process is repeated multiple times, fractionating the sample into density intervals.
The sink-float technique is typically limited to material coarser than 0.5-1 mm, but there are also service providers that conduct these tests down to 45 µm (ALS Global, n.d.) at densities up to 4.4 t/m3. Using high-density liquids (Central Chemical Consulting, n.d.) with suspensions of tungsten carbide (WC), separation at densities as high as 5 t/m3 is possible. MLA or QEMSCAN results can also be used to generate washability curves - typically useful for characterization of fine ore samples. These derived characteristics are very useful, but must be interpreted with care.
There are a number of alternative techniques, such as the shaking table, the mineral density separator (MDS), and Viking/Reichert cone, for dividing ores into density fractions. All of these processes, however, have some element of process efficiency built into their results, and as such should be used with extreme caution. An MDS, for example, is quite suitable for investigating the jigability of an ore, but its outputs will not provide an accurate simulation of dense medium separation or an inline pressure jig.
Following the separation process, material in each density fraction is weighed and analysed to examine its chemical and/or mineralogical make-up. Based on the weight of material in each density fraction as well as its composition, a suitable separation density can be identified to pursue in further work.
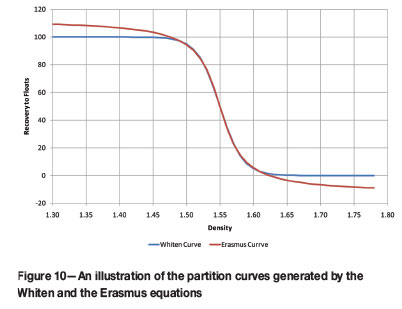
The sink-float process characterizes the ore, allowing simulation of a separation process by using sigmoidal equations, typically the Whiten equation:

Ep is the slope of the partition curve, and can be calculated by dividing the difference between the densities at which 75% and 25% of the material in a density fraction report to sinks by the cut density of the operation. A lower number therefore indicates better separation. If a reasonable assumption can be made for the Ep, a simple weighted average product grade can be used to identify the required separation density.
The Whiten equation assumes symmetrical behaviour, with equal misplacement of both low- and high-density material, and it ignores the effect of particle size. The assumption around particle size is typically acceptable for dense-medium-based processes - as is the assumption regarding symmetrical misplacement.
These assumptions are typically not valid for water-based processes, for which the Erasmus curve (Erasmus, 1973) would be more applicable:

For symmetrical curves te2=-te1
Typically, 0.02+ρ50 < C < ρ50-0.02
The Erasmus curve can only be used to evaluate partition curves for recoveries less than 99% and more than 1%, as is graphically shown in Figure 10.
While dense medium processes can be simulated with acceptable accuracy by using typical process efficiencies, water-based separation processes will require further test work in order to determine relevant process performance parameters. A few examples of such equipment include jigs (conventional and in-line pressure), spirals, and hindered settlers.
Beneficiation based on magnetic separation
If the gangue and valuable minerals have different magnetic susceptibilities, it is possible to separate them based on this property. Typically this is achieved by moving the particles through a magnetic field, with magnetic particles attracted by the field and the non-magnetic particles being rejected.
Depending on the size of the particles and their magnetic susceptibilities, a range of possible separators can be used - a few examples are shown in Figures 11-13.
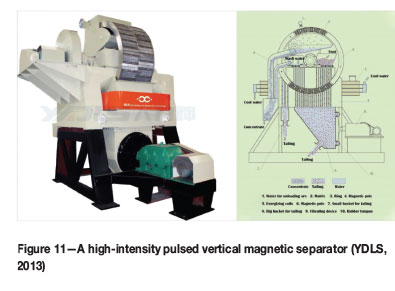
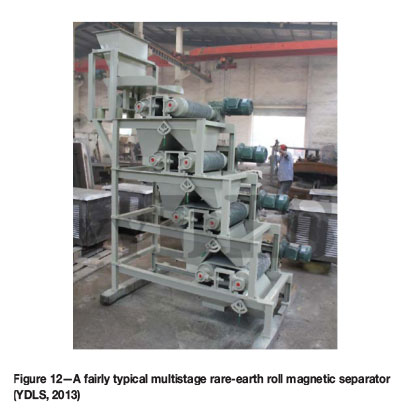
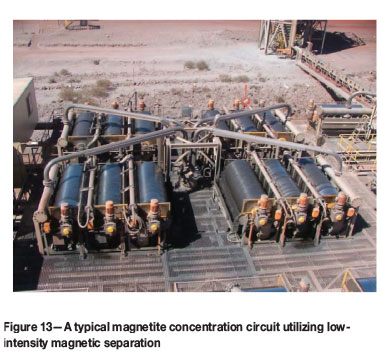
Wet high-intensity separation is typically used for fine to ultrafine materials with low magnetic susceptibility, wet low-intensity separation for fine materials with high magnetic susceptibilities, and rare-earth rolls for medium to fine material with intermediate to low magnetic susceptibilities.
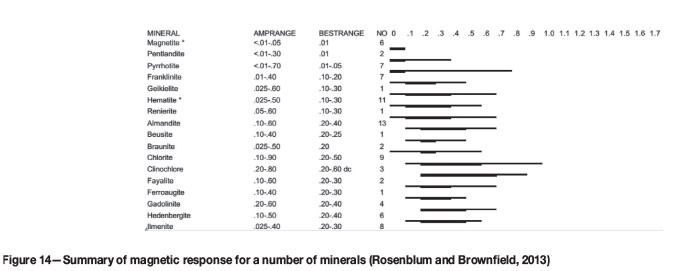
How does one decide on the correct equipment for a given application? While sources like the USGS (Figure 5) and original work by E.W. Davis are good places to begin, many minerals do not have a single value for their magnetic susceptibility (Rosenblum and Brownfield, 2013), with mineral chemistry influencing magnetic response. There are various ways to examine the magnetic response of an ore sample.
Magnetic susceptibility is commonly measured by (Marcon and Ostanina, 2012):
► Satmagan (Rapidscan systems, n.d.).
► Kappabridge (ASC scientific, n.d.), (AGICO, n.d.)
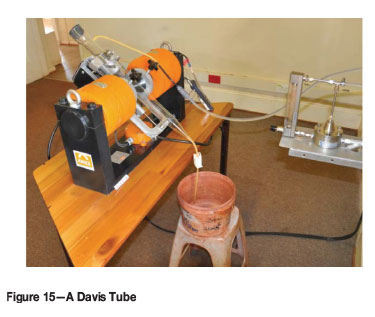
The magnetic susceptibility of pure minerals is of limited value when the requirement is to determine the amount of material that can be extracted, as well as the grade of product, as a function of variables such as top size, feed grades, and separation intensities. The Davis tube (Figure 15) is a standard tool used for high-susceptibility minerals such as magnetite. For lower susceptibility minerals such as the rare-earth minerals, various laboratory-scale versions of rare-earth or induced roll magnetic separators are available.
Flotation
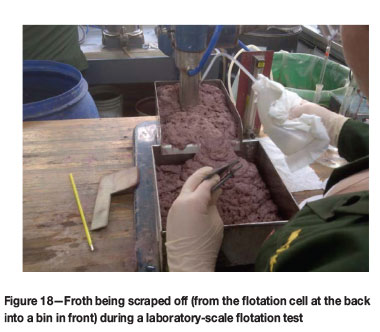
In the process of froth flotation, particles are separated based on differences in their surface properties. An over-simplified explanation is that particles are selectively attached to air bubbles in a frothy slurry, with the air bubbles rising and carrying attached particles with them. The particle-laden froth is then removed at the top of the flotation cell, with the balance of the material removed at the bottom of the cell.
In theory one could examine the surface properties of a particle and predict its flotation behaviour. There are a number of tests to determine the surface characteristics of materials, a few of which are discussed below.
In principle, a particle can be floated only if it is not wetted by water (hydrophobic). One way of determining this, and to investigate the effect of various flotation reagents, is to measure the angle between a drop of water and the surface of the material in question (Figure 15).
Zeta potential
The electrical potential of a particle surface can also be used as an indication of separation selectivity compared to other particles (Azonano, 2013; Fuerstenau, 2005).
Similar to the case with magnetic susceptibility, application of both the methods listed above in predicting flotation performance is problematic, with only limited correlation between contact angle, measurements of zeta potential, and flotation performance in the absence of flotation tests.
Various small-scale experimental set-ups exist for flotation performance prediction, with a conventional laboratory flotation cell the most commonly used. An example of such a cell is shown in Figure 17, with a test illustrated in Figure 18.

Comminution properties
A number of tests can be conducted to determine comminution properties for an ore. A few of the most common tests include:
► Crushing Work Index (CWI)
► Bond Ball mill Work Index (BBWI/BWI)
► Bond Rod mill Work Index (bRWI).
In addition, point load index, drop-shatter tests, small high-pressure grinding roll tests, abrasion tests, and other specialized tests can be conducted.
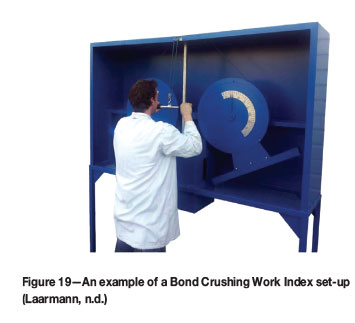
Crushing Work Index
A number of individual lumps of the ore between 50 mm and 75 mm in size are used in this test. Twenty particles are typically required. The particles are subjected to impact from a falling pendulum (Figure 19), and the amount of energy consumed in breaking each particle is recorded.
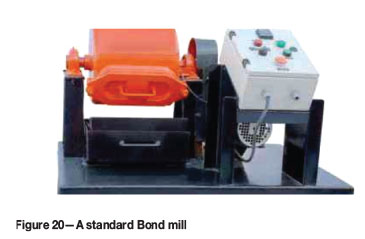
Bond Work Index
This procedure was developed to assess the energy required to mill particles from a top size of 3.35 mm to the required top size, and includes the effect of the circulating load. The standard Bond test consists of a detailed procedure (JKtech, n.d.), executed under strictly controlled conditions using well-defined equipment (Figure 20). Although there may be debate about the validity of the Bond mechanical equation under some conditions, the Bond Work Index remains one of the most reproducible methods of estimating the power required to grind an ore.
Example of PFD development
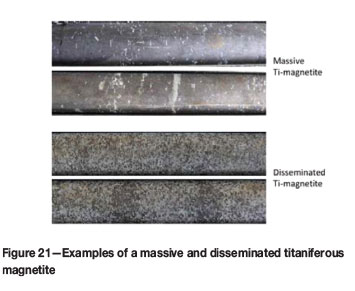
In the case of a titanomagnetite deposit, the base-case assumption was that the final product would be produced by magnetic separation. This decision was made based on previous experience when working with these ores as well as information in the literature.
The deposit consists of two ore types; one a finely disseminated and the other a massive titaniferous magnetite as illustrated in Figure 21. Since the deposit outcrops, both of these ore types are also present in weathered and un-weathered conditions.
Some of the questions that had to be answered during the concept study were:
► Can a coarse product be produced - at least from the massive ore?
► Is scrubbing a viable way of silica rejection?
► What is the optimum grind for product grade and yield maximization?
Evaluation of scrubbing
Part of the resource has been weathered, possibly breaking down the silicates sufficiently to allow upgrading of the sample through scrubbing. This process step aims to break down the friable weathering products during a wet tumbling process, followed by screening in order to remove the fine (low-grade) fraction.
The results of one test are summarized in Figure 22, where increasing mass yield to the product corresponds to reducing the size below which material is rejected to waste. A mass yield of 100% implies no screening, and reflects the head grade of the sample.
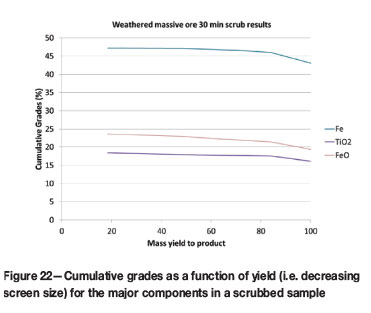
Based on these results it is possible to increase the total iron content from 43% to 46% by rejecting 16% of the material, with only a limited further increase in the grade possible. In this case the upgrade was judged insufficient to justify the installation of a scrubbing step.
Dense medium separation
Sink-float tests were conducted to establish the viability of a density-based method to separate ore and gangue minerals.
These tests were conducted at two top sizes, 6 mm and 12 mm, which were selected based on visual interpretation of a number of drill core samples by the project's geological team. The purpose of these tests was to ascertain whether a final product could be obtained, or whether waste could be rejected early in the flow sheet. Two density points were therefore identified for testing - 2.96 t/m3, and 3.6 t/m3. The higher density was targeted to give an indication of a high-grade product's quality, and the lower density to establish the potential for silicate rejection.
Figure 23 illustrates the cumulative recovery of a number of species as a function of decreasing separation density at a top size of 6 mm. The dotted red line indicates no up- or down-grading, with valuable and waste materials both simply splitting in the same ratio.
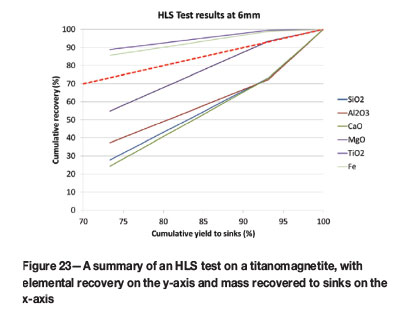
It was observed that silicates preferentially reported to the low-density float fractions, with valuable iron and titanium reporting to the higher density fractions. As the separation density is increased, titanium and iron are selectively recovered, with gangue minerals being selectively rejected.
With 86% of the iron in this sample recovered into 73% of the total mass and 72% of the silica in the sample rejected, density-based separation was identified as a feasible processing step - even if only to reject gangue minerals before further milling to produce a high-grade concentrate.
Establishing optimum top size
Based on previous knowledge, magnetic separation at low intensities was identified as a suitable base-case process option for this ore. Test work aimed at ascertaining the best product grade, as well as the grind-grade relationship was therefore conducted using a Davis tube.
As the optimum product grade for the project does not necessarily correspond to the highest grade (and the finest grind), a series of top sizes was investigated, from 80% finer than 500 µm to 80% finer than 38 µm. Figure 24 and Figure 25 summarize the results of these tests.
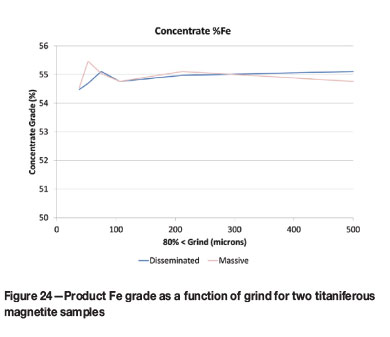
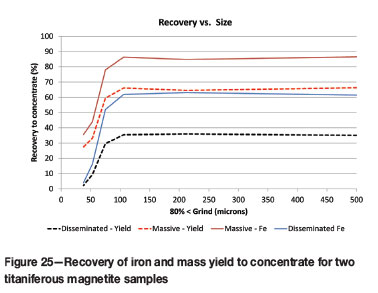
Based on this evidence there is no reason to grind finer than 500 µm, but because no decrease in product grade is observed at the upper end of the test range, it is possible that a coarser top size could in fact work equally well.
Further work
Although not discussed above, more detailed work regarding the optimum top size and test conditions is recommended. The lack of liberation at finer sizes is not typical, and would need to be confirmed during the concept phase.
No comminution work has been done yet, and typical numbers were used for plant design purposes. Literature reviews as well as vendor opinions were used for design of the comminution circuit. This was acceptable at the current stage of the project, but these assumptions will have to be confirmed by test work in subsequent study phases.
Thickeners were sized using a target rise rate, and this sizing confirmed by vendors. Settling behaviour and filtration rates will also have to be confirmed by testing.
Conclusion
Based on a geological interpretation of an orebody, followed by some bulk and/or micro-mineralogy, sufficient information can be obtained about an ore to identify potential beneficiation routes.
One of the easiest ways to beneficiate an ore is by methods based on particle size. If the gangue or the valuable component can be selectively broken down, a simple classification step can be used to upgrade the ore. If siliceous gangue minerals have been weathered by prolonged exposure to water and oxidation, there is a good probability that a wet tumbling process can be used to break down the gangue minerals and separate them from the valuable components. Following crushing and/or scrubbing, the sample can be screened into various size fractions and analysed to determine if sufficient upgrading has occurred.
Density, magnetic susceptibility, or surface properties can also be used to effect separation of valuable and gangue minerals. Density is the simplest of these properties to exploit. Once a sample has been reduced to the required top size, the material can be subjected to density characterization by sink-float analysis. Select laboratories can conduct sink-float testing of fine particles, and micro-mineralogy (MLA etc.) can be used to determine the washability of an ore. This washability information can then be used to simulate density-based separation by using information about the separation process from the literature and vendors.
Magnetic separation and flotation represent two less well-understood separation techniques. Fundamental characterizations such as magnetic susceptibility and contact angle measurement are available for each of the processes respectively. These characteristics cannot however, be used to predict product grades and yields. Empirical characterization, such as Davis Tube and bench-scale flotation, can be used to predict an ore's behaviour during magnetic separation or flotation.
Although there are many definitions for liberation, this need not be a significant concern during the early phases of a study. The coarsest top size required to yield a saleable product grade is typically determined by tests using the methods described previously.
Depending on the project, comminution and de-watering tests are typically conducted only during later stages of the project (pre-feasibility or feasibility). This is often due to lack of suitable material for testing. Comminution tests, for example, typically require significant masses of material representing all ore types in a deposit and at top sizes significantly coarser than that obtained by conventional core drilling. Coal is one commodity for which a procedure has been developed to characterize large diameter drill core material to predict the particle size distribution (PSD) that will be observed in a plant, although even this procedure involves certain problems.
Dewatering tests (thickening and filtration) require a significant volume (tens of litres) of representative material. For example, obtaining samples that accurately represent flotation plant tailings at this stage of a project would be a significant problem.
In the absence of test data, comminution and dewatering processes are typically designed based on literature reviews, historical information from similar operations, and the experience of equipment vendors.
Acknowledgments
The author is grateful for permission to use the information from Bushveld Minerals' Mokopane project as an example.
References
AGICO. Not dated. Laboratory instruments for measurements of magnetic properties of rocks. http://www.agico.com/ [Accessed July 2013].
ALS Global. Not dated. Heavy Liquid Separation. http://www.alsglobal.com/en/Our-Services/Minerals/Metallurgy/Capabilities/Heavy-Liquid-Separation [Accessed July 2013}. [ Links ]
ASC Scientific. Not dated. Multi-Function Kappabridges. http://www.ascsci-entific.com/kappa.html [Accessed July 2013]. [ Links ]
Azonano. 2013. Water Treatment and the Role of Zeta Potential in Water Treatment Process Control. Supplier Data by Malvern. http://www.azonano.com/article.aspx?ArticleID=1237 [Accessed July 2013]. [ Links ]
Central Chemical Consulting. Not dated. LST Heavy Liquid for density separations. http://www.chem.com.au/products/lstheavyliquid/ [Access July 2013]. [ Links ]
De Korte, G.J. 2010. Coal preparation research in South Africa. Journal of the Southern African Institute of Mining and Metallurgy, vol. 110, no. 1. pp. 361-364. [ Links ]
Erasmus, T.C. 1973. The Fitting of a Smooth Curve to the Experimentally Determined Coordinates of a Tromp Curve. Fuel Research Institute of South Africa. Technical Report 4. [ Links ]
FEI Natural Resources. Not dated (a). Overview of the application of MLA foi iron ore. http://www.fei-natural-resources.com/uploadedFiles/Documents/NaturalResources/Application; Mining/Application_Overviews/AO0032-MLA-IronOre-web.pdf [Access July 2013]. [ Links ]
FEI Natural Resources. Not dated (b). http://www.fei-natural-resources.com/products/qemscan.aspx [Accessed July 2013]. [ Links ]
Fuerstenau, D.W. 2005. Zeta potentials in the flotation of oxide and silicate minerals. Advances in Colloid and Interface Science, vol. 114-115, no. 1 pp. 9-26. [ Links ]
German, F. 2011. ICAM 2011 presentation on hematite and magnetite discrimination. http://automatedmineralogy.blogspot.com/2011/03/fei-australia-center-of-excellence-for.html [Accessed July 2013]. [ Links ]
JKTech. Not dated. http://www.jktech.com.au/sites/default/files/brochures/LabServices_BondBallMill.pdf [Accessed July 2013]. [ Links ]
Kelly, E.G. and Spottiswood, D.J. 1982. Introduction to Mineral Processing. Wiley, New York. [ Links ]
Laarmann. Not dated. Bond Impact Tester. http://wwww.laarmann.info/bond-impact-tester.html [Accessed July 2013]. [ Links ]
Marcon, P. and Ostanina, K. 2012. Overview of methods for magnetic susceptibility measurement. PIERS Proceedings. pp. 420-424. [ Links ]
Mindat. Not dated. http://www.mindat.org/ [Accessed July 2013]. [ Links ]
Mineralogy Database. 2012. http://www.webmineral.com/ [Accessed July 2013]. [ Links ]
Mining & Metallurgy. Not dated. History of Gold. http://www.miningandmet-allurgy.com/gold/html/history_of_gold.html [Accessed July 2013]. [ Links ]
Ramé-hart Instruments. Not dated. Information on Contact Angle. http://www.ramehart.com/contactangle.htm [Accessed July 2013]. [ Links ]
Rapidscan systems. Not dated. Satmagan 135. http://www.rapiscansystems.com/en/products/industrial_mining/productssatmagan_135 [Accessed July 2013]. [ Links ]
Rosenblum, S. and Brownfield, I. 2013. Magnetic Susceptibilities of Minerals. http://pubs.usgs.gov/of/1999/ofr-99-0529/ [Accessed July 2013]. [ Links ]
Sepor. Not dated. Gravity separation, concentration. http://www.sepor.com/products-page/gravity-separation-concentration/ [Accessed July 2013]. [ Links ]
TerraSource Global. Not dated. Bradford Breakers by Pennsylvania Crusher Brand. http://terrasource.com/equipment/bradford-breakers-by-pennsylvania-crusher-brand [Accessed July 2014]. [ Links ]
The Engineering Toolbox. Not dated. Densities of common minerals. http://www.engineeringtoolbox.com/mineral-density-d_1555.html [Acessed July 2013]. [ Links ]
University of Arizona. Not dated. Scintag XDS 2000. http://www.usif.arizona.edu/equipment/xds2000.html [Accessed May 2013]. [ Links ]
YDLS. 2013. Wet High Gradient Magnetic Separator DLS Series. http://www.dlsmagnet.com/products-list/45.html [Accessed July 2013]. [ Links ]

