


Services on Demand
Article
 English (pdf)
 Article in xml format
 Article references
Indicators

Related links
-
 Cited by Google
 -
 Similars in Google
Share

 Permalink
Journal of the Southern African Institute of Mining and Metallurgy
On-line version ISSN 2411-9717
Print version ISSN 2225-6253
J. S. Afr. Inst. Min. Metall. vol.114 n.6 Johannesburg Jun. 2014
GENERAL PAPERS
Estimation of rock strength from quantitative assessment of rock texture
C.A. OzturkI; E. NasufI; S. KahramanII
IIstanbul Technical University, Mining Engineering Department, Istanbul, Turkey
IIHacettepe University, Mining Engineering Department, Ankara, Turkey
SYNOPSIS
The compressive strength of rock (σc) has an important effect on design of structures in rock engineering. Compressive strength can be determined in the laboratory using the uniaxial compressive strength (UCS) test. Some other index tests, such as the point load test, are also used, particularly when suitable samples for UCS are not available. The quantification of rock texture has introduced a new method in rock engineering for estimating the mechanical and physical properties of rock materials from microscopic investigations. The aim of this study is to quantify rock texture to estimate rock strength from the texture coefficient (TC), which is determined from a statistical assessment of thin section images. Rock texture is quantified by twelve different images from a single thin section to increase the reliability of texture analysis. A data-set is prepared to investigate correlations between TC and σc. The statistical correlations are computed after classifying of the rock samples based on their lithology as well as grain features. Equations derived based on the results of this study are used to predict the approximate value of compressive strength from the texture coefficient. This method is particularly useful for preliminary studies in rock engineering projects prior to detailed site investigation.
Keywords: rock engineering, compressive strength, statistical correlation, grain features, texture coefficient.
Introduction
The strength of rock masses depends mainly on the properties of the intact rock material and discontinuities. The strength of the intact rock material depends on the mineral composition and texture. The strength of rock masses can therefore be obtained by analysing the features of intact rock material and discontinuities (Singh and Goel, 2011).
The compressive strength (σc) of rock is measured mostly from laboratory uniaxial compressive strength (UCS) tests. Some other index tests, such as point load index (Is) and Schmidt hammer rebound number (R), are also useful for determining the strength of rock materials. The methodology for UCS is standardized by International Society of Rock Mechanics (ISRM, 1981) and American Society for Testing and Materials (ASTM, 1984). The estimation of σc from index tests has been investigated by several researchers, based mostly on statistical investigations of data-sets. The details of these investigations are beyond the scope of this paper, although they are useful for understanding the applications of the various test methods.
Texture, which is defined as the degree of crystallinity (Williams et al., 1982), is the combination of mineral grains and matrix that includes the smallest particles of rock material. Nearly all mechanical and physical properties of interest to rock engineers depend on how the grains and matrix relate to the texture. A method for quantification of rock texture by combining geometrical parameters regarding grains and matrix was proposed by Howarth and Rowlands (1986, 1987). The proposed correlations of textural and mechanical properties from texture coefficient (TC) measurements were based mainly on statistical assessment. The purpose of the current study is to investigate the correlations between strength of rock material and rock texture properties in order to predict the UCS from studies of rock thin sections and to develop a statistical technique for thin section analysis.
Quantification of rock texture
Rock texture is revealed by the geometrical relationships of the grains and matrix. Geometrical features of grains can be obtained from a photograph of a rock thin section. The following features have been used quantify rock texture.
Grain shape and size
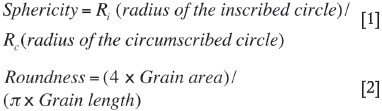
Grain shape can be quantified by measuring grain length (major axis) and width (minor axis), as well as perimeter and area. Grain shape is classified based on roundness and sphericity (Cox and Budhu, 2008). Roundness is the ratio of curvature of a grain's edges to overall grain shape (Wadell, 1932), and sphericity is the ratio between grain volume and the smallest circumscribing sphere (Krumbein, 1941). These two parameters are formulized as (Cox and Budhu, 2008):
Brace (1961) reported a linear relationship between grain shape and strength, while increasing size of grains leads to a decrease in strength. Ehrlich and Weinberg (1970) proposed a grain roughness coefficient that was also used by Onodera and Kumara (1980). The roughness coefficient showed correlation between rock strength, fracture propagation, and grain shape. Beddow and Vetter (1977) described grain shape from Fourier series, while Kaye (1982) defined grain shape using fractal dimension. Prikryl (2001) investigated the effect of grain size on strength and proposed a logarithmically inverse relation between grain size and rock strength, as previously suggested by Eberhardt et al. (1999).
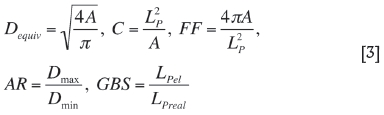
Prikryl (2006) also proposed that grain shape and size can be characterized by using the following parameters:
A Area
Lp Perimeter
Dmax, Dmin Major and minor axis length (Herdan and Smith, 1953)
Dequiv Equivalent diameter (Petruk, 2000)
C Compactness
FF Form factor (Howarth and Rowlands, 1986, 1987)
AR Aspect ratio
GBS Grain boundary smoothness.
Schematic views of these properties and calculations are given in Figure 1 and the following relationship.

Consequently, the results show that there is an inverse relation between grain size and rock strength. With decreasing grain size, rock strength tends to increase and vice versa (Olsson, 1974; Hugman and Friedman, 1974; Onodera and Kumara, 1980; Tugrul and Zarif, 1999).
Grain relationships
The complex relationships between adjacent grains have been characterized by Dreyer (1973). He proposed an index of interlocking (g), given by:

where
n = Number of grains
Lpi = Fraction of the perimeter of grain contacting the adjacent grain.
Dreyer (1973) also proposed an equation to quantify the homogeneity of grains by means of an index of grain size homogeneity (t) (Equation [5]).

where
Aavg = Average cross-sectional area of grains
Ai = Individual grain area.
The high values of these parameters indicate the complexity of intergranular relationships in texture.
As reported by Howarth and Rowlands (1987) from the study of Hoek (1965), the degree of grain interlocking plays an important role in the resistance of rock against applied stress by increasing the strength of the material. Higher values of stress are required to initiate cracks at grain boundaries for tightly packed and well cemented grains such as in igneous and metamorphic rocks.
Grain and matrix relationship
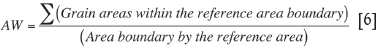
The matrix also has an important effect on the strength of rock. Rock strength is controlled by the strength of matrix material, which is generally less than the grain strength. Generally, cracks start inside the matrix under stress conditions and propagate through the matrix material. Packing density is also correlated with strength properties. Increasing the packing density increases the strength (Bell, 1978). Voids between the grains (porosity) that are not cemented with matrix also have an adverse effect on the strength of material (Price, 1960; Smordinov et al., 1970; Dube and Singh, 1972; Tugrul and Zarif, 1999). Howarth and Rowlands (1987) proposed a relationship (Equation [6]) to quantify packing density, which is area weighting (AW) as relative proportions of grains and matrix.
Effect of mineral content
Numerous studies have been conducted regarding the relationships between geomechanical and petrographical properties, including mineralogical content of intact rock material, mostly focusing on granitic rocks and indicating the importance of petrographic investigation (Mendes et al., 1966; Willard and McWilliams, 1969; Hallbauer et al., 1978; Irfan and Dearman, 1978; Fahy and Guccione, 1979; Verhoef and Van DeWall, 1998; El Bied et al., 2002). There are also some studies on estimating rock strength from petrographical properties based on statistics (Shakoor and Bonelli, 1991; Richards and Bell, 1995; Bell and Culshaw, 1998; Prikryl, 2001). Previous research has focused mainly on the relation between quartz content and rock strength. Merriam et al. (1970) proposed a relationship between quartz content and tensile strength, while Irfan and Dearman (1978) developed a micropetrographic index that shows good correlation with geomechanical parameters for granite. This was also previously investigated and proposed by Mendes et al. (1966). However, most of the studies have shown conflicting results due to the nature of the material. For instance, Gunsallus and Kulhawy (1984) also found a definite relation between quartz content and rock strength. However, Bell (1978), Fahy and Guccione (1979), Shakoor and Bonelli (1991), and Tugrul and Zarif (1999) found no correlation. Similarly, Prikryl (2006) found no significant correlation between mineral content and mechanical properties, except for mica content. Phillipson (2008) also reported that there is no correlation between quartz content and rock strength in shale; on the other hand, he also proposed that sutured mica grains do not affect rock strength. Consequently, although nearly 50 years of investigations have shown that minerals such as quartz, feldspar, mica, etc. affect rock strength, owing to the complex textures as well as random behaviour, the relation between mineral content and strength has not been quantified to date.
Texture coefficient
Rock texture, which is characterized by the relative amounts of minerals, grain sizes and shapes, and the manner in which the grains interlock (Merriam et al., 1970) has been described by several researchers. The pioneering work on quantification of rock texture was proposed by Howarth and Rowlands (1986; 1987). The main differences between the texture coefficient and the other texture models are based on the parameters used for the characterization. The quantitative assessment of rock texture depends on the parameters given in Equation 7.

where
N0, Ni = The number of grains not elongated and elongated (see below)
FF0 = Form factor for grain circularity
AR1 = Aspect ratio
AF1 = Angle factor for orientation
AW = Area weighting for degree of grain packing.
Hence, this concept takes into account more geometrical properties of grains as well as grain and matrix relations, except mineral contents. In the formula, N0 and N1 are the number of grains whose aspect ratios are below and above a pre-set discrimination level respectively, which is defined as 2.0 by Howarth and Rowlands (1986, 1987). Grains with AR greater than 2.0 are described as elongated. FF0 is the arithmetic mean of FF of grains that are not elongated as calculated by Equation [3]. AR1 is the arithmetic mean of the AR of elongated grains as per Equation [3]. AF1 is used to quantify orientation for elongated grains, while AW is calculated from Equation [6]. The application details of the texture coefficient are comprehensively described by Howarth and Rowlands (1987).
The proposing of texture coefficient can also make it possible to investigate the relation between texture and mechanical properties of rocks, summarized in Table I. Although previous investigations (e.g. Tiryaki and Dikmen, 2006) included the relationship between TC and several mechanical, physical, drillability, and cuttability properties of rock, only the relationship between the TC and rock strength is given in Table I.
Although TC is useful for predicting mechanical properties of rocks, especially for similar lithologies (Ersoy and Waller, 1995; Azzoni et al., 1996; Prikryl, 2006), there are also contradictory correlations between TC and strength (Ozturk et al., 2004; Alber and Kahraman, 2009). This is because the complexity of rock texture limits the correlation between texture and mechanical properties. However, texture and strength can be correlated at least to the extent that the strength class of rock material can be established, and this can also encourage researchers to extend experimental studies for the application of texture coefficient in rock engineering. On the other hand, the TC values in these previous studies were derived from only a single photograph.
The current investigation uses a statistical assessment of quantified data from 12 photographs of a thin section to obtain a unique TC, thus increasing the reliability of estimation models for strength compared with the studies summarized in Table I.
Experimental studies
The relationship between texture and strength of intact rock material was investigated by image analysis of thin sections of rock samples studied previously by Bilgin and Shahriar (1987), Bilginet et al., (1988), Kahraman (2001), Kahraman et al (2005), and Ozturk and Nasuf (2002) that had been retained for further analysis. These studies and materials are summarized briefly below.
Bilgin and Shahriar (1987) carried out an extensive rock cuttability test on samples taken from the Zonguldak Amasra bituminous coal basin in northern Turkey. The samples were obtained from a borehole drilled to a depth of nearly 1000 m, and were taken from depths ranging between 40 m and 399 m. Bilginet et al. (1988) researched the cuttability of a road header based on rock material and rock mass properties in a sewerage tunnel driven in Eyup, Istanbul in western Turkey. Kahraman (2001) and Kahraman et al. (2005) investigated the relationships between mechanical parameters of rock samples from different parts of Turkey. Ozturk and Nasuf (2002) studied the effect of loading conditions on texture in granites from the Balikesir region, also in western Turkey. All of these studies are used to obtain a well-established data-set to investigate the texture and strength relationship from experimental studies of thin sections.
Strength of rock materials
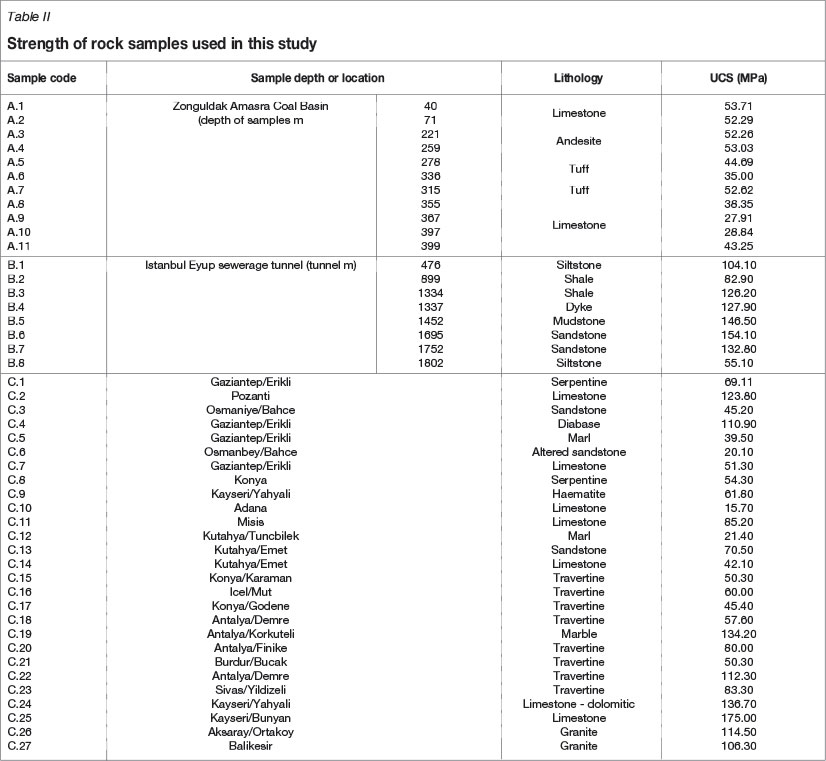
Although the aforementioned studies investigated a series of mechanical and physical properties of rock material, only uniaxial compressive strength is of interest in the current investigation. Table II and Figure 2 present the location, rock type, and the rock strength (UCS) of the samples used in this study.

Texture analysis
The TC for each rock sample was determined by analyses of textural properties. The main steps in TC determination from a thin section are summarized in Figure 3, and are divided into two groups. The first steps involve obtaining geometrical features of grains as independent parameters from image processing, and the second determining the dependent parameters for TC value.

Thin sections were split into frames and images captured from a camera mounted on the microscope were taken from the centre of each frame (Figure 4). Using this method, multiple images from a single thin section can be used for a statistical assessment after determining the TC values for each image. The statistical assessment of all of these images can be used to calculate the average TC values, which decreases the possible bias based on microscopic analysis.
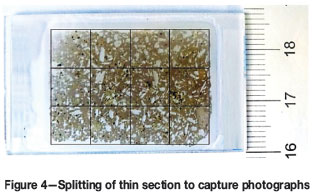
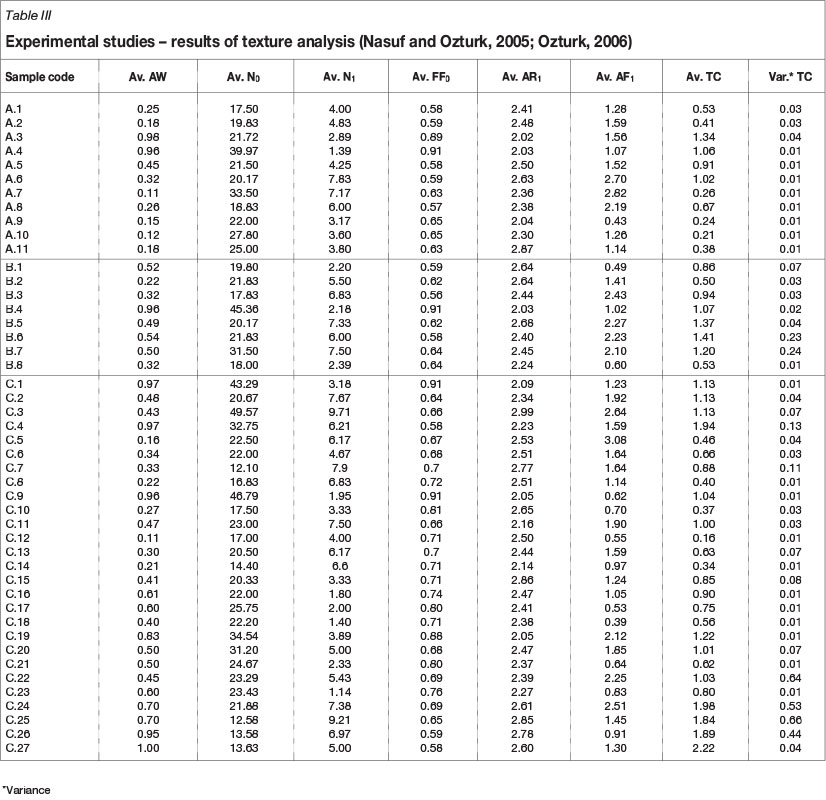
The main difficulty in using texture analysis to obtain a reliable result from image processing is defining grain and matrix boundaries properly. As can be seen in Figure 1, drawing the perimeter of each grain is sometimes very difficult due to the subjective approach and complex structure of grain sutures. This is mainly because of picture frame limitations and the non-homogenous structure of texture. To eliminate these drawbacks, it is proposed to take at least twelve photographs by splitting the thin section. Statistical analysis of the data from image processing of each photograph is used to obtain a number that corresponds to a dimensionless value for rock texture. The study also proposes to correlate the number of photographs with the variance of the TC. If the variances of the overall data analysis for the TC are high, it is recommended that more photographs be taken to decrease the variance and bias as well as for re-analysis. The results of the texture analysis experiments based on the proposed technique are presented in Table III. The data-set used in this study represents the first application of this statistical evaluation technique of texture analysis, as summarized in Figure 3.
Statistical assessments of the results
The statistical assessments of the results obtained from the strength and texture properties of the samples are given in Table IV and Figure 5.
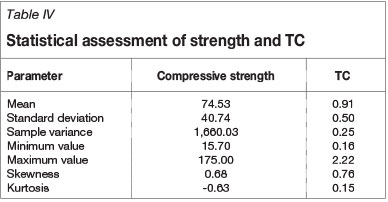
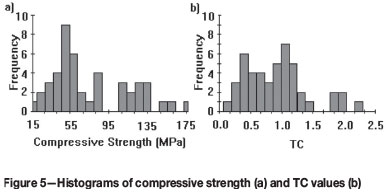
These basic statistical assessments are useful in understanding the validity of strength prediction from texture as proposed in this study. Histograms of strength and TC values as well as statistical parameters show that the strength values are clustered around 75 MPa, while the minimum and maximum strength values are 15.70 MPa and 175.00 MPa. On the other hand, nearly half the samples, which have compressive strength value more than 100 MPa, have a variance greater than 0.15. Texture analysis of rocks stronger than 100 MPa should be conducted in detail by taking more photographs, and the image analysis results from each photograph should be checked statistically to decrease the variation of texture analysis. The number of grains in each texture photo should be between 20 and 50, as proposed by Howarth and Rowlands (1987). On the other hand, although it was proposed to take the AW as 1.0 for igneous rocks, AW values ranged from 0.95 to 1.0 for the samples coded as A[3;4], B4, C[1;4;9;19;26]. The possible causes of these small deviations from 1.0 are as follows.
i) The volcanic glass in andesite (A.3, A.4) is regarded as non-granular material
ii) The dyke consists of 85% crystalline feldspar and some of the remaining grains are altered for B.4, based on mineralogical investigation
iii) Due to the grain contacts and in situ stress conditions, voids are observed among grains in serpentine and diabase C.1 and C.4)
iv) The alteration of haematite is the reason for the AW value of 0.96 for C.9
v) The AW of 0.83 for C.19 is due to a matrix of micritic limestone, as shown by mineralogical analysis
vi) Due to the high values of elongation caused by in situ stress for granite (C.26), heavily milled quartz material is taken as non-granular, resulting in an AW of 0.95.
Strength and texture relationships
The relationships between rock strength and quantified rock texture are obtained by regression based on constructing a scattergram and fitting a trend line. The value of the correlation coefficient (r2) was used to ascertain the validity of the trend line. Investigations for the prediction models were carried out based on the lithology of the materials and geometrical features of the texture constituents.
Investigation based on lithology
Firstly, estimation was performed and a trend line was obtained as shown in Figure 6, without classifying the data. However, the results do not indicate any significant correlation due to the low value of the correlation coefficient (r2=0.52). It can be seen that an increasing value of TC indicates an increasing compressive strength.

In the next step, the data for sandstone, siltstone, marl, and shale was separated (Figure 7). The correlation coefficient of the dotted line (r2=0.93) is quite acceptable when the two data points C.3 and C.6, which represent sandstone and altered sandstone, are omitted from the graph due to their magnitudes of scattering.

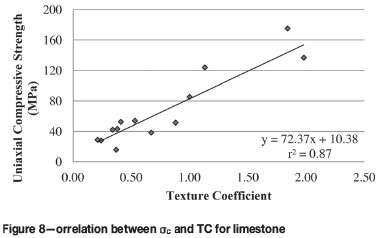
The model for limestone can be seen in Figure 8. According to the result of the analysis, compressive strength can be reliably estimated from the rock texture coefficient (r2=0.87).
The results show that classifying the data based on lithology can increase the reliability of the models for estimating rock strength from the TC. The values of r2 that can be used to ascertain the reliability of the models are different in the regression models. Increasing or decreasing values of r2 can be explained only by differences based on lithology. Consequently, materials consisting of small, well-rounded grains, such as sandstone or siltstone, display a more reliable relationship between texture and strength. This is probably the most important reason for the high values of r2 obtained for sandstone, siltstone, marl, and shale. The reliability of the regression model proposed for limestone is lower due to the larger and more elongate grains compared with the sandstone samples.
Investigation based on grain features
Correlation of rock strength versus TC was also investigated based on grain features. Each data sample was classified according to the value of the form factors (FF0) and aspect ratios (AR1), which were used to characterize the circularity as well as elongation of grains. A regression model was applied for the TC and σc of the data with FF0 values between 0.65 and 0.88, and AR1 between 2.04 and 2.61, and a trend line between quantified rock texture and strength was constructed (Figure 9). The intervals are selected to propose a model for rocks that consist of grains with intermediate elongation and circularity. The results show that rock strength tends to increase with increasing TC and can be estimated from the equation given in Figure 9, with r2=0.76.

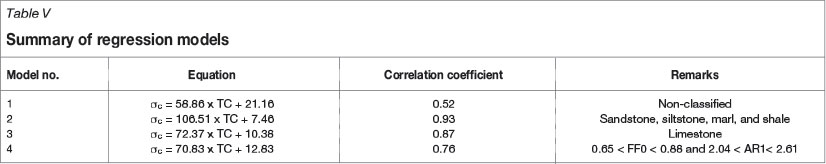
A summary of the output of this study for the prediction is given in Table V.
Discussion
Apart from the current studies to quantify rock texture by using the TC, a procedure is given based on statistical evaluation of a thin section of a rock sample. This procedure is based on dividing the thin section by means of a grid of squares and then capturing images from the centre of each square. Hence, at least 12 photos of a single thin section are processed by image analysis and statistical analysis can be applied to obtain a dimensionless value of rock texture. Since texture analysis sometimes delivers contradictory results, as summarized in Table I, a greater number of photographs from a single thin section are taken for analysis in order to eliminate this difficulty, and statistical analysis is used to obtain the optimum value of the TC. The number of images should be based on the variance of the TC. The results of the experimental analyses show that if the rock strength is greater than 100 MPa, it is preferable to take more images for processing due to the increasing variance for the TC. The increasing strength values may be the consequence of the increases in TC due to the greater number of elongated and non-circular grains. This probably explains the high variance obtained with higher strength values.
The data-set obtained from the studies was used to set up regression models to estimate rock strength from the TC. Four different regression models are proposed to predict rock strength based on lithology and grain features. Firstly, the plot of σcversus TC for all samples shows a high degree of scatter. The result shows that although there is a broad trend between σcc and TC, strength cannot be estimated due to the poor value of the correlation coefficient (r2=0.52). However, this trend can be used to classify the rock samples based on relative strength. Hence, the data is classified based on lithology. A regression model, which is σc=l06.51xTC+7.46, is proposed for the materials classified as sandstone, siltstone, marl, and shale. The high correlation coefficient of 0.93 shows that the strength can be reliably predicted from the TC. The regression model proposed for limestone, that is σc=72.37xTC+l0.38, also has a high r2 (0.87). The strength and the TC values for limestone display a linearly increasing trend, which is also valid for the materials classified as sandstone, siltstone, marl, and shale. These results show that classifying the rock materials based on lithology increases the reliability of the prediction models. Apart from the lithological classification, grain features are used to classify the rock materials, using FF0 and ARi parameters. FF0 is taken between 0.65 and 0.88, while ARi is taken between 2.04 and 2.61 for this classification to obtain materials with grains that are neither over-elongated nor over-circular. A regression model obtained from this classification, that is σc = 70.83xTC+l2.83, with r2=0.76, is usable for estimation, but is not as reliable as the regression models determined from lithological classifications. This equation is proposed to predict strength values for materials that are not classified as either sandstone, siltstone, marl, shale, or limestone.
These proposed regression models can be particularly useful for projects that involve the mechanical properties of rock environments. The uniaxial compressive strength value for rock materials is one of the important and useful parameters employed in design studies carried out in rock environments. The proposed equations are also useful for predicting the value of compressive strength from a rock thin section obtained from a simple rock sample. These investigations will be particularly applicable for projects at the pre-feasibility stage. Ozturk and Nasuf (2013) demonstrate a simple application of strength classification of rock materials based on rock texture that also used some the data from this study. In their example, the value of the intact rock rating for rock mass rating classification system (RMR) is predicted from TC, which is a good example of the application of texture analyses in rock engineering.
Conclusions
The texture coefficient (TC) was used to interpolate the correlation between rock strength and texture so as to estimate the uniaxial compressive strength (σc) of rock material.
In this study, a procedure is proposed to determine the TC from 12 images taken from a single rock thin section. This procedure can be used to increase the reliability of the texture analysis, which sometimes suffers from subjective interpretation in defining the grain boundaries. A higher variance for the TC indicates that more images should be used for image processing to decrease the variance and increase the reliability of the TC value for quantifying rock texture.
A data-set including 46 data samples from 15 rock samples of different lithologies, with strength values ranging from 15.70 MPa to 175.00 MPa, was used in this study based on statistical assessment of texture analyses. Four different regression models are also proposed. The first may be of use only to establish the strength class of intact rock, due to its low correlation coefficient (r2) value. The classification of the material based on lithology is used to propose two more regression models. The one can be used to predict σc for sandstone, siltstone, marl, and shale, while the second is used for limestone. The final regression model is proposed to predict σc from the TC based on grain features. Form factor (FF0) and aspect ratio (ARI0) are used as the parameters to represent grain features of intact rock. These results show that the classification of the intact rock based on lithology increases the reliability of the prediction models derived from regression analysis. Further investigations based on different lithologies are highly recommended to investigate the feasibility of estimating at least the strength class of rock material by microscopic investigations.
References
Alber, M. and Kahraman, S. 2009. Predicting the uniaxial compressive strength and elastic modulus of a fault breccia from texture coefficient. Rock Mechanics and Rock Engineering, vol. 42. pp. 117-127. [ Links ]
ASTM. 1984. Standard test method for unconfined compressive strength of intact rock core specimens. Soil and Rock, Building Stones. Annual Book of ASTM Standards 4.08. American Society for Testing and Materials, Philadelphia, PA. [ Links ]
Azzoni, A., Bailo, F., Rodena, E., and Zaninetti, A. 1996. Assessment of texture coefficient for different rock types and correlation with uniaxial compressive strength and rock weathering. Rock Mechanics and Rock Engineering, vol. 29, no.1. pp. 39-46. [ Links ]
Beddow, J.K. and Vetter, A.F. 1977. The use of classifiers in morphological analysis of articulates. Journal of Powder and Bulk Solids Technology, vol. 1. pp. 42-45. [ Links ]
Bell, F.G. 1978. The physical and mechanical properties of the Fell sandstones, Northumberland, England. Engineering Geology, vol. 12. pp. 1-29. [ Links ]
Bell, F.G. and Culshaw, M.G. 1998. Petrographic and engineering properties of sandstones from the Sneinton Formation, Nottinghamshire, England. Quarterly Journal of Engineering Geology, vol. 31. pp. 5-19. [ Links ]
Bilgin, N., Seyrek, T., and Shahriar, K. 1988. Roadheaders in Istanbul Golden Horn clean-up contributes valuable data. Tunnels and Tunnelling, June. pp. 41-44. [ Links ]
Bilgin, N. and Shahriar, K. 1987. Developing a measurement system for mechanized excavation in mines and application to Amasra bituminous coal basin of Turkish Hard Coal Enterprise (in Turkish). Report no. 674. Science and Technology Research Council of Turkey (TUBITAK), Istanbul. [ Links ]
Brace, W.F. 1961. Dependence of fracture strength of rocks on grain size. Proceedings of the 4th Symposium on Rock Mechanics, University Park, Penn., PA. pp. 99-103. [ Links ]
Broch, E. and Franklin, J.A. 1972. Point-load strength test. International Journal of Rock Mechanics and Mining Science, vol. 9, no. 6. pp. 669-697. [ Links ]
Cox, M.R. and Budhu, M.A. 2008. Practical approach to grain shape quantification. Engineering Geology, vol. 96. pp. 1-16. [ Links ]
Dreyer, W. 1973. The Science of Rock Mechanics. Part I. The Strength Properties of Rocks. 2nd edn. Series on Rock and Soil Mechanics, 1 (1971/73). Trans. Tech. Publications, Clausthal. [ Links ]
Dube, A.K. and Singh, B. 1972. Effect of humidity on tensile strength of sandstone. Journal of Mining Metallurgy and Fuel, vol. 20, no. 1. pp. 8-10. [ Links ]
Eberhardt, E., Stimpson, B., and Stead, D. 1999. Effects of grain size on the initiation and propagation thresholds of stress-induced brittle fractures. Rock Mechanics and Rock Engineering, vol. 32, no. 2. pp. 81-99. [ Links ]
Ehrlich, R. and Weinberg, B. 1970. An exact method for characterization of grain shape. Journal of Sedimentary Petrology, vol. 40, no. 1. pp. 20--212. [ Links ]
El Bied, A., Sulem, J., and Martineau, F. 2002. Microstructure of shear zones in Fontainebleau sandstone. International Journal of Rock Mechanics and Mining Science, vol. 39. pp. 917-932. [ Links ]
Ersoy, A. and Waller, M.D. 1995. Textural characterization of rocks. Engineering Geology, vol. 39. pp. 123-136. [ Links ]
Fahy, M.P. and Guccione, M.J. 1979. Estimating strength of sandstone using petrographic thin-section data. Bulletin of the International Association of Engineering Geology, vol. 16, no. 4. pp. 467-485. [ Links ]
Gunsallus, K.L. and Kulhawy, F.N. 1984. A comparative evaluation of rock strength measures. International Journal of Rock Mechanics and Mining Science and Geomechanical Abstracts, vol. 21, no. 5. pp. 233-248. [ Links ]
Hallbauer, D.K., Nieble, C., Berard, J., Rummel, F., Houghton, A., Broch, E., and Szlavin, J. 1978. Suggested methods for petrographic description. ISRM commission on standardization of laboratory and field tests. International Journal of Rock Mechanics and Mining Science, vol. 15. pp. 41-45. [ Links ]
Herdan, G. and Smith, M.L. 1953. Small Particle Statistics. Elsevier, Houston, TX. [ Links ]
Hoek, E. 1965. Rock fracture under static stress conditions. Report no. MEG 383. CSIR, Pretoria, South Africa. [ Links ]
Howarth, D.F. and Rowlands, J.C. 1986. Development of an index to quantify rock texture for qualitative assessment of intact rock properties. Geotechnical Testing Journal, vol. 9. pp. 169-179. [ Links ]
Howarth, D.F. and Rowlands, J.C. 1987. Quantitative assessment of rock texture and correlation with drillability and strength properties. Rock Mechanics and Rock Engineering, vol. 20. pp. 57-85. [ Links ]
Hugman, R.H. and Friedman, M. 1979. Effects of texture and composition on mechanical behaviorof experimentally deformed carbonate rocks. Association of Petroleum Geological Bulletin, vol. 63, no. 9. pp. 1478-1489. [ Links ]
Irfan, T.Y. and Dearman, W.R. 1978. The engineering petrography of a weathered granite in Cornwall, England. Quarterly Journal of Engineering Geology, vol. 11. pp. 233-244. [ Links ]
International Society of Rock Mechanics (ISRM). 1981. Rock characterization testing and monitoring. ISRM Suggested methods. Brown E.T. (ed.). Pergamon Press, Oxford. [ Links ]
Kahraman, S., Günaydin, O., and Fener, B. 2005. The effect of porosity on the relation between uniaxial compressive strength and point load index. International Journal of Rock Mechanics and Mining Science, vol. 42. pp. 584-589. [ Links ]
Kahraman, S. 2001. Evaluation of simple methods for assessing the uniaxial compressive strength of rock. Engineering Geology, vol. 38. pp. 981-994. [ Links ]
Kaye, B.H.1982. Review of new methods for characterizing the shape and texture of fine particles. Journal of Powder and Bulk Solids Technology, vol. 6, no. 2. pp. 1-4. [ Links ]
Krumbein, W.C. 1941. Measurement and geological significance of shape and roundness of sedimentary particles. Journal of Sedimentary Petrology, vol. 11. pp. 64-72. [ Links ]
Mendes, F.M., Aires-Barros, L., and Rodrigues, F.P. 1966. The use of modal analysis in the mechanical characterization of rock masses. Proceedings of the 1st International Congress On Rock Mechanics, Lisbon, vol. 1. pp. 217-223. [ Links ]
Merriam, R., Rieke, H.H., and Kim, Y.C. 1970. Tensile strength related to mineralogy and texture of some granitic rocks. Engineering Geology, vol. 4. pp. 155-160. [ Links ]
Nasuf, E. and Ozturk, C.A. 2005. Investigation into the texture properties of rock by image processing and correlations between texture and mechanical properties (in Turkish). Report no. 199Y046. Science and Technology Research Council of Turkey (TUBITAK), Istanbul, Turkey. [ Links ]
Olsson, W.A. 1974. Grain size dependence on yield stress in marble. Journal of Geophysical.Research, vol. 79, no. 32. pp. 4859-4861. [ Links ]
Onedera, T.F. and Asoka Kumara, K.H.M. 1980. Relation between texture and mechanical properties of crystalline rocks. Bulletin of the International Association of Engineering Geology, vol. 22. pp. 173-177. [ Links ]
Ozturk, C.A. 2006. Classification of rock texture properties and rock engineering applications (in Turkish). PhD thesis, Istanbul Technical University, Istanbul, Turkey. [ Links ]
Ozturk, C.A. and Nasuf, E. 2002. Investigation into the textural properties of rocks under different load conditions (in Turkish). Proceedings of the 6th National Rock Mechanics Symposium, Turkey. pp. 147-153. [ Links ]
Ozturk, C.A., and Nasuf, E. 2013. Strength classification of rock material based on textural properties. Tunnelling and Underground Space Technology, vol. 37. pp. 45-54. [ Links ]
Ozturk, C.A., Nasuf, E., and Bilgin, N. 2004. The assessment of rock cutability, and physical and mechanical rock properties from a texture coefficient. Journal of the South African Institute of Mining and Metallurgy, vol. 7. pp. 397-403. [ Links ]
Petruk, W. 2000. Applied Mineralogy in the Mining Industry. Elsevier, Amsterdam. [ Links ]
Phillipson, S.E. 2008. Texture, mineralogy, and rock strength in horizontal stress-related coal mine roof falls. International Journal of Coal Geology, vol. 75. pp. 175--84. [ Links ]
Price, N.J. 1960. The compressive strength of coal measure rocks. Colliery Engineering, vol. 37. pp. 283-292. [ Links ]
Prikryl, R. 2006. Assessment of rock geomechanical quality by quantitative rock fabric coefficients: limitations and possible source of misinterpretations. Engineering Geology, vol. 87. pp. 149-162. [ Links ]
Prikryl, R. 2001. Some microstructural aspects of strength variation in rocks. International Journal of Rock Mechanics and Mining Science, vol. 38. pp. 671-682. [ Links ]
Richards, N.P. and Bell, F.G. 1995. A survey of some petrographic and engineering properties of sandstones from the Natal Group, South Africa. Proceedings of the 8th International Congress on Rock Mechanics, vol. 3. pp. 1131-1136. [ Links ]
Shakoor, A. and Bonelli, R.E. 1991. Relationship between petrographic characteristics, engineering index properties, and mechanical properties of selected sandstones. Bulletin of the International Association of Engineering Geology, vol. 28. pp. 55-71. [ Links ]
Singh, B. and Goel, R.K. 2011. Engineering Rock Mass Classification, Tunnelling, Foundations, and Landslides. Elsevier, Amsterdam. [ Links ]
Smordinov, M.I., Motovilov, E.A., and Volkov, V.A. 1970. Determination of correlation relationships between strength and some physical characteristics of rocks. Proceeding of the 2nd International Congress of the Society on Rock Mechanics, vol. 2. pp. 35-37. [ Links ]
Tiryaki, B. and Dikmen, A.C. 2006. Effects of rock properties on specific cutting energy in linear cutting of sandstones by picks. Rock Mechanics and Rock Engineering, vol. 39, no. 2. pp. 89-120. [ Links ]
Tugrul, A. and Zarif, I.H. 1999. Correlation of mineralogical and textural characteristics with engineering properties of selected granitic rocks from Turkey. Engineering Geology, vol. 51. pp. 303-317. [ Links ]
Verhoef, P.N.W. AND Van De Wall, A.R.G.1998. Application of petrography in durability assessment of rock construction materials. Aggregate Resources: a Global Perspective. Bobrowsky, P.T. (ed.). Balkema. Rotterdam. pp. 307-330. [ Links ]
Wadell, H. 1932. Volume, shape and roundness of rock particles. Journal of Geology, vol. 40. pp. 443-451. [ Links ]
Willard, R.J. and McWilliams, J.R. 1969. Microstructural techniques in the study of physical properties of rocks. International Journal of Rock Mechanics and Mining Science, vol. 6. pp. 1-2. [ Links ]
Williams, H. 1982. Petrography. WH Freeman, San Francisco, CA. [ Links ]

