


Services on Demand
Article
 English (pdf)
 Article in xml format
 Article references
Indicators

Related links
-
 Cited by Google
 -
 Similars in Google
Share

 Permalink
Journal of the Southern African Institute of Mining and Metallurgy
On-line version ISSN 2411-9717
Print version ISSN 2225-6253
J. S. Afr. Inst. Min. Metall. vol.114 n.6 Johannesburg Jun. 2014
GENERAL PAPERS
Empirical observations of dilution in panel caving
R.L. Castro; P.S. Paredes
University of Chile, Santiago, Chile
SYNOPSIS
The extraction of ore in panel caving operations also involves the co-extraction of non-economic material, known as dilution. Forecasting, avoiding, and understanding the mechanics of dilution is critical to long-term planning. The models of dilution that are currently in use in panel caving operations are those by Laubscher (1994), who postulated that dilution is due to gravitational flow and depends on the height of interaction, the column height, and the draw uniformity. This paper presents a back-analysis of extraction and dilution behaviour at Codelco's El Salvador and Andina Divisions, which use panel caving as a mining method. This analysis was conducted in order to review the existent dilution entry mechanisms and calculation methods. Three sources of dilution were identified. The first source is 'gravitational dilution', which is due to gravitational flow and mixing as dilution migrates by gravity from a sector located above the panel under analysis. The second source of dilution is 'caving dilution', which occurs when an air gap is formed in a large area and a sudden propagation of a hang-up occurs, inducing early ingress of waste into the production level from a level above. The third mode observed is 'lateral dilution', which occurs when the panel is located next to an exhausted sector and the broken material enters the draw column early during draw. In the last two cases, dilution could migrate large distances horizontally. The mine data indicated that draw and caving strategy are key for long-term planning of large panel caves.
Keywords: panel caving, dilution entry, gravity flow mechanics, draw control, uniform draw.
Introduction
Dilution is an integral part of a cave mining operation and thus the control and understanding of its main sources are crucial in managing a caving operation. Dilution may have diverse sources, including the position of the ore/waste, the percolation of fines, and the draw control at the mine. There are ways to control the amount of dilution in panel caving through mine planning. For example, DeWolfe (1981) states that, in order to control dilution in a panel caving operation, the gap between the extraction pile and the cave back must be kept to a minimum so that the waste does not rill to the new open drawpoints. This is achieved by adjusting the angle of draw, which should be set below 45° to avoid early dilution from previously exhausted levels. Laubscher (1994, 2000) postulated that dilution content is controlled by a set of parameters ranging from the design to the mine operation itself. These parameters include the spacing of drawpoints, the geometry of the orebody, the way in which drawpoints are extracted, and the flow characteristics of the ore and waste. A review of the parameters affecting dilution is shown in Table I.
In quantitative terms, there have been attempts to derive formulae to evaluate dilution entry at caving operations and from them the amount of dilution. Laubscher (1994) defines the dilution entry as the percentage of column drawn when dilution is observed at a drawpoint. Based on empirical observations he proposed the following relationship to calculate the dilution entry point (DEP)
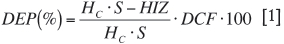
where HIZ is the height of the interaction zone, Hc is the draw column height, S is the swell factor of the column, and DCF is the draw control factor, which is determined from the standard deviation of the tonnage extracted from the working drawpoints normalized by 100 at a monthly scale (SD ) as:

Susaeta (2004) based on an analysis of Codelco's extraction data postulated that dilution behaviour behaviour would depend on the way the draw is conducted at a mine, thus expanding on Laubscher's model and defining three dilution mechanisms: interactive, isolated-interactive, and isolated. Therefore, when a drawpoint is drawn in isolation, dilution entry is low and the amount of dilution increases rapidly during extraction. In isolated-interactive draw, dilution entry is moderate and dilution content will also increase moderately. In interactive draw, which occurs under uniform draw, dilution content would be low. The definition of the flow mechanism is postulated to depend on the value of the uniformity index (IU), an index that accounts for the uniformity of the draw control at the mine.
The latest research conducted in the field using markers has helped understanding of near-field flow, and demonstrated that flow is quite chaotic in block caving environments (Brunton et al., 2012). New experirments are planned to confirm these results (Castro and Armijo, 2012). The use of markers and the results of the data analysis could be used to improve understanding of the ore flow and to improve mine planning, especially as more markers are being recovered under this research programme.
Despite the large amount of research and practical observations of panel caving operations, no guidelines have emerged for long-term planning to control dilution entry.
This paper presents a thorough analysis of dilution at six productive sectors of Codelco's caving operations as part of a broad and exhaustive review of dilution observed at the mines. In addition, the framework for building and calibrating a model for predicting the mean dilution entry point, based on mine data, is presented.
Mine data collection and analysis
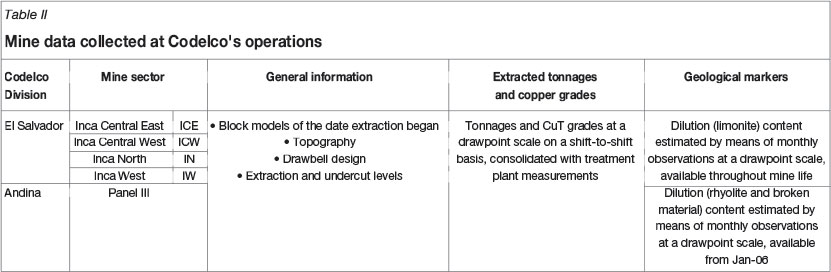
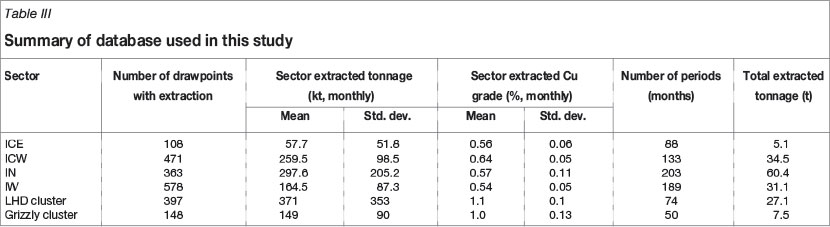
The information collected at Codelco's underground operations is presented in Table II. It is worth noting that the geological marker used to describe dilution is different for each mine. The data is also recorded differently. At El Salvador, only the limonite content (percentage observed at drawpoint) is declared and is usually recorded by the mine production control (MPC) personnel. The case of Andina is different: a trained geologist records the rhyolite (percentage observed at drawpoint) as well as the caved rock material (percentage observed at drawpoint) coming from the Panel II exhausted sector. For El Salvador and Andina, the geological marker information is collected on a drawpoint basis every 2000 t, along with grade control.
This investigation is based on one of the largest data-sets used to date, where 2065 drawpoints were analysed corresponding to the extraction of 166 Mt. This long draw history corresponds to a period of 737 months in total (as per Table III).
Geological marker entry definition
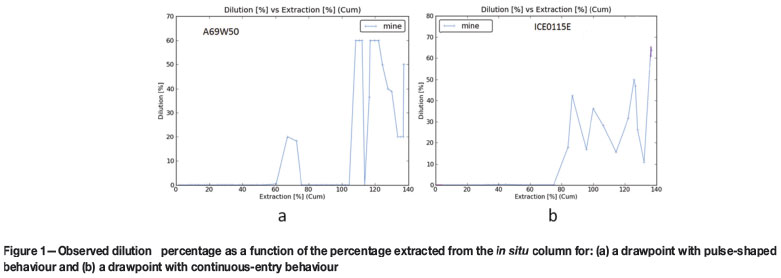
The first stage in studying the mechanisms by which dilution enters the drawpoints is to establish a generalized criterion for declaring dilution entry at a drawpoint. To do this, the dilution curves of the 1674 drawpoints that reported geological markers were analysed. After analysing the observed dilution content as a function of the percentage extracted from the in situ column, it is possible to identify two types of behaviour. The first is the pulse-shaped behaviour, where dilution reverts to zero after its first appearance (Figure 1a). The second is the continuous-entry behaviour, where dilution percentage does not revert to zero after the first appearance and may or may not show a continuous increase (Figure 1b).
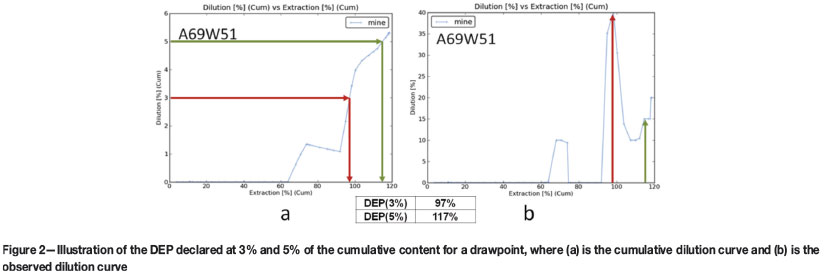
As approximately 51% of the dilution curves in the database have a pulse-shaped behaviour, we developed a criterion to define a range when a pulse of dilution is significant. This criterion can then be used towards determining that dilution entered the drawpoint. The cumulative dilution values for a period t are defined as:
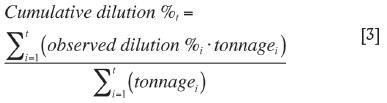
where observed dilution%i and tonnage, are the dilution percentages observed at the drawpoint and the tonnage drawn during period i, respectively. The cumulative curves allow for regularizing the curve behaviour and analyses when the overall dilution content exceeds a certain threshold. Once the use of the cumulative curves is selected, the criterion for declaring dilution entry at a drawpoint is reduced to selecting the threshold to be exceeded by cumulative dilution content. Figure 2 illustrates an example of the dilution content for the drawpoint A69W51 at El Salvador Mine. It also indicates the change in the tonnage at 3% [DEP(3%)] and 5% [DEP(5%)] of the overall (cumulative) dilution content. In this case, it is shown that a 3% cumulative is equivalent to 40% observed dilution at a drawpoint.
Four cumulative dilution values were investigated to define a significant value for dilution and to carry out a statistical analysis. It is worth noting that the dilution entry concept of Laubscher (1994) corresponds to zero cumulative dilution and has a large error or deviation for the purpose of carrying out statistical data analysis. The data analysis shows (Table IV) that the 3% threshold criterion (DEP(3%)) represents a robust volume of data and it is sufficient to reach steady state with respect to the numbers of drawpoints with declared dilution in a given sector. Therefore, in this paper we used the 3% threshold to define when a drawpoint has dilution.
At Andina, there are two different geological markers considered as dilution: (1) the broken rock from the previous panel and (2) the rhyolite. In this case, the dilution entry point is calculated separately for each of the markers, which are called broken entry (BEP) and rhyolite entry (REP), respectively.
Dilution entry analysis
The dilution entry analysis consisted of evaluating the dilution entry behaviour at a drawpoint scale and considering the diverse initial conditions of the different sectors, that is, in situ column heights, extraction sequence, and uniformity of extraction. This empirical analysis was carried out to develop a hypothesis for the mechanisms by which dilution entered the drawpoints. The uniformity index introduced by Susaeta (2004) was used to calculate the uniformity with which extraction was performed (IU).
El Salvador
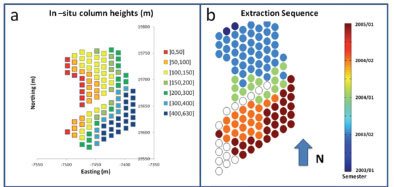
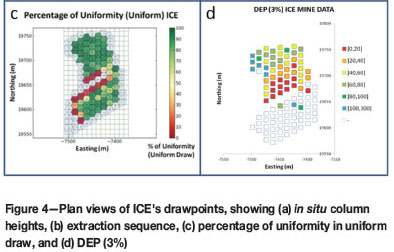
The four sectors analysed at El Salvador have different column height profiles and their extraction sequences have different directions relative to the location of the corresponding dilution source. Thus, dilution entry profiles at a drawpoint scale vary from one sector to another.
Figure 3 shows isometric views of the broken and in situ material contact surfaces for the El Salvador sectors. For Inca Central East (ICE), Inca North (IN), and Inca West (IW), the dilution sources are located mainly to the side of the sector, while for Inca Central West (ICW), the source is located above the sector. This has an important influence on the dilution entry profile for the different sectors, except for the IW sector, where a hang-up of the cave back that occurred during the first stages of extraction caused rapid dilution entry after an air blast (De Nicola and Fishwick, 2000).
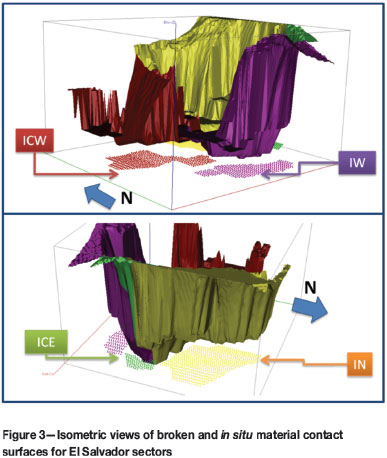
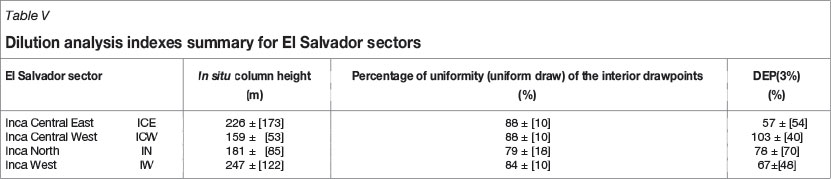
Table V summarizes the results of the analysis at the El Salvador sectors. It shows that two sectors with the same uniformity, but with different in situ column height profiles (ICE and ICW), have significantly different mean dilution entry points. In other words, dilution entry does not depend on the uniformity percentage when the dilution source is located next to the sector instead of above it. Table V summarizes the dilution entry hypothesis for the El Salvador sectors based on the analysis.
The mechanisms observed for dilution entry depend on the initial boundary conditions of the different sectors.
For Inca Central East, the extraction sequence proceeds from the lowest in situ column (under 50 m) to the higher ones (over 400 m). This means that the extraction sequence starts from the dilution source in the north. Following the sequence, the dilution entry point decreases until a broken rock pillar created by the inactive drawpoints (orepasses) acts as a dilution barrier. In this case, dilution travels from the source at the northern zone to the central zone (Figure 4d).
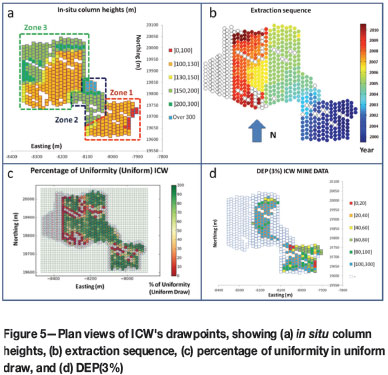
For the Inca Central West (ICW), the extraction sequence starts with 130 m in situ column heights (zone 1), passing through column heights of over 200 m (zone 2) and then back to 130 m in situ column heights (zone 3). In this case, the dilution source is located above the sector. The DEP(3%) goes from 40%to 100% for zone 1, then increases to over 100% for zone 2, and goes from 80% to over 100% in zone 3. Data shows that dilution enters due to the vertical displacement of the broken material from the sector previously extracted and located above ICW.
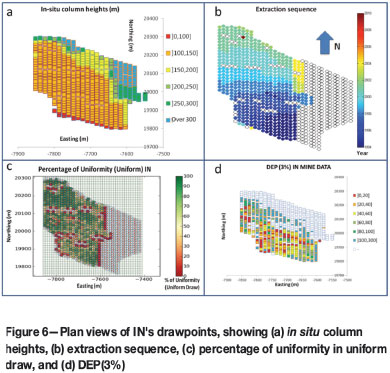
For the Inca North, the sequence started with in situ column heights ranging from under100 m to 150 m (most of the drawpoints), and finished extracting columns of over 200 m at the end of the sequence. Following the sequence, the dilution entry point decreases to the central zone of the sector (DEP(3%) under 40%) and then increases to the northern zone. The data indicates that dilution in the central zone comes from the southern zone with a large horizontal displacement, despite the uniform draw.
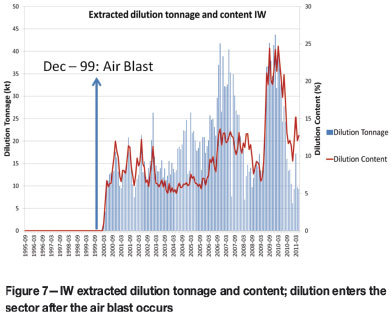
Finally, for the Inca West sector and as indicated in Figure 7, the dilution entered the sector after a large hang-up of the cave back collapsed at the beginning of the extraction sequence. This indicates that dilution entry is controlled by the sudden propagation of the cave back (De Nicola and Fishwick, 2000).
Andina
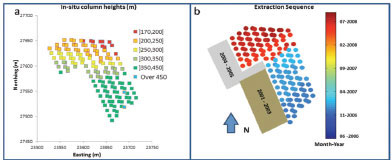
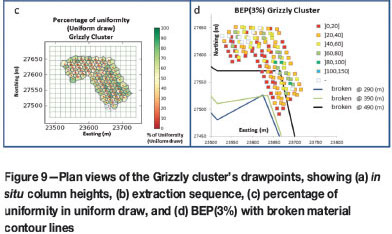
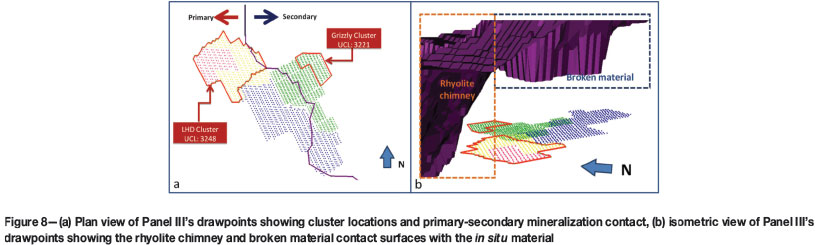
Andina's Panel III mine contains two rock types (primary and secondary mineralization) in the in situ columns. Thus, there are two main areas with different extraction layouts: the LHD area (mechanized extraction) and the Grizzly area. There are also two main geological markers (considered dilution): a rhyolite chimney, located in the northeastern side of Panel III, and broken material coming from the previously extracted sector (Panel II), located above the central area of the Panel III sector (Figure 8b). These two markers originated from different locations and therefore were analysed separately. Information on the geological markers at the Andina mine's drawpoints is available from January 2006. Thus, the geological markers' entry behaviour was analysed over two clusters where extraction started in January 2006. These clusters are located in the LHD and in the Grizzly area (Figure 8a).
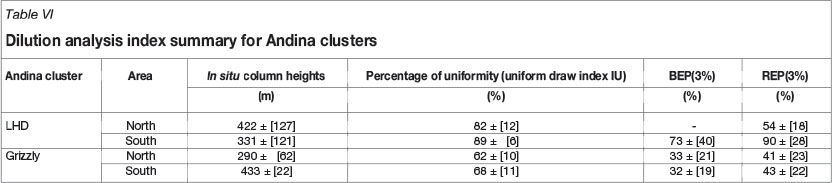
At the Grizzly and LHD clusters, different conditions prevailed regarding the original position of the broken material before extraction began. On the western side of the Grizzly cluster, there are two exhausted panels that form a wall of broken material; thus, the dilution source for this panel was located mainly next to the cluster and not above it (Figure 9b). On the other hand, the panel located at the southern side of the LHD cluster had extracted less than 10 m of the in situ columns when extraction began; thus, the dilution source was the broken material left from the extraction of the previous panel. Well-controlled extraction in terms of the uniformity at the LHD dilution cluster, together with the fact that dilution was located above the panel, led to high dilution (broken material) entry points for the cluster's drawpoints (Figure 10d). The broken material entry analysis for the Grizzly cluster shows that, despite the broken material source being located on the western side of the panel, the whole cluster shows evidence of early entry of this kind of dilution (Figure 9d). This could be due to the extraction of the old panel, which caused subsidence and flow of the broken ore to the new panel.
Dilution entry observations
Considering the dilution analysis performed for El Salvador and Andina mines, it is possible to hypothesize the following dilution mechanisms.
Vertical dilution
Dilution enters the drawpoints by descending gravitationally from the source, which in this case, is located above the panel under analysis. However, other phenomena, such as percolation, could occur for the finer rock. This phenomenon was observed at the Inca Central West (ICW) sector and the LHD cluster (Figure 11a). The dilution entry and ore recovery are high in relation to the other types of dilution.
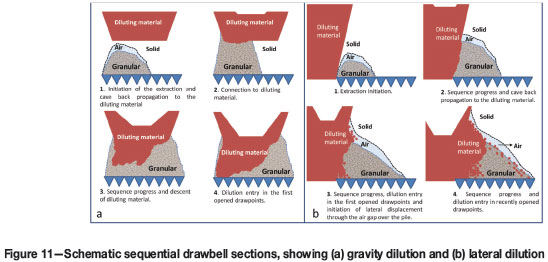
Lateral dilution
The cave back could preferentially propagate, in terms of rate, to the lateral interface of the in situ and broken material, when the dilution source is located next to the panel under analysis. This interface may not necessarily be vertical but have a smaller angle depending on geomechanical properties of the rock mass and the amount of ore removed at boundary points. If the air gap between the cave back and the muck pile is sufficiently large, caved waste rock will enter the draw columns and may travel horizontally depending on the pile slope. This phenomenon was observed at the Inca Central East (ICE), Inca North (IN), and the Grizzly cluster (Figure 11b). In this case the dilution entry is low, and if not controlled, such dilution could migrate large horizontal distances.
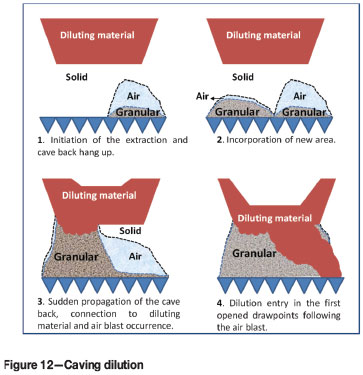
Dilution entry after an air blast event (caving dilution)
If the hydraulic radius of the initial opened area is insufficient for continuous propagationof the cave, a hang-up of the cave back will occur. If extraction continues in the opened area without incorporating new area, a large air gap will be generated. Once new area is incorporated, the cave back will suffer a sudden propagation and dilution located above the panel will enter the first opened drawpoints following an air blast. This is the case observed at the Inca West (IW) sector (Figure 12). In this case, the dilution entry and the recovery are low.
Conclusions
In this paper we presented an analysis of draw control data towards understanding dilution entry for long-term purposes. The data showed that boundary conditions (where dilution is located) and caving propagation are the most important factors to be considered for long-term planning purposes.
Other variables, such as uniform draw at a short term scale, are not so important for determining the entry of dilution for long-term planning. Rather, the draw strategy and cave back management seem to be the key for draw control purposes.
In terms of the stage of mining, dilution could occur during caving and after the cave has broken through to the surface. During cave propagation, if the extraction pile height is lower than the cave back height for a given area, an air gap could develop, allowing dilution to enter the draw column. Thus, if the draw rate (Vex) is larger than the cave propagation, a gap will form if:
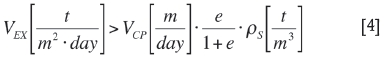
where e is the void ratio in the pile, (pS) is the solid density of the ore (t/m3), and Vcp is the rate of caving.
On the other hand, if the local slope (p) of the extraction pile heights of two contiguous drawbells in the sequence direction is greater than the friction angle of the diluting material, dilution will be able to rill and move laterally. The pile's slope angle is defined as:
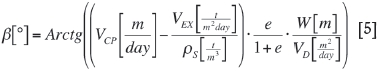
where(W) is the front width (m), and (VD) is the development rate (m2/d). There will be lateral displacement of dilution if β is greater than the friction angle of the diluting material θ or when tan (β) > tan(∅).
In addition, the ratio of ore volume to dilution contact surface area (ROD) and the difference between column heights influence the dilution entry. As the ratio of the ore volume to dilution contact surface area increases, the ore subjected to dilution decreases. Thus, dilution entry will be high, as ROD (in metres) is higher. On the other hand, the bigger the difference between the sector's column heights, the higher the potential for lateral dilution mixing; therefore, dilution entry will be small. There are other factors that influence dilution once the cave back has propagated, including draw control and percolation rate of the finer diluting rock such as cave propagation and extraction velocity, volume of ore to waste, and draw angle. These complexities would have to be taken into account in a new methodology for dilution strategy control at the mines.
Acknowledgments
The authors would like to thank the colleagues who collaborated with the mine data for this paper, especially M. Fidel Baez (Codelco), M. Mauricio Melendez (El Teniente), M. Ernesto Arancibia (El Salvador). and M. Felipe Marinkovic (Andina). The assistance of the Laboratorio de Block Caving is also acknowledged. Finally, the authors would like to acknowledge the financial support of the Chilean Government through the project Conycit FB0809.
References
Brunton, I., Sharrock, G., and Lett, J. 2012. Full scale near field flow behaviour at the Ridgeway Deeps Block Cave Mine. Proceedings of MassMin 2012: 6th International Conference and Exhibition on Mass Mining, Sudbury, Canada, 10-14 June 2012. Canadian Institute of Mining, Metallurgy and Petroleum, Westmount, Quebec. [ Links ]
Castro, R. and Paredes, P. 2012. Comparison of REBOP to large panel caving at Codelco's Operations. Final Internal Technical Report. Mass Mining Technology Project II, Toronto, Canada, 5-7 June 2012. [ Links ]
Castro, R. and Armijo, F. 2012. Experimental design for the full scale flow test marker at El Teniente. Internal report to Codelco Chile. Laboratorio de Block Caving, January 2012. [ Links ]
Coulomb, C. 1776. Essaisurune application des regles des maximisetminimis a quelquesproblems de statiquerelatifs a la architecture. Mem. Acad. Roy. Div. Sav., vol. 7. (in French). [ Links ]
De Nicola, R. and Fishwick, M. 2000. An underground air blast - Codelco-Chile - Division Salvador. Proceedings of MassMin 2000, Brisbane, Australia. Australasian Institute of Mining and Metallurgy, Melbourne. pp. 173-178. [ Links ]
DeWolfe, V. 1981. Draw control in principle and practice at Henderson Mine. Design and Operation of Caving and Sublevel Stoping Mines. Stewart, D.R. (ed.). Society of Mining Engineers of AIME, New York. pp. 729-735. [ Links ]
Janssen, H. 2004. Experiments regarding grain pressure in silos written in1895. Proceedings of MassMin 2004, Santiago, Chile, 22-25 August 2004. Instituto de Ingenieros de Chile, Chile. pp. 293-300. [ Links ]
Julin, D. Block Caving. SME Mining Engineering Handbook. Vol. 2, ch. 20.3. Society for Mining, Metallurgy, and Exploration, Inc., Littleton, CO. 1992. pp. 1815-1821. [ Links ]
Laubscher, D. 2000. Block Cave Manual prepared for the International Caving Study. Julius Kruttschnitt Mineral Research Centre, University of Queensland. pp. 111-118. [ Links ]
Laubscher, D. 1994. Cave mining - the state of the art. Journal of the South African Institute of Mining and Metallurgy, vol. 94, no. 10. pp. 279-293. [ Links ]
Paredes, P. 2012. Dilution entry mechanisms in block and panel caving operations. Master's thesis, University of Chile (in Spanish). [ Links ]
Susaeta, A. 2004. Theory of gravity flow (Part 1). Proceedingsof MassMin 2004, Santiago, Chile, 22-25 August 2004. Instituto de Ingenieros de Chile, Chile. pp. 167-172. [ Links ]
Susaeta, A., Rubio, E., Pais, G., and Enriquez, J. 2008. Dilution behaviour at Codelco panel cave Mines. Proceedings of MassMin 2008, Luleå, Sweden. Lulea University of Technology. pp. 167-178. [ Links ]

