


Serviços Personalizados
Artigo
 Inglês (pdf)
 Artigo em XML
 Referências do artigo
Indicadores

Links relacionados
-
 Citado por Google
 -
 Similares em Google
Compartilhar

 Permalink
Journal of the Southern African Institute of Mining and Metallurgy
versão On-line ISSN 2411-9717
versão impressa ISSN 2225-6253
J. S. Afr. Inst. Min. Metall. vol.114 no.6 Johannesburg Jun. 2014
GENERAL PAPERS
Risk indexing tool for mine planning
W. AbdellahI; H.S. MitriI; D. ThibodeauII; L. Moreau-VerlaanII
IMcGill University, Montreal, Canada
IIVale Ltd, Sudbury, Canada
SYNOPSIS
The purpose of this paper is to establish a qualitative method to estimate the risk level (e.g. rating and ranking) resulting from mining activity. Risk is the product of two factors: probability of failure and cost of consequences. A resultant assessment scale matrix is then used to assign a risk index value which is directly proportional to the potential for excavation instability. A case study, the No. 1 Shear East orebody at Vale's Garson Mine in Sudbury, Ontario will be examined. A three-dimensional, elastoplastic, finite difference model (FLAC 3D) is presented for a mine development intersection situated 1.5 km below ground surface. The developed assessment scale matrix is used to estimate risk index for intersection (2981) located on 5000 level. The results are presented and categorized with respect to risk-index value, probability of instability, cost of consequence, and mining stage.
Keywords: risk-index tool, cost of consequence, probability of instability, numerical modelling, case study, underground mine developments.
Introduction
Stability is a key issue in underground mining. The stability and serviceability of mine developments (e.g. haulage drifts, crosscuts, and intersections) are crucial parameters influencing the success of ore extraction. Unexpected instability is expensive and is a risk to personnel and equipment. Failed or damaged mine developments will require extra expenditures for repair: slashing, rehabilitation costs, costs of adding secondary support, and delay of production. Clearly, delays caused by instability are costly and time-consuming and should be avoided (Ellefmo and Eidsvik, 2009).
Engineers have to achieve stability in their design while dealing with uncertain ground conditions. The complexity of the design process increases with the lack of accurate data. Furthermore, safety standards must meet all laws and regulations set by government agencies. Additionally, there are many parameters to be considered in the design process such as: safety, serviceability (e.g. quality of technical solution), economics (e.g. cost), environment, and rock mass properties. For example, rock mass properties alone, are complex and are associated with uncertainty in deep underground mines. These five factors should be maintained and combined together in the decision-making process. Consequently, wrong decisions may lead to unwanted risks. In order to facilitate decision-making, probabilistic analysis and risk assessment should be adopted (Einstein, 1996; Sturk, Olsson, and Johansson, 1996).
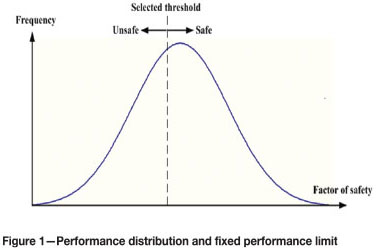
The best way to express performance uncertainty is to describe it in the form of a distribution (e.g. probability density function) related to a fixed limit (e.g. threshold of performance criteria) as shown in Figure 1.
This study presents a useful methodology for choosing secondary support requirements, both temporally and spatially. The methodology is based on estimation of risk level using risk-index as a mine design tool. This tool is adopted through stability evaluation of mine development intersections with respect to mining steps with delayed backfill.
Dealing with uncertainty
Uncertainty and variability govern the geomechanical data collected from the natural environment. Thus, a reliable design approach must include consideration of uncertainties, evaluation of the probability of occurrence of a risk, and measures to be adopted to reduce the risk to an acceptable level. Reducing the risk can involve the narrowing of the uncertainty range (e.g. by collection of additional data). Rock mass properties are significant geotechnical design input parameters. However, these parameters are never known precisely. There are always uncertainties associated with them. Some of these uncertainties are due to lack of knowledge or limited data availability, and some are intrinsic. Furthermore, some may arise from errors in testing (e.g. estimating strength of intact rocks, mapping the joint spacing, assessing the joint surface condition) and random data collection. Thus, a great deal of uncertainty is inherent in the design of underground excavations. Uncertainty can be dealt with in different ways; deterministic, parametric, and probabilistic analysis as shown in Figure 2.
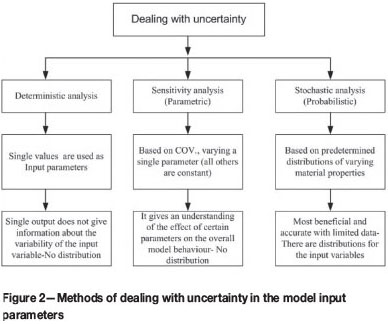
In a deterministic analysis, single values are used as model input parameters. Therefore, a resultant single output value does not give any information on the variability of the input parameter (e.g. no distribution). A parametric study (e.g. sensitivity analysis) can be performed by varying a single parameter according to a certain range (e.g. coefficient of variation) while keeping all other variables constant. This gives an understanding of the effect of certain parameters on the overall model behaviour. However, no distribution is obtained using this method. If data is limited, probabilistic methods or statistical simulations are more powerful. These methods quantify the uncertainty and estimate the likelihood (probability) of occurrence. Therefore, engineers can develop more reliable, robust designs and economical solutions (Hammah, Yacoub, and Curran, 2008).
In this paper, the modified point-estimate method (Zhou and Nowak, 1988) of (2n2+1) is used to estimate the probability of unsatisfactory performance for intersection no. 2981 on 5000 level at Vale's Garson Mine in Sudbury, Ontario. Also, the cost of potential consequences from this intersection is calculated. Finally, risk-indices are estimated.
Case study
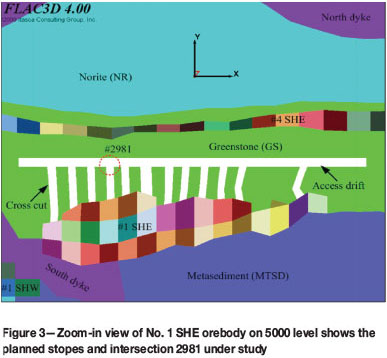
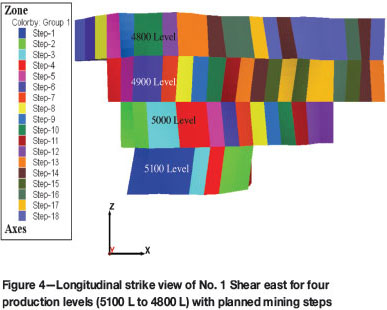
Vale's Garson Mine is located in the greater Sudbury area of Ontario, Canada. The mine has been in operation for more than 100 years and has produced 57.2 Mt containing an average grade of 1.33% copper and 1.62% nickel (Vale, 2009). The current production is 2400 t/d. Both transverse and longitudinal stope mining methods are employed with delayed backfill in an upward direction. The typical planned stope dimensions are 30x15x12 m (height x length x width: 100 x 50 x 40 ft.). The stopes are extracted in two or three blasts and then tight filled with a mixture of pastefill and waste rock. In the area of the current investigation, two orebodies are found - namely, No. 1 Shear (east and west) and No. 4 Shear (east and west), which have a strike length of approximately 610 m (2000 feet) each, and a dip of 70° to the south. These orebodies, however, vary in size and shape. An olivine diabase dyke crosses the two orebodies near mid-strike on the 5100 level. The dyke is steeply dipping to the south-west and continues with depth. The footwall typically consists of norite (NR) and greenstone (GS) and the hangingwall consists of metasediments (MTSD) as shown in Figure 3. The stability analysis is conducted, using Itasca's FLAC3D (ITASCA, 2009) for the No. 1 Shear East orebody, whereby a planned sequence of 108 stopes over four production levels (5100, 5000, 4900, and 4800) is simulated in the form of 18 mine-and-fill numerical model steps (i.e. each step represents six stopes); see longitudinal strike view in Figure 4. While doing so, the strength-to-stress ratio is monitored on level 5000 at the intersection of 3150 haulage drift with the crosscut at the 2981 location.
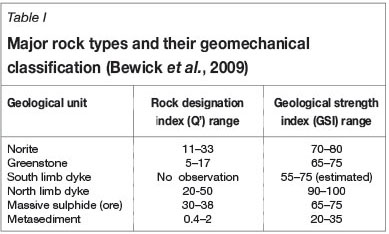
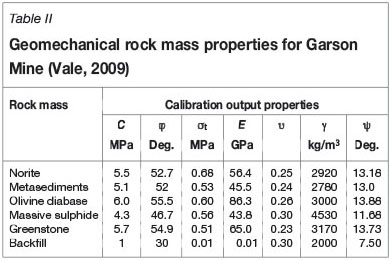
The rock mass qualities of the main units are summarized in Table I (Bewick et al., 2009). The physical and geomechanical properties of rock mass used in numerical modelling for each geological unit are presented in Table II (Vale, 2009).
Model calibration
The model is calibrated through deep analysis using data from the measured in situ stresses in the mine (McKinnon, 2001). A series of in situ stress measurements were done at Garson Mine in 2005 by MIRARCO in the 2670 crosscut off by the 4900 level ramp (MIRARCO and Golder Associates, 2008). Five of the six tests in the norite were successful, but tests in the dyke could not be successfully completed (McKinnon, 2001; MIRARCO and Golder Associates, 2008; Maloney and Cai, 2006). It is assumed that the major and intermediate principal stress components act in the horizontal plane while the minor principal stress component is vertical (Perman, 2011). The in situ stress measurements were taken on 4900 level and are presented in Table III.
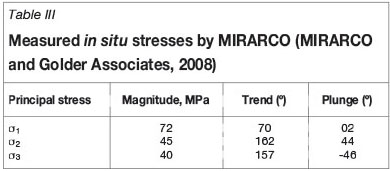
Table III shows the values of o2 and σ3 are close in magnitude, thus limiting the accuracy of the orientations. Therefore, it will be assumed that the minimum principal stress is oriented vertically and equal in magnitude to the weight of the overburden. The resulting stress values used in the calibration model are as follows (MIRARCO and Golder Associates, 2008; Perman, 2011):
> Minimum principal stress (o3) = 0.027 MPa/m oriented vertically
> Maximum principal stress (o1) = 1.8 * ov oriented flat on an azimuth of 70°
> Intermediate principal stress (o2) = 1.1 * ov oriented flat on an azimuth of 340°.
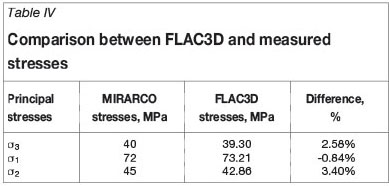
It should be noted that the value of 0.027 MPa/m represents the average weight of overburden of the different rock masses. This value is determined by MIRARCO to estimate the in situ stresses on 4900 level. Table II, on the other hand, reports the unit weight of each geological unit in the vicinity of the case study. The values of applied boundaries pre-mining stresses are determined by trial and error using the boundary traction method (Shnorhokian, Mitri, and Thibodeau, 2013). In this method, only the bottom of the model is fixed in the -Z direction. The upper boundary of the model (ground surface) is simulated as free surface where the overburden stress (gravitational stress) is applied. Major horizontal stress is applied on the right-hand side and left-hand side of the model in the +X and -X directions. In addition, a minimum horizontal stress is applied on the front and back of the model in the direction of +Y and -Y (Shnorhokian, Mitri, and Thibodeau, 2013). This technique is adopted in order to obtain the same measured initial stresses undertaken by MIRARCO on 4900 level. Pre-mining (initial) stresses are those stresses that would exist prior to any excavations being made on the model boundaries. The calculated in situ stresses from the above relations are then compared with those computed by FLAC3D, as listed in Table IV, on the same location where measurements were undertaken by MIRARCO. From Table IV, the maximum difference between the measured and modelled in situ stresses is acceptable (e.g. 3.4%). It is clear that the numerical modelling results satisfy the measured in situ stresses.
Risk analysis procedures
Risk analysis is an integrated part of decision-making. Risk can be defined as the expected consequence, as opposed to expected loss of utility, or the product of probability of unsatisfactory performance and the cost of consequence, as given in Equation [1]:

where
Pf is the probability of unsatisfactory performance
CC is the cost of consequence.
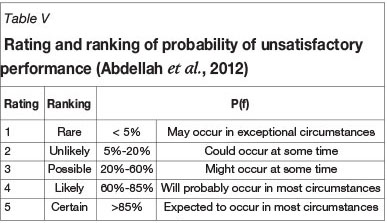
According to the above definition of risk, the probabilistic analysis is carried out and discussed in detail in the next section. The estimated probability of unsatisfactory performance is then rated and categorized according to Table V (Abdellah et al., 2012).
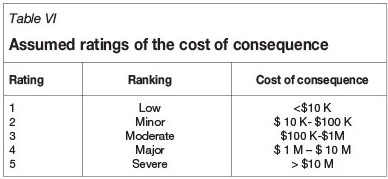
The cost of consequence, CC, is calculated in dollars and is based on the hypothesis that the intersection has collapsed or has become unusable regardless of the probability of unsatisfactory performance at that intersection. To calculate the CC, three scenarios for re-opening the intersection are studied and the one with the lowest cost is retained as the 'cost of consequence CC'. In the current study, scenarios such as loss of life and loss/damage of equipment at the intersection were precluded. The three scenarios are discussed in detail later. The ratings and rankings of the cost of consequence are defined in Table VI.
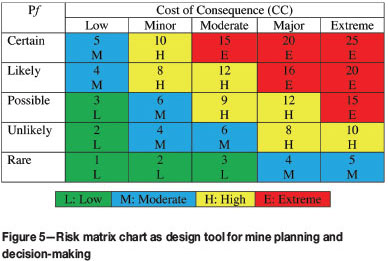
Then the risk is calculated as defined in Equation [1]. The resulting risk is called 'Risk-index'. It has a rating from 1 to 25 and helps to decide temporally (when) and spatially (where) secondary support is required. The risk matrix is shown in Figure 5.
Probabilistic analysis
Probabilistic methods provide a rational and efficient means of characterizing the inherent uncertainty that is prevalent in geotechnical engineering. There is high uncertainty in mine design based on such parameters because of the inherent uncertainty associated with parameters such as in situ stress fields, rock mass properties, and geological features around the openings. Due to the high level of uncertainty, there is a need to develop stochastic analysis techniques capable of defining the statistical variation of model input parameters and to enable better understanding of the risk associated with choosing the design parameters based on uncertain input data. Hence, predicting the probability of unsatisfactory performance using probabilistic analysis approaches together with the developed numerical modelling (deterministic techniques) becomes necessary. While the stability of haulage drifts may depend on a wide range of factors, including shape and size (due, for example, to drilling inaccuracy and blasting quality), mining depth, in situ stress regime, orebody dip, and the standoff distance to the orebody among others, the focus of the probability analysis in this study is on the inherent variability of the footwall rock strength parameters.
Modified point-estimate method (PEM)
The point-estimate approach was first developed by Rosenblueth in 1975 and subsequently modified by Zhou and Nowak in 1988. It proposes predetermined points in the standard normal space to compute the statistical parameters of a function with multiple random variables X, by the 2n2+1 formula where n represents the number of random variables (Zhou and Nowak, 1988; Peschl and Schweiger, 2002). In our investigation, three random variables are used, namely the cohesion, friction angle, and modulus of elasticity of the footwall rock mass. Therefore the required number of simulations is 2(3)2+1 = 19, regardless of the mining sequence. The PEM requires the mean and variance to define the input variables. The term 'failure' has a very general meaning here as it may indicate collapse of a structure or in a general form define the loss of serviceability or unsatisfactory performance associated with the performance function. To minimize simulation time (a single run takes 30 hours), the modified PEM of 2n2+1 is adopted in this analysis.
Failure evaluation criteria (performance criteria)
In order to assess the stability of the intersection, a performance criterion must first be selected. This may be one of a large number of conditions such as maximum permissible floor heave ratio (e.g. the ratio of the floor heave to the span of the drift) or roof sag ratio (e.g. the ratio of the roof/back sag to the span of the drift), or allowable stress concentration factor (normally associated with linear elastic analyses), or a yielding condition such as Mohr-Coulomb or Hoek-Brown (Abdellah et al., 2012; Zhang and Mitri, 2008). The choice of a performance criterion is dependent on the application and field observations. In the current study, very little deformation is observed at the intersection in response to mining activities, as shown by the extensometer installed at the intersection, thus making it difficult to set a threshold. Details of the field monitoring programme and instrumentation results are beyond the scope of this paper. Therefore, a yield-based criterion has been selected in which Mohr-Coulomb is used as the failure condition. Adopting a safety factor of 1.4, it was decided that the stability performance of the intersection is considered satisfactory when the Mohr-Coulomb strength-to-stress ratio is equal to or greater than 1.4. Strength-to-stress ratio is a built-in function in FLAC3D. It should be noted that the numerical analysis carried out is elastic-perfectly plastic. Thus, as a yielding-based function is adopted (e.g. strength-to-stress ratio), yielding theoretically occurs at a ratio < 1.
Due to the large size of the three-dimensional model and in order to optimize the computer storage requirements, only the area around the drift has been discretized with a fine mesh based on a mesh sensitivity analysis. Mesh size defines the number of zones in the grid. The dense mesh offers the advantage of accommodating high stress gradients around the underground mine openings and adequate progression of plasticity (Zhang and Mitri, 2008). According to ITASCA (ITASCA, 2009), sizing the grid for accurate results, but with a reasonable number of zones, can be complicated. Three factors should be taken into account when sizing the mesh: (1) a finer mesh (dense) leads to more accurate results as it provides a better representation of high-stress gradients, (2) the accuracy increases as the zone aspect ratio tends to unity, and (3) if different zone sizes are required, then the more gradual the change from the smallest to the largest, the better the results. The mine-wide model created for Garson Mine has about 965 250 zones.
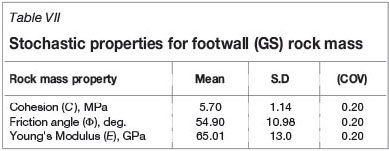
Based on the parametric study (sensitivity analyses) that has been conducted, the most influential model input parameters are Young's modulus (E), cohesion (C), angle of internal friction (φ), and horizontal-to-vertical stress ratio (K). K is not considered in our probabilistic analysis as the in situ stresses were measured in the mine. In this study, only Young's Modulus (E), cohesion (C), and friction angle (φ) are considered, with the Mohr-Coulomb strength-to-stress ratio as shown in Table VII. The modified point-estimate method (Zhou and Nowak, 1988) of (2n2+1) is adopted in this analysis (e.g. 19 runs for the three input variables). The coefficient of variation (COV) is taken as ± 20%.
Stochastic results for No. 2981 intersection (5000 level)
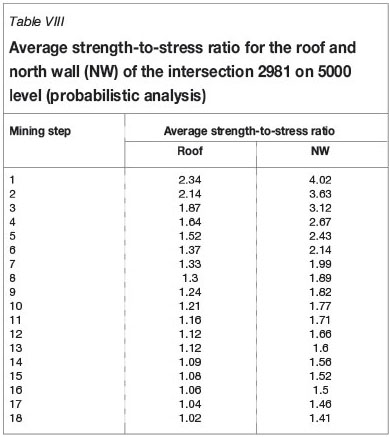
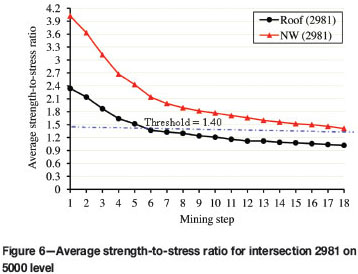
The average strength-to-stress ratio for intersection No. 2981 on 5000 level is given in Table VIII. These values are plotted against mining steps in Figure 6. Figure 6 shows that the strength-to-stress ratio decreases as mining progresses. The strength-to-stress ratio for the roof does not exceed the threshold (e.g. threshold =1.4) up to mining step 5. After that, it deteriorates as mining progresses. Thus, secondary support is recommended at early mining stages. On the other hand, the north wall (NW) does not go beyond the threshold as mining proceeds; it closes to the threshold value only at the final stage.
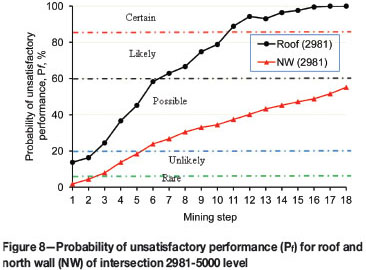
The probability density function (PDF) is shown in Figure 7. It can be seen that the increase in the area under the curve (e.g. on the left of the threshold line) represents unsatisfactory performance (instability) as mining advances. This indicates increasing probability of instability. The probability of unsatisfactory performance is shown in Figure 8. It can be seen from Figure 8 that the roof of intersection 2981 on level 5000 may require secondary support after mining step 11 since the probability of instability is certain (Pf > 85%). However, the north wall (NW) looks stable and its probability of instability lies between rare and possible (highest probability of instability Pf < 60%).
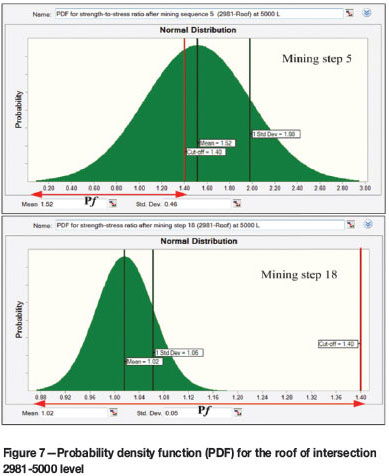
According to Figure 6 and Table VIII, the probability evaluation indicates a requirement for enhanced support after mining step 6 in the roof. However, the north wall (NW) is stable and does not require any secondary support throughout the whole mining sequence. The PDF for the roof at the intersection 2981 after mining step 5 and step 18 is shown in Figure 7.
It can be seen from Figure 7 that the probability of occurrence having a value below the threshold (e.g. < 1.4) increases as mining progresses. The probability of unsatisfactory performance (Pf) is shown in Figure 8. It can be seen that the probability of instability for the unsupported roof of intersection 2981 is certain (Pf >85%) after mining step 11. Due to the likelihood of failure, enhanced support is recommended on the roof. For the north wall (NW), the probability of unsatisfactory performance is rare to possible. The cost of consequences associated with intersection instability should be estimated, and is discussed in the next section.
Cost of consequences
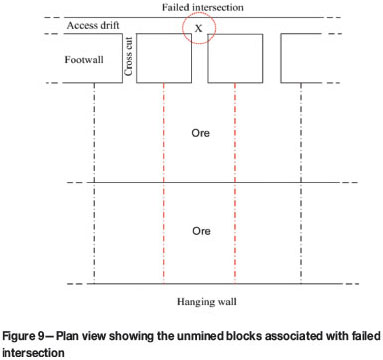
The objective of this section is to estimate the cost of consequence that results from failure or blockage of the mine development intersections. If the mine development intersection fails or becomes blocked, then action is necessary to regain access to the stopes. The following three scenarios have been used to choose the most economical technical solution.
1. Mining blocks associated with the failed intersections will be left, as shown in Figure 9
2. The failed intersection will be rehabilitated using secondary support or shotcrete
3. A new bypass will be developed to mine out the stopes associated with failed intersection, as shown in Figure 10.
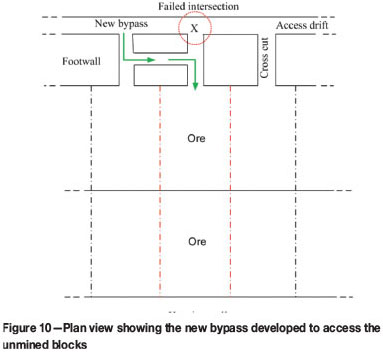
The third option (developing a new bypass) is found to be the most economical solution; therefore it will be presented in details in the following section.
Methodology
The following key parameters are taken into consideration when the cost of developing a new bypass is calculated. All the cost values are hypothetical and do not represent actual Garson Mine numbers.
1. Length of developed bypass
2. Cost of development ($1000 per ft.)
3. Mineral value of unmined blocks due to intersection failure (the mineral value is $200 per ton, the operating cost is $90 per ton)
4. Time value due to delay of production (developing time/bypass = 2 months)
5. Operating cost (three men plus truck haulage = $900 per shift)
6. Interest rate = 10% per annum
7. Shift length = 12 hours (actual shift length =10 hours)
8. Advance rate = 20 ft. per day
9. Average ore density = 4.53 t/m3.
First, the cost of consequence of unmined stopes (CC1) due to intersection failure or blockage is calculated as follows:

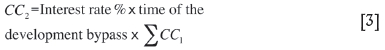
Then the (lost interest) time value (CC2) due to delay of production can be calculated as:
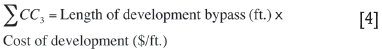
Also, the development cost for the new bypass is calculated from:
Finally the total cost of developing the bypass is given as:

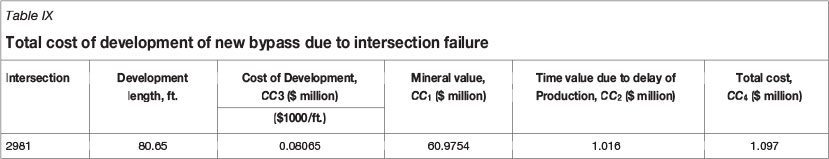
Therefore, the cost of new bypass development is the sum of lost interest value of money (only unmined stopes related to failed intersection) due to the delay of production to develop the new bypass and the cost of the development itself (length of the bypass). The cost of development of the new bypass for the studied intersection (no. 2981) is given in Table IX.
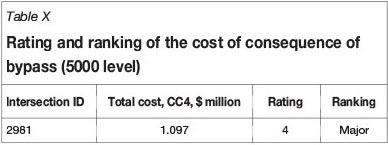
Table IX shows the total cost of developing the new bypass is about $1.097 million. The rating and ranking for the cost of consequence to the intersection under study are given in Table X, according to the assumed ratings and rankings of the cost of consequence given in Table VI.
Risk-index estimation
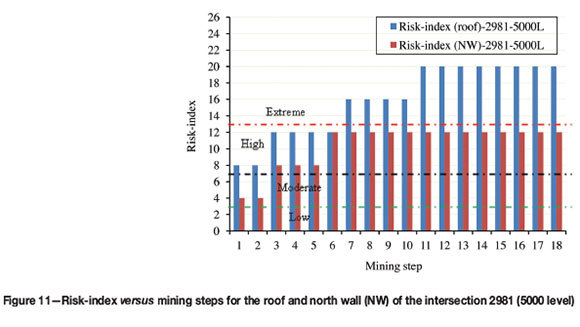
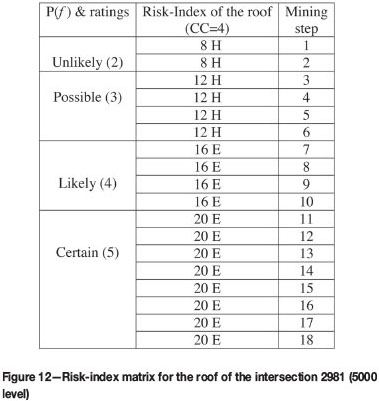
The risk-index calculation is given in Table XI. It can be seen that the risk-index on the roof of the intersection 2981 on 5000 level is high to extreme. Thus, secondary support is highly recommended, especially prior to mining step 7. For the north wall (NW) of the intersection, the risk is moderate to high. Therefore, secondary support may be recommended especially at later mining steps. The risk-index with respect to mining steps is shown in Figure 11. The risk matrices for the roof and north wall (NW) of intersection 2981 on 5000 level are shown in Figures 12 and 13 respectively.

Conclusion
This paper presents a simple methodology to estimate the risk-index of an intersection. A geotechnical risk assessment scheme is used for deciding when and where secondary support is required with respect to planned mining sequences. This index is the product of probability of unsatisfactory performance and the cost of consequence due to failure of the intersection. A case study is presented where risk-index is estimated for intersection 2981 on 5000 level with respect to the mining activity. The results show that intersection 2981 is a crucial intersection for 5000 level (e.g. the risk-index is extreme in the roof after mining step 7 and high in the north wall after mining step 3). The model is calibrated with the in situ stress measurements that were undertaken by MIRARCO, and validated with results from deformation monitoring extensometers (MPBX) installed in the study area. The Mohr-Coulomb elastoplastic strength-to-stress ratio is adopted as a failure evaluation criterion. The threshold value of this criterion for temporary openings (e.g. mine developments) is taken as 1.4. Thus the performance of the mine development intersection is considered unsatisfactory when the strength-to-stress ratio falls below 1.40. The probabilistic analysis, in combination with numerical modelling, is necessary to account for the inherent uncertainty associated with the rock mass properties. The cost of consequence scenarios provide comparative information for evaluating alternative solutions if the intersection fails.
Recommendation for future work
The stochastic analysis techniques developed can be used in the future for other mining applications such as pillar stability (diminishing ore pillar) or the probability of rockburst or fault slip occurrence. The risk methodology can also be used for future feasibility studies to determine the ideal location of the haulage drifts with respect to mining methods and sequence.
Nomenclature
C: Cohesion of the rock mass
γ: Unit weight of the rock mass
υ: Poisson's ratio
E: Young Modulus of rock mass
Φ: Friction angle of rock mass
Ψ : Dilation angle of rock mass
 t: Tensile strength of rock mass
COV: Coefficient of variation (COV =  )
)
σ: Standard deviation (SD)
µ: Mean value of rock mass
n: Number of variables
Pf: Probability of unsatisfactory performance
PDF: Probability density function
Acknowledgment
This work was financially supported by a research grant from the Natural Sciences and Engineering Research Council of Canada in partnership with Vale ltda. The authors are grateful for their support.
References
Abdellah, W., Mitri, H.S., Thibodeau, D., and Moreau-Verlaan, L. 2012. Stochastic evaluation of haulage drift unsatisfactory performance using random Monte-Carlo simulation. International Journal of Mining and Mineral Engineering, vol. 4, no. 1. pp. 63-87. [ Links ]
Bewick, R.P., Valley, B., Runnalls, S., Whitney, J., and Krynicki, Y. 2009. Global approach to managing deep mining hazards. ROCKENG09: Proceedings of the 3rd CANUS Rock Mechanics Symposium, Toronto, 9-14 May 2009. Diederichs, M.S. and Grasselli, G. (eds. [ Links ]).
Einstein, H.H. 1996. Risk and risk analysis in rock engineering. Tunnelling and Underground Space Technology, vol. 11, no. 2. pp. 141-55. [ Links ]
Ellefmo, S.L. and Eidsvik, Jo. 2009. Local and spatial joint frequency uncertainty and its application to rock mass characterisation. Rock Mechanics and Rock Engineering, vol. 42. pp. 667-88. [ Links ]
Hammah, R.E., Yacoub, T.E., and Curran, J.H. 2008. Probabilistic slope analysis with the finite element method. 43rd US Rock Mechanics Symposium and 4th US-Canada Rock Mechanics Symposium, Asheville, NC, 28 June-1 July 2009. [ Links ]
ITASCA. 2009. Fast Lagrangian analysis of continua in 3 dimensions (Flac3d), User's Manual Ver. 4.0. 4th edn. Itasca Consulting Group Inc., Minneapolis, Minnesota. [ Links ]
Maloney, S. and Cai, M. 2006. In situ stress determination, Garson Mine. Project Report: 06-015. GeomechanicsResearch Center, MIRARCO, Sudbury, Ontario. [ Links ]
McKinnon, S.D. 2001. Analysis of stress measurements using a numerical model methodology. International Journal of Rock Mechanics and Mining Sciences, vol. 38. pp 699-709. [ Links ]
MIRARCO and Golder Associates. 2008. Garson Mine geomechanical study. Draft report submitted to Vale Inco Limited, Garson Mine. [ Links ]
Perman, F., Sjöberg, J., and Dahnér, C. 2011. Detailed three-dimensional stress analysis of complex orebody geometry - model setup and results for the Malmberget Mine. Continuum and Distinct Element Numerical Modeling in Geo-Engineering, Melbourne, Australia, 14-16 February 2011. Itasca International Inc., Minneapolis. Paper 02-04. [ Links ]
Peschl, G.M. and Schweiger, H.F. 2003. Reliability analysis in geotechnics with finite elements- comparison of probabilistic, stochastic and fuzzy set methods. ISIPTA '03. 3rd International Symposium on Imprecise Probabilities and Their Applications, University of Lugano, Lugano, Switzerland, 14-17 July 2003. vol. 3. pp. 437-451. [ Links ]
Shnorhokian, S., Mitri, H.S., and Thibodeau, D. 2013. Numerical simulation of pre-mining stress field in a heterogeneous rockmass. International Journal of Rock Mechanics and Mining Sciences. In press. [ Links ]
Sturk, R., Olsson, L., and Johansson, J. 1996. Risk and decision analysis for large undeground projects as applied to the Stockholm Ring Road tunnels. Tunnelling and Underground Space Technology, vol. 11, no. 2. pp. 157-64. [ Links ]
Vale Inco Limited. 2009. Garson Deep Pre-Feasibility Study/Fel 2. Geotechnical Report. [ Links ]
Zhang, Y. and Mitri, H.S. 2008. Elastoplastic stability analysis of mine haulage drift in the vicinity of mined stopes. International Journal of Rock Mechanics and Mining Sciences, vol. 45, no. 4. pp. 574-593. [ Links ]
Zhou, J. and Nowak, A.S. 1988. Integration formulas to evaluate functions of random variables. Structural Safety, vol. 5, no. 4. pp. 267-284. [ Links ]

