


Servicios Personalizados
Articulo
 Inglés (pdf)
 Articulo en XML
 Referencias del artículo
Indicadores

Links relacionados
-
 Citado por Google
 -
 Similares en Google
Compartir

 Permalink
Journal of the Southern African Institute of Mining and Metallurgy
versión On-line ISSN 2411-9717
versión impresa ISSN 2225-6253
J. S. Afr. Inst. Min. Metall. vol.114 no.6 Johannesburg jun. 2014
GENERAL PAPERS
A computational fluid dynamics model for investigating air flow patterns in underground coal mine sections
D.D. Ndenguma; J. Dirker; N.D.L. Burger
Department of Mechenical and Aeronautical Engineering, University of Pretoria, Pretoria, South Africa
SYNOPSIS
This investigation compares the results from an experimental and numerical study of air flow in a scaled-down underground coal mine model. This was done in order to determine if numerical analysis can be relied upon when searching for ventilation solutions to control high concentration of coal dust and methane gas in underground coal mines. Steady state analyses were used to identify flow patterns and recirculation regions within the mining section while transient state analyses were used to determine the time taken to extract the initial air from the model. The agreement between the experimental and numerical results indicates that numerical modelling is useful in this regard. The study went further to devise a method of determining the optimum position of the jet fan that is responsible for mine-gas dilution at different stages of mining.
Keywords: numerical modelling, computation fluid dynamics, CFD, mine ventilation.
Introduction
Coal is the most widely used primary fuel, accounting for about 36% of the total fuel consumption of the world's electricity production. According to Thopil and Pouris (2010), 68% of South Africa's primary energy needs are provided by coal. Coal can be extracted either by opencast or underground operations. Approximately 50% of South Africa's coal production is by underground mining.
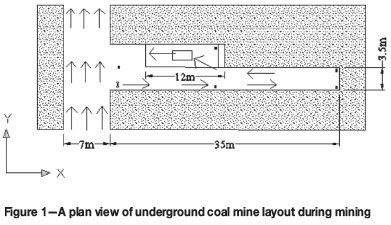
In underground coal mines different extraction methods are used depending upon the geological formations and other factors. The two major extraction methods are the bord-and-pillar and the longwall. Bord-and-pillar mining is the most common type of underground coal mining globally (Peng and Chiang, 1984). Cutting operations are performed using a continuous miner (CM) that makes extended cuts, known as box cuts, into the mining face. To complete a cutting operation the CM makes four cuts. In some South African coal mines these cuts may each be 17.5 m long and 3.5 m wide. Figure 1 shows a plan view of an underground bord-and-pillar layout. The final depth of the in-heading might be up to 35 m, the width up to 7 m, and the height depends on the thickness of the coal seam.
The extraction of coal, especially by underground mining, is associated with a number of hazards. Airborne dust and methane gas are a risk to the miners and mining equipment. High concentrations of respirable coal dust are known to be a cause of lung disease (Chander et al., 1990; Cheng and Zukovich, 1973), and should be avoided.
Methane gas and coal dust can cause explosions that result in injuries and fatalities. In South Africa, since the first coal mine explosion at Elandslaagte colliery in 1891, a further 333 explosions resulted in 1 034 deaths by the end of 1990 (Flint, 1990). According to Nundlall (1996) 78 flammable gas explosions, some of which were in coal mines, occurred in South Africa between 1988 and 2005. Liu et al. (2010) conducted an analysis of coal mine accidents in China from 2005 to 2009. More than 3000 gas accidents were reported in this period. Several attempts have been made, with success, to improve coal mine safety. Esterhuizen and Gürtunca (2006) outlined the positive impact that research can have on reducing coal mining accidents. They reported improvements with regards to the reduction of respiratory diseases, noise-induced hearing loss, musculoskeletal disorders, traumatic injuries, mine disasters (including reducing and monitoring the risk of flammable atmosphere ignition), and fatalities and injuries due to ground failure. It was shown that a significant reduction in coal mining fatalities has been achieved by implementing a wide range of strategies and solutions.
Since coal dust and methane gas cause coal mine accidents, their concentrations must be kept low. The Department of Mineral Resources (DMR) in South Africa issued a directive that the dust and methane concentration in underground coal mines should not exceed 2.0 mg/m3 and 0.5% by volume, respectively. Ventilation is a popular technique that is used to control dust and methane gas in underground coal mines to allowable concentrations. A jet fan is frequently employed as a source of air flow to ventilate the in-heading. A higher air speed may, however, increase airborne coal dust concentrations and increased ventilation rates should therefore be employed with care. A scrubber that is mounted on the CM also plays a big role in reducing dust and methane gas, since if operating properly it will remove particles from the air stream flowing over the machine.
Due to tight production schedules and harsh environmental conditions, it is difficult and costly to carry out experiments in operational coal mines. Therefore, this investigation was done using a comparatively inexpensive, and safer, computational fluid dynamics (CFD) modelling technique. This approach is aimed at aiding the search for solutions to problems associated with airborne dust and high methane gas concentrations in underground coal mines. CFD techniques have been used in the past for mining ventilation studies, but experimental validation is needed (Wala et al., 2007). In this investigation a scaled-down model of an underground coal mine was used to validate the CFD model, which allows predictions using the CFD model to be extended to full-scale applications.
Steady-state and transient-state investigations were done numerically and experimentally for a scaled-down underground coal mine model. The experimental results were used to validate the numerical analysis. Further numerical analysis was carried out in order to develop a method for determining the optimum position range of the jet fan at different lengths of in-heading.
Test facility
Steady-state and transient-state experiments were conducted using a 15% scale underground coal mine model, shown in Figure 2. The intention in using a scale model was not to represent a full-scale mine, but rather to validate the CFD model. This technique can later be used to simulate a full-scale mine.
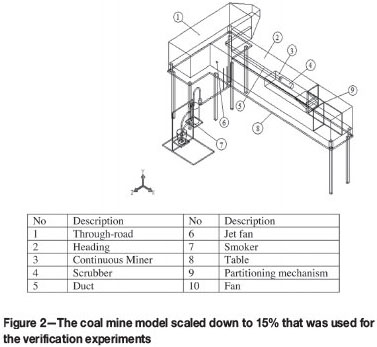
All the walls of the model were made from hardboard except for the top and one side of the in-heading, which were constructed from clear Perspex to enable observation. Smoke was used to visualize air motion during steady-state tests and to represent methane gas concentration during transient tests. The inside surface of the walls and floor were black to improve smoke visibility. Important dimensions of the model in-heading were as follows: 2 333 mm deep, 420 mm wide, and 333 mm high. These were representative of an actual mine section, which in some cases may have a depth of 35 m, width of 7 m, and a height of 5 m (see also Figure 1).
Air flow rates were scaled using a percentage volume flow method to resemble conditions in full-scale mining sections during mining. In this method, the number of air changes per hour for the scaled model was the same as for the general full-scale application. Other suitable non-dimensional parameters that would have led to a reasonable representation of the full-scale application could not be identified. Air flow in the through-road was induced by a fan at the tapered outlet of the through-road. This air velocity was set at 0.0665 m/s at the centre of the through-road, representing 2 m/s in an actual mine. The jet fan was represented by means of a nozzle connected to a compressed air system. The nozzle was designed to achieve a jet-stream penetration of 1.733 m (equivalent to the 26 m obtained with actual mining equipment in a full-scale simulation, as measured experimentally at the Kloppersbos testing facility in South Africa) into the in-heading with a velocity of 10 m/s at the nozzle exit. The nozzle had a 10 mm exit diameter. The air flow was regulated with a pressure control valve while the air velocity was measured by an anemometer. The flow rate of the scrubber on the continuous miner was implemented in the scaled model by means of a speed-controlled fan. This represented a common operational configuration where the filtered air is rejected directly backwards, and not towards the sidewall of the in-heading. Conditions both with and without the scrubber in operation were considered.
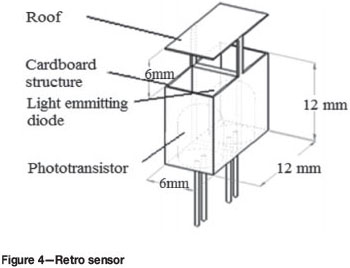
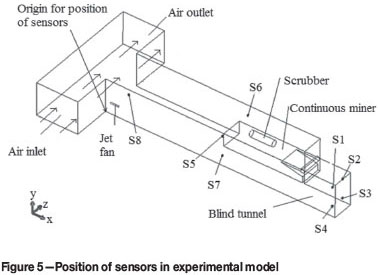
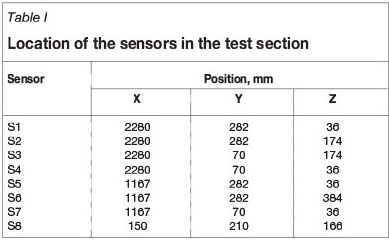
Transient-state tests required measurement of the smoke concentration. A measuring system consisting of photoelectric sensors, a data acquisition unit, and a computer, shown schematically in Figure 3, was used. Photoelectric sensors, (shown schematically in Figure 4) were constructed to detect the intensity of light reflected from smoke particles. A higher light intensity related to a higher smoke concentration. For each sensor, a light-emitting diode (LED) was used as light source in one compartment while a phototransistor was located in the other compartment. As light was reflected from smoke particles, a signal was produced proportional to the smoke concentration. The sensor structure, which was black in colour, was 12 mm wide, 6 mm deep, and 18 mm high. Eight such sensors were placed at different locations in the scale model as shown in Figure 5. Table I indicates the actual positions of the sensors with respect to the origin point (as defined in Figure 5).
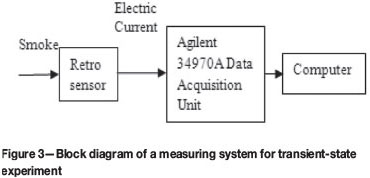
The signal sent by the phototransistors in form of an electrical current (I) was converted to electrical resistance (R) by the data acquisition unit.
Before use, all sensors were calibrated and standardized according to light intensity under controlled conditions. In this process, the read-out deviations for each sensor, compared to the averaged read-out from all sensors combined, were recorded. These deviations were used to derive corrective adjustment functions that were employed later during the experimental data-processing phase.
Numerical computation
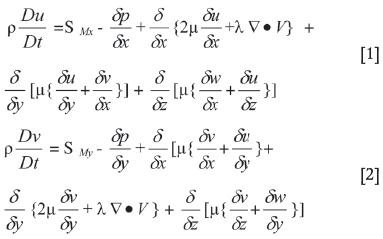
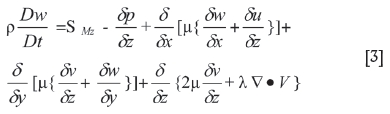
Star CCM+ version 3.02.006 was used to solve the following Navier-Stokes governing equations within the model for numerical analysis.
Three geometries representing three different mining progressions were examined in the steady-state investigation, while for the transient-state investigation, only one mining progression was used. The mining progression shown in Figure 1 (scaled down) is reported on for both the steady-state and transient-state analyses.
The geometry, consisting of the in-heading, a portion of the through-road, a jet fan, a scrubber, and a continuous miner, was defined using CAD software. Provision was made to define numerical sensors at the same locations as the photoelectric sensors in the real laboratory-scale model.
The geometry was imported into Star CCM+ for meshing and boundary conditions definition. An automated polyhedral-type meshing scheme was used. After a mesh-independence study had been conducted, a suitable mesh size was selected. Appropriate inlet and outlet conditions were defined to simulate flow at the jet fan inlet and outlet, scrubber inlet and outlet, and the through-road inlet and outlet. Pressure outlet type was used for the outlets. The air velocity of the jet fan was set at 10 m/s, the scrubber air outlet velocity at 2.3 m/s, and through-road inlet velocity at 0.0665 m/s. These velocities were scaled down from 46 m/s, 35 m/s, and 2 m/s for actual mining conditions, respectively. Standard air properties were used at a temperature of 293K. For transient-state numerical investigation, where smoke concentration had to be modelled, fresh air from the jet fan and smoke were represented by a molecular weight of 29 kg/kmol and 800 kg/kmol respectively. The properties of the smoke phase in the numerical model were chosen to match the real properties as closely as possible.
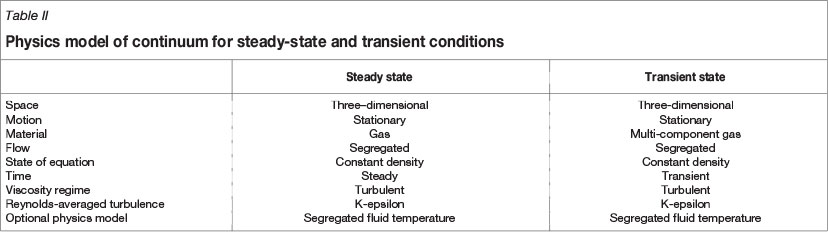
Table II summarizes the CFD modelling settings used to define the physical phenomenon of steady- and transient-state analyses.
Steady-state tests
In the steady-state investigation the aim was to identify air flow patterns in the in-heading. Three different mine geometries representing different mining progressions were studied, but only one geometry is presented here. For all tests the jet fan in the scale model was located 80 mm into the in-heading, 67 mm from the sidewall, and 47 mm above the floor. Smoke was released from a smoke-producing device into the in-heading through plastic tubes 5 mm in diameter. These were inserted through the floor of the model at number of grid points as shown in Figure 6. The tube ends were also set at three different heights in order to observe as many points as possible.
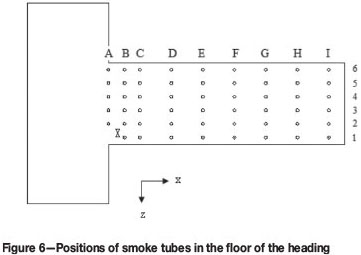
Smoke was produced by burning a glycol/water mixture in a well-ventilated laboratory. The mixture was pumped from the tank into a container where it was sprayed onto a heater element to produce smoke. The smoke was introduced into the test section through the tube network.
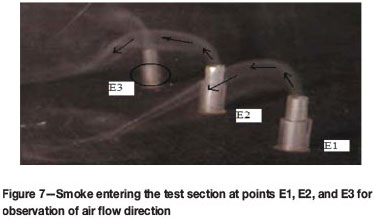
Video clips of the flow patterns of air in the test section were recorded for analysis. Figure 7 shows a still image of smoke entering the test section. The video clips were recorded from the top and the side of test section.
The experimental procedure was as follows.
1. The valve on the compressed air system was opened to induce the correct volumetric flow rate and velocity at the nozzle representing the jet fan
2. The smoke tubes were inserted into three consecutive holes along the width of the in-heading and set at same level or height at a single time. The heights that were used were 47 mm, 165 mm, and 250 mm, measured from floor level. All other holes on the floor were sealed off to avoid air leakages
3. A digital camera was set to capture data in form of video clips
4. The smoke-producing device, the through-road fan, and observation light were all switched on and the laboratory lights were switched off
5. Once sufficient smoke flow was established, image capturing was initiated
6. After capturing data at one position, the three tubes were set again at a different level or the next set of holes. Steps 3 to 5 were repeated until all the designated points in the test section had been investigated.
Comparison of steady-state experimental and numerical results
The smoke direction observed from video clips was converted into vector format. In Figures 8A and 8B arrows are used to indicate the smoke direction obtained in this fashion. The arrows indicate direction only, and not velocity. Experimental results on arbitrary planes are shown here for graphical representation purposes only. Also shown are the numerical steady-state results from the top and the side view. Although the scrubber was involved in both methods, the air flow pattern of the scrubber is not included in the steady-state results for graphical representation purposes.

As can be seen, the air flow patterns for the experiment and simulation were similar. The air flow in both cases is recirculating. This is not desirable for the purpose of diluting methane gas. The results for the other two geometries showed similar results. From this it was concluded that the numerical and experimental results are in agreement. Based on full-scale experimental measurements at the Kloppersbos facility, similar recirculation patterns and penetration depths would be present with actual mining conditions and equipment. It could be argued that the flow pattern distribution is non-dimensional in nature.
Transient-state tests
Only a single mine geometry was used in the transient-state analysis, compared with three geometries in the steady-state analysis. Eight photoelectric sensors, as described earlier, were used to monitor smoke concentration levels at different locations in the in-heading.
The following sequence of activities was carried out to complete the transient-state experiment.
1. Phototransistors were connected to the data card
2. The smoke-producing device was placed inside the test section
3. All inlets and outlets of the test section were sealed off.
4. Laboratory lights were switched off to avoid affecting the phototransistors
5. The light-emitting diodes were switched on
6. Scans were initiated on the data acquisition unit and readings were taken at intervals of 1 second
7. The smoke-producing device was switched on to fill the test section with smoke
8. After 5 minutes the smoke-producing device was removed carefully to prevent smoke from escaping from the test section.
9. The jet fan, scrubber fan, and the through-road fan were switched on. At the same time the seals on the through-road inlet and outlet were removed. This marked the beginning of smoke extraction process
10. The smoke extraction process was left to run until all the smoke had been removed from the test section. This was determined when the readings from the smoke sensors stabilized
11. Logged data was stored and analysed.
It was found that smoke from the glycol/water mixture was not suitable due its high moisture content, which condensed inside the scale model. As an alternative, smoke was produced by a smouldering process, using different wood-based solids as fuel, in a low-oxygen environment for safety reasons.. This produced smoke with little or no moisture content at a fast enough rate to fill the scale model. A well-ventilated laboratory was used.
Transient-state experimental and numerical results
Results for three of the eight sensors are presented and discussed here. These sensors are numbers 3, 7, and 8 as defined in Figure 5. To make the comparison more meaningful, both the experimental and numerical results are plotted on the same graphs. For this reason, the smoke concentration scale, which was measured proportionally as electrical resistance from the smoke sensors, was adjusted to match the mass-fraction scale obtained from the numerical results on the graphs when all the smoke has been evacuated. The scaling factor employed was determined from the smoke sensor readings at the beginning of a test (when the whole model was filled with smoke), and at the end of a test (when all smoke were cleared and steady-state smoke concentration was reached). These points were matched with the numerical mass fraction of air values at the beginning and at the end of the numerical simulation test run. Only the relative smoke extraction rate, as determined experimentally and numerically, is thus of interest.
Figure 9 shows the plots of mass fraction of air against time as the fresh air from the jet fan diluted and expelled the smoke from the in-heading. At mass fraction zero and time zero the in-heading was filled with smoke, but as the air was blown into the in-heading the mass fraction of gas mixture increased until the in-heading was almost completely filled with air. The matching experimental smoke concentration is plotted using the same time axes as for the numerical results.
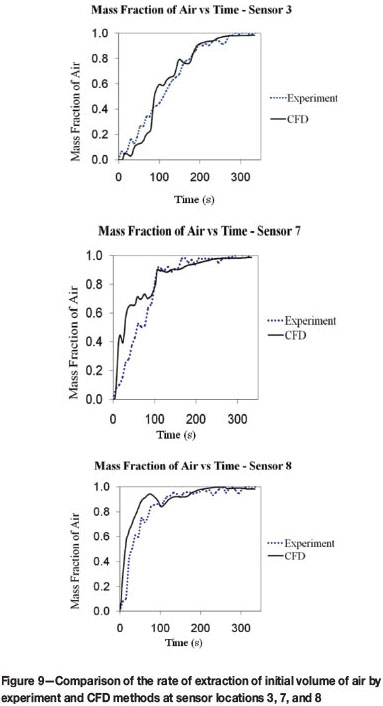
As can be seen, for each sensor the time-dependent shape of the plots for both experiment and numerical results appears to be similar. Of greatest importance is that the numerical results predicted the time needed to clear the model from smoke with relatively good accuracy.
Some deviations between the two sets of results were found (Figure 9) and can be attributed to the following:
1. Friction between air and model wall in the experimental set-up was disregarded in the numerical analysis
2. During the experiment there was a gap of about 3 seconds between the opening of the in-heading inlet and outlet and the switching on of the fans, while in the numerical model these activities took place simultaneously
3. The K-e model used in numerical analysis was based on recommended settings for general boundary layer calculations. More suitable setting may exist.
Development of a method for determining optimum fan position for a simplified geometry
Owing to the relatively good correlation between experimental and numerical results for both the steady and the transient states, numerical-based analyses can be used to determine, for instance, the optimum geometry of a jet fan in a blind in-heading.
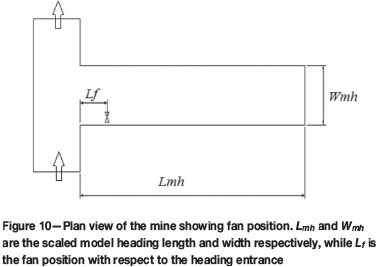
Fan positions that result in minimum smoke extraction times for five different in-heading lengths and two different widths were established. A full width (Wmh = 420 mm) and half width (Wmh = 210 mm) were explored. The results for the width of 210 mm are included only for purposes of illustration, since in this case there would be no space for the jet fan.
The fan position was varied along the in-heading length, but its position with respect to the floor and the sidewall remained fixed. Since the last through-road is the most problematic area as far as dust and methane gas extraction is concerned, the wall at the blind end was used as a sensor position.
A full in-heading length, Lmh = 2333 mm in the scaled model, is used here to illustrate how the searching exercise for optimum fan positions for different in-heading lengths was accomplished. The results for the four positions Lf= 0 mm, Lf = 80 mm, Lf = 500 mm, and Lf = 1000 mm are shown in Figure 11. The extraction times that were obtained from these positions were 285, 165, 560, and 765 seconds respectively. The extraction time is defined as the time needed to reach a mass fraction of air of 0.99 (a mass fraction of smoke of 0.01).
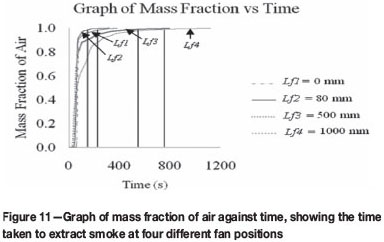
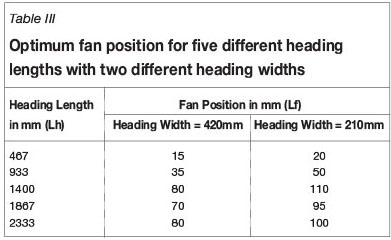
Additional search cases were conducted, which confirmed that Lf = 80 mm was the optimum position for the in-heading length of 2333 mm. The searching exercise revealed the optimum fan position for different in-heading lengths, as shown in Table III.
Some optimum results
From the results in Table III, a graph of fan position against in-heading length was plotted as shown in Figure 12.
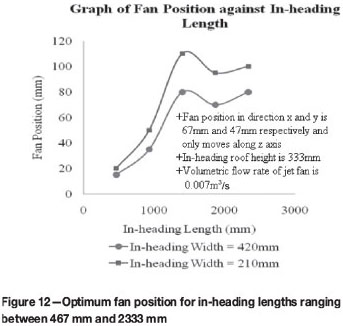
This graph shows that for widths of both 420 mm and 210 mm, the trends for the optimum Lf value are similar. For a given in-heading length, the optimum Lf value was greater for a width of 210 mm than for a width of 420 mm. This indicates that for narrower blind tunnels, the optimum jet fan position appears to be deeper into the tunnel. The optimum fan position is, however, also influenced by factors such as the tunnel height and volume flow rates, but a discussion of these falls beyond the scope of this paper. Similar behavioural trends regarding the optimum position of the jet fan could be extrapolated to full-scale scenarios, provided that the in-heading aspect ratios in terms of depth, height, and width remain the same.
Conclusions
Ventilation techniques are currently used to mitigate the problems of coal dust and methane gas concentrations. The objective of this study was to investigate whether a numerical technique can be used to investigate the best methods of controlling dust and methane gas concentrations in underground coal mines. Due to practical limitation, CFD modelling and experiments were conducted on a scaled-down underground coal mine model instead of at an actual mine.
The numerical and experimental investigations yielded similar results for both steady- and transient-state cases. From this it was concluded that a numerical technique could be used to establish optimized ventilation conditions in scaled-down blind in-headings.
The study further explored whether an optimum position of the jet fan exists for a simplified in-heading. Optimum jet fan positions do in fact exist, which indicates that an optimum jet fan position in full-scale mine application may also exist.
Since the study proved that numerical technique can be used to solve ventilation problems in the scaled-down coal mine model, this technique could be extended to other mine ventilation and related studies, for example air conditioning.
Symbols
Lf Jet fan position from in-heading entrance [mm]
Lh In-heading length [mm]
P Pressure [Pa]
SMx Body force in directions x [N]
SMy Body force in directions y [N]
SMz Body force in directions z [N]
t Time [s]
V Velocity vector (column) [m/s]
x, y, z Space coordinates [m]
u, v, w x, y, and z Velocity components [m/s]
ρ Density [kg/m3]
µ Viscosity due to linear deformation [kg/m.s]
λ Viscosity due to volumetric deformation [kg/m.s]
References
Chander, S., Alaboyun, A.R., and Aplan, F.F. 1990. On the mechanism of capture of coal dust particles by sprays. Proceedings of the Third Symposium on Respirable Dust in the Mineral Industries, Pittsburgh, PA, 17-19 October 1990. [ Links ]
Cheng, L. and Zukovich, P.P. 1973. Respirable dust adhering to run-of-face bituminous coals. US Department of the Interior, Bureau of Mines, Pittsburgh, PA. RI 7765. NTIS No. PB 221-883. [ Links ]
Esterhuizen, G.S. and Gürtunca, R.G. 2006. Coal mine safety achievements in the USA and the contribution of NIOSH research. Journal of the Southern African Institute of Mining and Metallurgy, vol. 106, no. 12. pp. 813-820. [ Links ]
Flint, J.D. 1990. Mine Gas and Coal Dust Explosions and Methane Outbursts -Their Causes and Prevention. MSc dissertation. University of the Witwatersrand, Johannesburg. pp. 3-8. [ Links ]
Liu, X., Guo, L., and Zhang, Z. 2010. Statistics analysis of death accident in coal mines from January 2005 to June 2009. Proceedings of the Asia-Pacific Power and Energy Engineering Conference, APPEEC 2010, Chengdu, China, 28-31 March 2010. pp. 5794-5796. [ Links ]
Nundlall, A.R. 2006. Case study: lessons learnt from recent flammable gas explosions in South African hard rock mines. Journal of the Mine Ventilation Society of South Africa, vol. 59, no. 2. pp. 64-69. [ Links ]
Peng, S.S. and Chiang, H.S. 1984. Longwall Mining. Wiley-Interscience, New York. ISBN 0-471-86881-7. [ Links ]
Thopil, G.A. and Pouris, A. 2010. An overview of the electricity externality analysis in South Africa within the international context. South African Journal of Science, vol. 106, no. 11-12. Article no. 248 . [ Links ]
Wala, A.M., Vytka, S., Taylor, C.D., and Huang, G. 2007. Mine face ventilation: a comparison of CFD results against benchmark experiments for the CFD code validation. Mining Engineering, vol.59, no. 10. pp. 49-55. [ Links ] ♦

