


Services on Demand
Article
 English (pdf)
 Article in xml format
 Article references
Indicators

Related links
-
 Cited by Google
 -
 Similars in Google
Share

 Permalink
Journal of the Southern African Institute of Mining and Metallurgy
On-line version ISSN 2411-9717
Print version ISSN 2225-6253
J. S. Afr. Inst. Min. Metall. vol.114 n.2 Johannesburg Feb. 2014
PRECIOUS METALS CONFERENCE 2013
Investigating the chromium-platinum coated system
N. HaniefI; C.I. LangII; M. TopicIII
ICentre for Materials Engineering, University of Cape Town
IIEngineering Department, Macquarie University, Australia
IIIMaterials Research Department, iThemba LABS Somerset West
ABSTRACT
In this study, the effects of heat treatment on phase formation and surface morphology of the Cr-Pt coated system are investigated using X-ray diffraction and electron microscopy techniques. The CrPt and Cr4Pt (Cr3Pt - A15 type) phases were formed after heat treatment of the coated samples. Heat treating at 1000°C renders a distinct island coating morphology that is non-continuous in nature. A diffusional model is proposed for this coated system with regards to the surface morphology formation after heat treatment.
Keywords: coated systems, morphology, phase formation.
Introduction to the Cr-Pt coated system
The platinum-chromium system has been studied in depth over the last decade as it is known to form a crucial part of many alloy systems. In recent years this system, in applications such as catalysis and nanotechnology, has shown promise for fuel cells (Ghosh et al., 2010; Koffi et al., 2005; Escaño et al., 2011). The study of thin films and coatings also proves useful in determining compositions and compounds with excellent properties that can be used as nano-materials for catalysis (Ghosh et al., 2010. The use of coated systems, including Cr-Pt thin films, has increased recently in applications such as magnetic hard disk media (Ariake et al., 2002; Uwazumi et al., 2002; Kaitsu et al., 2006) for the magnetic recording industry. Coated systems, as referred to in this study, are thick substrates (Cr in this work) with thin coatings (Pt) deposited on the surface. This study focuses on how coated systems are affected by heat treatment and the resulting effects on phase formation and surface morphology. The research aims to determine the mechanism of phase formation in this coated system, as it is known that coated systems behave differently to bulk systems in this regard (Pretorius et al., 1993). Accordingly, experimental parameters can be controlled to form a desired phase with inherent properties for specific applications (Pretorius et al., 1993). Surface morphological changes are also monitored with respect to the diffusion characteristics of this coated system.
The formation of the coating after deposition can be described by nucleation and growth. These processes influence the grain structure that is developed, and ultimately the structural morphology of the coating after heat treatment (Ohring, 2002). Coatings are known to exhibit heterogeneous nucleation after being deposited, which can be described by the theory of capillarity (Ohring, 2002). The establishment of the coating introduces new surfaces and interfaces that provide an increase in the surface energy of the system. This causes coating systems to have different properties to bulk systems owing to the many surfaces that contribute to the total free energy. This can be described by the Gibbs free energy relation: the total Gibbs free energy is increased because in addition to the free energy of the system as a whole, the coated system now contains an interface region between the coating layer and substrate, as well as the surface free energy of the coating, acting upon it. Also inherent in coating layers is the high reactivity of elements, which is due to the increase in the density of the grain boundaries in coating layers also results in the high reactivity of elements (Ohring, 2002). This is caused by the high nucleation rate during the deposition process, which results in the formation of a fine-grained structure (Ohring, 2002). The thermodynamics of the coated system govern the reactions that take place, as systems all strive towards the reduction of total free energy. Therefore reactions take place that continue to reduce the total free energy, and in comparing coated systems to bulk systems, the extra surfaces contribute to this reduction and thus ultimately contribute to the differences in properties between the two systems. This can also be related to a non-equilibrium description of the system, as in coated systems excess atoms available after compound formation will be available for the next compound to form (Pretorius et al., 1993). Thus phase formation can also be attributed to the reduction in free energy of the system (Ohring, 2002).
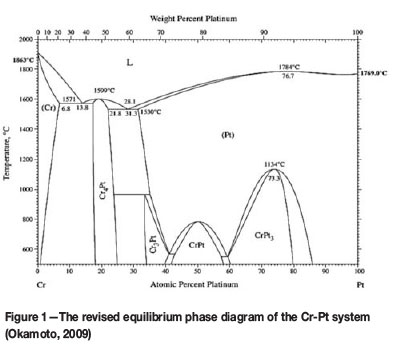
The revised equilibrium phase diagram of the Cr-Pt system is shown in Figure 1. This binary phase diagram is known to contain two Cr3Pt phases with different crystal structures. A congruent phase is formed at a temperature of 1599°C between 17.3 and 25 at.% Pt. This phase is designated the Cr4Pt phase in the revised diagram, but it refers to the Cr3Pt phase with the A15 crystal structure as described in the literature (Okamoto, 2009). The fcc phases include that of the L12 structure, which refers to the phases Cr3Pt and CrPt3, and the L10 crystal structure, which refers to the CrPt phase. After heat treatment, phase formation occurs at the interface region of the substrate and the coating. This phase formation is dependent on the processes of diffusion and the total energy of the system. Systems always tend to be driven towards a lower energy state. This can be taken into account via a thermodynamic description of the phases. Recent publications provide a good thermodynamic description of the Cr-Pt system (Preußner et al., 2009; Zhang et al., 2008).
Experimental procedure
Chromium (Cr) of 99.98% purity was used as substrates and prepared for electron beam deposition: pieces were cut using a diamond cutting wheel and ground to a 1200 grit finish using SiC grit paper. The substrates were then polished using an oxide polishing system with a colloidal silica suspension in the final polishing step. A cleaning procedure using solvents such as methanol, ethanol, acetone, and finally hydrofluoric acid was used to sonicate samples and ensure that the coating would adhere to the substrate surface. Platinum (Pt) (purity of 99.99%) coatings were deposited with thicknesses of 0.1 µm and 0.3 µm. An electron beam sourced evaporation system was used with a deposition rate of 2.4 A/s and a current of 150 mA. High vacuum conditions were present within the deposition chamber under a pressure of 5 x 10⁻⁴ Pa. After deposition, samples were heat treated for 8 hours at a range of different temperatures. These included temperatures of 700, 800, 900, and 1000°C followed by slow furnace cooling, with both heating and cooling rates controlled at 10°C/min. The substrate (after cleaning) and the coated sample before heat treatment are used as references to compare the morphological changes and the subsequent changes in phase formation.
A range of complementary techniques was used to analyse the coatings, including X-ray diffraction (XRD) with analysis using the Rietveld method. A Bruker D8-ADVANCE monochromatic diffractometer was used to obtain XRD patterns, with measurements carried out using of CuKα radiation at 1.5418 Å. Using parameters of 40 kV and 40 mA, diffraction data was measured between 2θ values of 30° and 70° at a 0.03° step size. Phases were identified by matching diffraction peaks using the database of the International Centre for Diffraction Data. Rietveld refinements were performed to determine the volume fraction of phases present within the samples. For this, the TOPAS 4.1 software was used, whereby the peak shapes of all the phases were modelled with the use of pseudo-Voigt functions (Coelho, 2007).
The microscopy techniques used involve both scanning and transmission electron microscopy (SEM and TEM). SEM in the backscattered electron mode (BSE) was used to observe changes in the morphology after heat treatment. A NOVA NANOSEM 230 was used at 20 kV to image the surface of the coating layer after heat treatment. In preparation for TEM, samples were milled in cross section using a focused ion beam (FIB). Prior to milling, a carbon layer was deposited on the area of interest of the coating surface to maintain the integrity of the coating during ion milling. A FEI Helios NANOLAB 650 FIB-SEM was operated using a Ga ion beam at 30 kV. The cross section was transferred to a Cu grid using an Omniprobe lift-out needle as part of the FIB-SEM, and final polishing of the section was completed at 500 eV to a thickness of 50 nm. For an in-depth characterization of the coating layer, scanning TEM (STEM) was performed using a JEOL 2100F TEM operating at 200 kV. Annular dark field (ADF) imaging was obtained of the coating layers in cross section. Energy dispersive spectroscopy (EDS), which provides an elemental quantification of the sample, was used as part of the STEM mode. Spot analyses of the coating layer in cross section were determined in the characteristic X-ray mode. The results for the 0.1 µm and 0.3 µm Pt coated samples, heat treated for 8 hours at different temperatures, are shown.
Results and discussion
The techniques used in this study complement one another in analysing the phase formation and surface morphology of Cr-Pt coated systems.
The formation of phases
Phase formation in the Cr-Pt coated system was analysed using XRD and the Rietveld method (Coelho, 2007). The samples used for analysis had Pt coatings of 0.1 µm and 0.3 µm. These samples were heat treated at temperatures ranging from 700°C to 1000°C for the 8-hour time interval. A reference pattern was also obtained of the Pt coated condition prior to heat treatment. This is shown in Figure 2, where peaks correspond to those of Cr and Pt with no phase formation. This shows that phase formation occurs only after the heat treatment. Also shown in Figure 2 are the XRD patterns for the 0.1 µm Pt coated samples that were heat treated. Two phases are seen to have formed after heat treatment at the range of temperatures considered. These include the formation of the CrPt phase observed at 700°C and the subsequent formation of the Cr3Pt phase at 800-1000°C. The phases observed correspond to the revised equilibrium phase diagram (Figure 1). After heat treatment, the peaks for Pt are not seen, indicating that the Pt is consumed to form the CrPt and Cr3Pt phases.
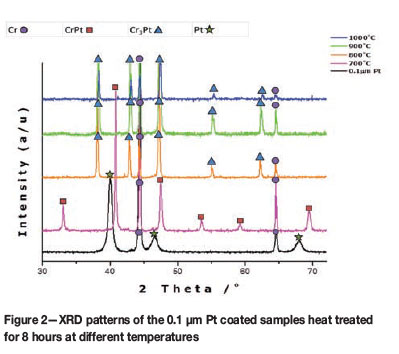
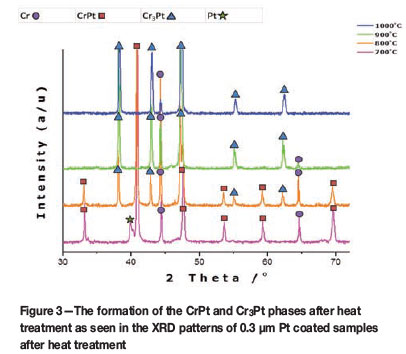
Figure 3 shows the XRD patterns of the 0.3 µm Pt coated samples after heat treatment. A Pt peak at can be seen at 700°C, indicating that the Pt has not been entirely consumed at this point. However, as the temperature is increased, the Pt peak disappears and the consumption of Pt is evident. Even though the Pt is not entirely consumed at 700°C, formation of the CrPt phase is still observed. Owing to the thicker Pt coating, the amount of Pt available for phase formation increases, and the CrPt phase now forms at temperatures of 700°C and 800°C. At 800°C, the CrPt and Cr3Pt phases coexist. At 900°C and 1000°C the Cr3Pt phase is the only phase to form. The Cr peaks are observed at all temperatures for both coating thicknesses. It can be inferred at this point that the CrPt phase decomposes to form the Cr3Pt phase owing to the fact that after complete formation of the CrPt phase, the next phase to form is the phase richer in the unreacted element (Pretorius et al., 1993), which in this case is the excess Cr from the thick substrate.
Volume fraction analysis
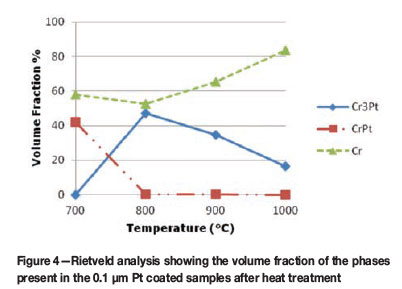
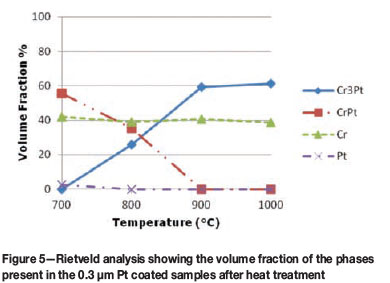
The volume fraction analysis was completed using the Rietveld method with pseudo-Voight functions to model peak shapes (Coelho, 2007). The volume fraction of the phases is determined using the area under each peak and corresponds to the intensity of each phase. The graphical representation in Figure 4 shows the volume fraction of phases for the 0.1 µm Pt coated samples after heat treatment at different temperatures. At 700°C the volume fraction of the CrPt phase is at approximately 40%, decreasing to zero as the temperature is increased. Subsequently, the Cr3Pt volume fraction is increased from zero at 700°C to approximately 50% with an increase in temperature to 800°C, then decreases with a further increase in temperature from 800°C to 1000°C, with an increase in the volume fraction of a Cr-rich phase. This can be attributed to the change in coating morphology, which is described below, and the interaction volume of the X-ray beam. For the 0.3 µm Pt coated samples (Figure 5), the CrPt phase follows the same trend as before with increasing temperature, and decreases in volume fraction as the Cr3Pt phase increases. At 0.3 µm coating thickness, however, more Pt is available for the formation of phases and thus the CrPt phase is now observed at a temperature of 800°C before decomposition is complete. With regard to phases forming sequentially in coating systems, it could be said that the decomposition of the current phase brings about the subsequent formation of a new phase. Thus, if these experimental parameters are manipulated, heat treatment at 1000°C promotes the formation of the Cr3Pt phase, and at 700°C the CrPt phase can be formed. A recent review of the Pt-Cr coated system attempted to relate the effective heat of formation (EHF) model with its phase formation sequence (Hanief et al., 2012). To predict phase formation in this coated system, a more comprehensive study needs to be completed.
Morphological characterization
The following sections describe the results obtained using electron microscopy techniques to characterize the surface morphology of the Cr-Pt coated system after heat treatment, with a view to understanding the processes involved. SEM was used to image the surface of the coating layer, and STEM to image the coating layer and substrate in cross section, both after heat treatment. An elemental quantification is given with the use of EDS spot analyses.
Scanning electron microscopy
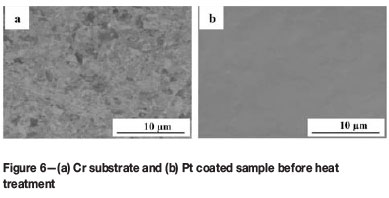
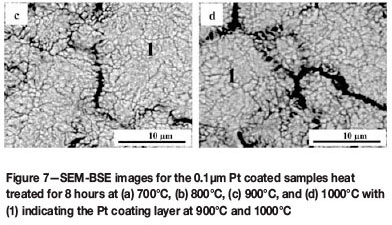
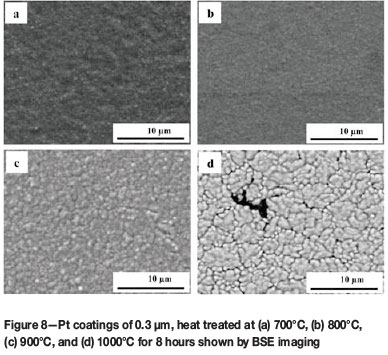
The surface morphology of the Cr-Pt coating layer after heat treatment was imaged using SEM in the characteristic BSE mode, as this technique is sensitive to contrast differences with regards to atomic number. Figure 6 shows the coating morphology of the reference samples. A relatively smooth surface finish is seen for both the substrate that had been polished with an oxide polishing system (a) and the coated sample prior to heat treatment (b). In Figure 7, the surface morphology of the coating layer is shown for the 0.1 µm Pt coated samples after heat treatment at different temperatures. As can be seen, the morphology of the Cr-Pt coated system changes significantly as the heat treatment temperature is increased. A relatively more uniform morphology is observed for temperatures of 700°C and 800°C (Figure 7a and b). At 900°C and 1000°C, however (Figure 7c and d), an island-like morphology is seen where the coating layer (1) is separated by thermal grooving of the grain boundary of the substrate. The compositional differences can be attributed to Pt being a heavier element than Cr, thus the contrast of Pt in the coating layer appears brighter in the image. With an increase in coating thickness to 0.3 µm, as seen in Figure 8, the Pt coatings after heat treatment are more uniform in morphology and do not show the islands as prominently as with the thinner coating, even as the temperature is increased. It can thus be said that the coating morphology depends on the temperature of the heat treatment and also on the coating thickness. The area of interaction of the X-ray beam with the sample is between 1 and 2 mm2. Therefore, for the samples heat treated at 1000°C with the non-continuous coating layer, the XRD measurements include part of the substrate region, which could result in measured decrease in the Cr3Pt volume fraction.
The surface morphology that is formed in this coated system can be ascribed to a diffusional process. As mentioned previously, the formation of coatings after deposition renders a fine grain structure with many grain boundaries (Ohring, 2002). It is said that one of three growth modes can occur during coating formation. Owing to the surface energy of the coating and substrate in the system studied, the island growth mode occurs (Ohring, 2002). This is because the surface energy of Pt is higher than that of Cr (Ohring, 2002). Owing to this growth mode and the fine recrystallized grain structure that evolves during the formation of the coating, the application of heat treatment allows for rapid diffusion along the grain boundaries, both within the coating layer diffusing towards the substrate as well as within the substrate diffusing towards the coating. The activation energies for grain boundary diffusion are smaller than that of the lattice, leading to high diffusivity rates in this regard (Ohring, 2002). The solid solution range of Pt and Cr is broad, extending from 31.3 at.% Pt at 1530°C to 100 at.% Pt at 1769°C (Figure 1), indicating that the solubility of Cr in Pt is very high. This relates to the high affinity Cr has for Pt and indicates that the bulk of the grain boundary diffusion occurs where Cr diffuses into the Pt coating, initiating phase formation. The new phase nucleates at this point, with subsequent lateral diffusion at the interface region and surface diffusion of the coating and the substrate, which are thermodynamically favoured. Subsequent growth of the phase takes place at the interface region until the coating layer is formed. As the heat treatment continues, thermal grooving is observed, which is attributed to surface diffusion driven by surface curvature (Ohring, 2002). A coalescence mechanism is proposed to occur next, wherein larger islands grow in size at the expense of smaller island, such as the process of Ostwald Ripening (Ohring, 2002). What can also be noted in Figure 7 and Figure 8 is the progressive agglomeration of the coating layer as the temperature increases, resulting in the fine separation of agglomerates on the coating surface. This in turn increases the surface roughness and occurs as a result of dewetting of the coating layer (Lee and Kim, 2007). The fine separation of agglomerates is said to be energetically favoured at elevated temperature and thus dewetting of the substrate occurs, allowing the coating layer to rearrange itself into an energetically favourable state by the subsequent minimization of the surface free energy (Lee and Kim, 2007). The surface morphology of this coated system is governed by the reduction of the surface free energy which follows a surface energy increase caused by an increase in the number of surfaces present within coating systems in general. The diffusional model serves to describe the complex processes involved in the formation of the surface morphology that are driven by the minimization of the total energy of the system to form an equilibrium phase and structure.
Scanning transmission electron microscopy
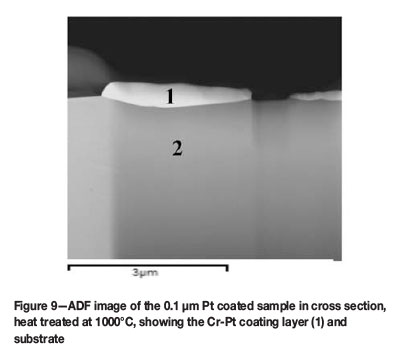
The STEM mode was used to acquire annular dark field (ADF) imaging of the cross section of the coating layer after heat treatment. ADF images show contrast effects related to atomic number, as seen in the BSE images. Figure 9 shows the ADF image of the 0.1 µm Pt coated sample heat treated at 1000°C for 8 hours. The light contrast depicts the heavier element, which can be seen in the coating layer (1), with substrate (2) being darker in contrast. The initial coating prior to heat treatment was 0.1 µm, increasing to approximately 0.5 µm after heat treatment. As the phase formed in this sample is known to be the Cr3Pt phase, this can partially account for the increase in coating thickness after heat treatment. The cross section of the island-like sample shows a non-continuous coating layer morphology on the surface of the substrate, as expected from the SEM images. According to the diffusional model proposed, the non-continuous coating layer morphology is attributed to various mechanisms such as the island growth mode with recrystallized grain structure in the coating formation, the mechanisms of diffusion involving the grain boundary, surface, and interface, as well as Ostwald ripening and dewetting processes to form the island-like morphology. This also plays a role in the increase of the coating thickness after heat treatment. Agglomeration and dewetting of the coating layer, which is driven by surface curvature (Lee and Kim, 2007), increases the thickness of the non-continuous coating layer as seen in cross section.
Energy dispersive spectroscopy
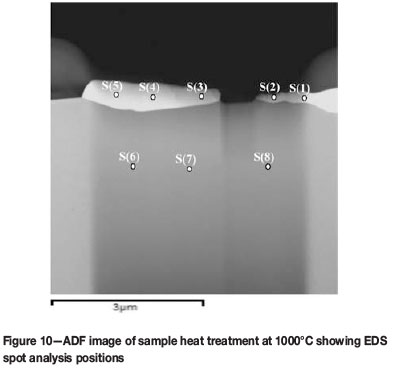
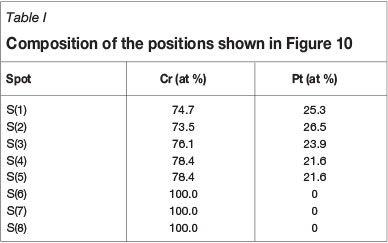
EDS was used for elemental composition analysis of the coating layer after heat treatment. Spot analyses were determined in characteristic X-ray mode, and the position of each spot is shown in Figure 10. The composition of each spot determined is given in Table I. Spots 1-5, taken within the coating layer region, have an average composition of 24 at.% Pt. This inherently corresponds to the Cr4Pt (Cr3Pt with A15 crystal structure) phase as seen in the revised equilibrium phase diagram (Figure 1). The literature also confirms that Cr4Pt (Cr3Pt with A15 crystal structure) is stable and thus masks the formation of the Cr3Pt (L12) phase (Okamoto, 2009). This result is in agreement with the XRD analysis, which showed the formation of this phase after the heat treatment of 1000°C. Spots 6-8, within the substrate region, correspond to the Cr substrate. Thus the Cr3Pt phase referred to in all the results is that of the A15 type crystal structure or the Cr4Pt phase, otherwise known as Cr3Pt with A15 crystal structure.
Conclusions
A non-continuous coating layer with increased thickness is formed during heat treatment of Pt coatings deposited on Cr substrates. The phases formed in the coating layers correspond to the CrPt and Cr3Pt (A15) phases. Phase formation is affected by the coating thickness and the temperature and duration of the heat treatment. The experimental parameters can be manipulated to form the CrPt and Cr3Pt (A15) phases. A diffusional model is proposed, by which the minimization of the total free energy within the coated system is maintained, and which includes the processes of an island growth mode in the coating formation and mechanisms of diffusion that include grain boundary, lateral, and surface diffusion. as well as thermal grooving, Ostwald ripening, and subsequent dewetting of the coating to form an island-like surface morphology after heat treatment.
Acknowledgments
The authors wish to acknowledge Mintek and the National Research Foundation for funding this research. The use of the facilities at the Centre for Materials Engineering, and Electron Microscope Unit, UCT; Solid-State and XRD laboratories at iThemba LABS, Somerset West; and the Centre for High Resolution Transmission Electron Microscopy, NMMU is greatly appreciated.
References
Ariake, J., Honda, N., Ouchi, K., and Iwasaki, S. 2002. Pt and Pd intermediate layers for controlling Co-Cr-Nb-Pt layer growth in double layered perpendicular magnetic recording media. Journal of Magnetism and Magnetic Materials, vol. 242-245. pp. 311-316. [ Links ]
Coelho, A. 2007. TOPAS V4.1, Coelho Software, Brisbane, Australia. [ Links ]
Escaño, M.C., Gyenge, E., Nakanishi, H., and Kasai, H. 2011. Pt/Cr and Pt/Ni catalysts for oxygen reduction reaction: to alloy or not to alloy? Journal of Nanoscience and Nanotechnology, vol. 11. pp. 2944-2951. [ Links ]
Ghosh, T., Leonard, B.M., Zhou, Q., and Disalvo, F.J. 2010. Pt alloy and intermetallic phases with V, Cr, Mn, Ni, and Cu: synthesis as nanomaterials and possible applications as fuel cell catalysts. Chemistry of Materials, vol. 22. pp. 2190-2202. [ Links ]
Hanief, N., Lang, C.I., Bucher, R., and Topic, M. 2012. Phase transformations and surface characterization of the platinum-chromium coated system. Journal of the Southern African Institute of Mining and Metallurgy, vol. 112. pp. 5-7. [ Links ]
Kaitsu, I., Inamura, R., Toda, J., and Morita, T. 2006. Ultra high density perpendicular magnetic recording technologies. Fujitsu Scientific & Technical Journal, vol. 130. pp. 122-130. [ Links ]
Koffi, R.C.C., Coutanceau, C., Garnier, E., LÉGER, J-M., and Lamy, C. 2005. Synthesis, characterization and electrocatalytic behaviour of non-alloyed PtCr methanol tolerant nanoelectrocatalysts for the oxygen reduction reaction (ORR). Electrochimica Acta, vol. 50. pp. 4117-4127. [ Links ]
Lee, J.-M. and Kim, B.-I. 2007. Thermal dewetting of Pt thin film: etch-masks for the fabrication of semiconductor nanostructures. Materials Science and Engineering A, vol. 449-451. pp. 769-773. [ Links ]
Ohring, M. 2002. Materials Science of Thin Films. Academic Press, London. [ Links ]
Okamoto, H. 2009. Cr-Pt (chromium-platinum). Journal of Phase Equilibria and Diffusion. vol. 30. pp. 295-296. [ Links ]
Pretorius, R., Marais, T.K., and Theron, C.C. 1993. Thin film compound phase formation sequence: an effective heat of formation model. Materials Science and Engineering A, vol. 10. pp. 1-83. [ Links ]
PreujJner, J., Prins, S., VÖlkl, R., Liu, Z-K., and Glatzel, U. 2009. Determination of phases in the system chromium-platinum (Cr-Pt) and thermodynamic calculations. Materials Science and Engineering A, vol. 510-511, pp. 322-327. [ Links ]
Uwazumi, H., Sakai, Y., and Takenoiri, S. 2002. Magnetic layers for perpendicular recording media. Fuji Electric Review, vol. 48. pp. 73-77. [ Links ]
Zhang, C., Zhu, J., Bengtson, A., Morgan, D., Zhang, F., Yang, Y., and Chang, Y.A. 2008. Thermodynamic modeling of the Cr-Pt binary system using the cluster/site approximation coupling with first-principles energetics calculation. Acta Materialia, vol. 56. pp. 5796-5803. [ Links ] ♦

