


Servicios Personalizados
Articulo
 Inglés (pdf)
 Articulo en XML
 Referencias del artículo
Indicadores

Links relacionados
-
 Citado por Google
 -
 Similares en Google
Compartir

 Permalink
Journal of the Southern African Institute of Mining and Metallurgy
versión On-line ISSN 2411-9717
versión impresa ISSN 2225-6253
J. S. Afr. Inst. Min. Metall. vol.114 no.1 Johannesburg ene. 2014
SAMPLING AND ANALYSIS PAPERS
The allocation of gold production from multiple shafts feeding a common treatment plant using run-of- mine sampling of ore deliveries
H.E. BartlettI; L. KorffII; R.C.A. MinnittIII
IHugh Bartlett Consulting
IIHarmony Gold Mining Company
IIISchool of Mining Engineering, University of the Witwatersrand Johannesburg, South Africa
SYNOPSIS
Previously, the grade of ore at the shaft head was taken to be equivalent to the grade measured in the faces by means of chip sampling. The tonnage mined from the stopes is determined from survey volumetric measurements. Estimates of shaft head grade and tons include the grades and tons of waste, development ore, sweepings from old areas, and other sources, not all of which are sampled. The tonnage of ore delivered at the shaft is often estimated using skip factors. These factors are subject to manipulation and not all the skips are filled to the same level. Consequently, both the grade and tonnage of ore delivered at shaft head are subject to a measure of uncertainty.
For many years, these uncertainties have led to disputes between shaft managers and metallurgists over the reconciliation between shaft tons and grade and plant tons and grade. These problems are compounded when several shafts feed a central processing plant. Shaft bonuses and a shaft's profitability are affected by poor gold allocation methods. Without measurement of the grade and tonnage from all shafts, a poorly performing shaft could benefit at the expense of the other shafts.
In order to improve the measurement of grades and tonnage at the shaft head, which is the custody transfer point between the mine and surface operations, South African mining companies have developed a methodology to measure the mass of ore from each shaft using rail weighing equipment, and the run-of-mine grades delivered from each shaft using cross-stream (go-belt) sampling.
Harmony Gold Mining Company has implemented the rail weighing and go-belt sampling methods for their shafts.
This paper deals with the statistical tests on the procedures and control measures that are in place to establish confidence in the gold allocations. The metal accounting system for examining the allocations follows the first principle of the AMIRA P754 Metal Accounting Code of Practice namely 'The metal accounting system must be based on accurate measurements of mass and metal content. It must be based on a full check-in check-out system'. The check-in is mass and grade of run-of-mine ore and the check-outs are the plant input grades and the recovery and residue from the plant. The balances between check-in and check-out are the subject of the statistical analyses, which have been conducted using the classical statistical tests and procedures that are generally used in all fields of endeavour.
It is concluded that the gold allocation procedures that rely on go-belt sampling and rail weighing of ore from shafts has been successfully implemented, and that the system, which has been in operation at Harmony since 1993, has won general acceptance from stakeholders, with the gold allocations being perceived as being fair to all. Apart from the on-mine issues of bonuses and fair allocations, accurate metal accounting assists in the broader issues of generating accurate production figures for management.
An added benefit of weighing and sampling ore at the shaft head has been that shafts now have daily moving average grades, which are used for grade control. The go-belt sample at the shaft head is the first accurate sample of production in the value chain from face sampling to gold bullion.
Keywords: metal accounting, go-belt sampling, run-of-mine sampling, codes of practice, AMIRA P754, train weighing, statistical analysis, gold split, allocation of gold, metal balance, grade control.
Introduction
At Harmony Gold Mining Company, ores from five different shafts and four different waste rock dumps containing marginal ore are treated in a common plant to produce gold bullion, which has to be allocated to the different sources.
Samples of run-of-mine ore with top particle sizes of 250 mm are taken with go-belt samplers from the conveyor belts feeding ore to the rail hoppers used to transport the ore to the treatment plant. The sample increments are accumulated in bins, which are transported by truck to a sample preparation facility. Here the bulk samples (approximately 800 kg) are successively crushed and split to provide eight samples for fire assay at the laboratory.
The mean grades from all the sources are multiplied by their tonnages to obtain the gold content per month from each source. The ratios of these individual contents to the total feed to the plant are used to apportion gold delivered from these sources. This process of apportionment is called the 'gold split', which is the management tool used to control and monitor the gold produced at each shaft.
In the gold split there are three key transfer points: firstly, ore deliveries from belt sampling; secondly, ore into the plant from thickener underflow sampling; and thirdly, gold recovery in bullion plus residue. There are also material balances that are measured between the components of ore delivered from the shafts and the thickener underflow in the plant, as well as between the thickener underflow and the recovery of bullion and residue.
Ore flows from shafts to the plant
The metal accounting flow sheet indicating the five shafts and four surface sources is shown in Figure 1. The run-of-mine ore, having a top particle size of about 250 mm is fed by conveyors into rail hoppers for transport to the treatment plant. Go-belt samplers sweep sample increments at fixed tonnage intervals into sample bins. When the sample bins are full they are transported by truck to the sample preparation plant, where the bulk samples are crushed, split, and pulverized to produce laboratory samples for assay.
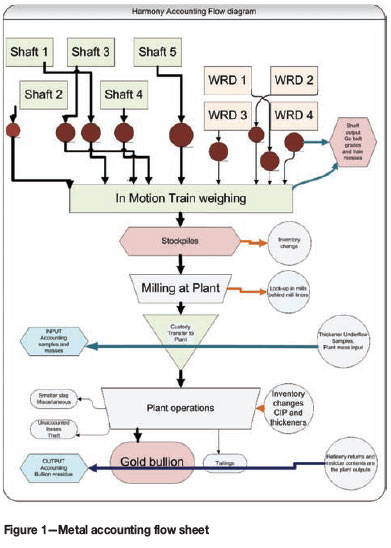
Each of the rail hoppers carrying run-of-mine ore is individually weighed en route to the plant using an in-motion train weighing system (Figure 1). The rail weighing system is calibrated frequently using two hoppers of known weight.
At the plant the mass of the ore is measured on belt weighers as it is fed into the mill silos. The tonnage treated is determined from flow and density measurements of pulp fed to the plant. Daily reconciliations between tons delivered and tons treated are performed taking silo levels into account.
The tonnage treated is the official mass. The official masses from each of the sources are obtained by reconciliation between the total of the train weights after correction for moisture content and the tons treated.
After milling, the slurries produced are sampled as thickener underflow samples using cross-stream cutters taking increments at regular intervals to produce composite shift samples that are assayed in the laboratory. These samples are of finely ground material, more than 95% passing 150 µm. The samplers are of appropriate design and take increments very frequently. Therefore the samples are considered to be accurate measures of plant input. The grades obtained are the official grades of the output from ore deliveries and the input to the metallurgical operations.
After the thickeners, the slurries are treated in the plant to produce gold bullion, which is sent to the gold refinery, and residue tailings, which are sampled in a similar fashion to the thickener underflows. The tonnage of tailings is taken to be the same as the plant feed, as the gold recovery process results in virtually no reduction in the dry mass of ore.
In addition to the main outputs of bullion and residue tailings, there are periodic outputs of returns from smelter slag and assorted scrap gold. These outputs are measured and recorded and are credited to the plant at the time the returns are received from the refineries.
There is possibly an unknown and unaccounted for loss in terms of theft and of gold in unmeasured streams.
An unmeasured change in inventory occurs in the milling circuits, where gold accumulates behind the mill liners in autogenous mills. This is a well-known phenomenon and is controlled by appropriate design of liners and liner backings. However, the mills are before the thickener underflow samplers that give the official plant input figures. Therefore the build-ups in the mills are not taken into consideration as part of the metallurgical accounting.
There is a change of inventory in the plant in thickeners, in the CIL plant, and in the smelthouse. The gold inventory in the various sections is estimated at month end.
Methods used to examine balances
Monthly averages of the belt samples from all the gold sources were calculated from operating data obtained over a period of 10 months and the precision of these monthly averages was investigated. Having obtained the precision of the monthly averages of the belt sampling results, the quantities of gold (kilograms) from all sources were compared to the gold content of the thickener underflow fed to the plant, the recovered gold bullion, and the plant tailings.
The statistical check-in check-out system recommended in P754: Metal Accounting Code of Practice (AMIRA International, 2007) was used in this study. Statistics for the various inputs and outputs at the key custody and transfer points were calculated using standard statistical methods.
A clear distinction needs to be made between the Theory of Sampling (Pitard, 1989), as proposed by Gy (1982),which applies specifically to broken ores, and sampling in general as practiced in most fields of endeavour. Sampling is described in many textbooks for different disciplines. One such description is given in Moore and McCabe (1998). In Gy's Theory of Sampling, a sample is a single entity and is obtained by the reunion of several increments and is meant to represent the material from which it has been extracted (Pitard, 1989). In contrast, a sample in most disciplines is a group of individuals and is never a single sample. Whatever the sampling method, an individual sample can never represent the distribution of a population, which is determined from the statistical sample.
According to the Theory of Sampling, an attempt is made to take the 'perfect' sample and, from this single sample, to model the variances that could be expected for the material from which the single sample had been extracted. For the statistical approach the individual samples are taken as they become available and the variances in the materials are calculated using statistical samples, each containing many individual samples. The standard error of the means for the statistical sample becomes progressively smaller with the increasing number of individual samples. Also, according to the central limit theorem in statistics, the distributions of the means approach closer to normality even if the individual samples are taken from lognormal or other skewed distributions. Therefore, with enough individual samples the presence of outliers will have little effect.
Typically, a bulk sample that is sent to the sample preparation facility at Harmony consists of 10 to 20 individual increments taken from the belt, and 30 to 40 bulk samples per month are prepared for analysis using eight assay aliquots. This gives 525 increments per month in 35 bulk samples with 280 assay determinations per month for a single shaft.
The important statistics are the mean, or average, of all the results and the standard deviation of this mean, which is called the standard error of the mean. These statistics are calculated for the statistical samples, which are comprised of many bulk samples, which in turn are comprised of 10 to 20 increments extracted from the conveyor belts by the go-belt samplers.
Although the means may be acceptable, there are concerns that systematic biases could arises as a result of inaccurate sampling, the loss of the fines from the belt, or the failure of the cutter to extract larger particles. Such incidents do occur, but since the cross-belt sampling is essentially a random process, with enough increments, the effect of these inefficiencies in the sampling procedure is not significant provided the samplers are inspected and maintained.
Long-term biases would be detected by comparisons between the average results from the go-belt samples and the thickener underflow sampling in the plant.
The total variance of an overall sampling process requires that the variances of the component steps - sampling, sub-sampling, analysis, and mass measurement - be summed. This so-called component of variance analysis is performed using the methods prescribed in analytical chemistry (Ellison, Roslein, and Williams, 2000), which involves subdividing the errors associated with sampling, sample preparation, calibration, and the other steps involved in the analysis of individual samples.
Sampling of run-of-mine ore
There are three stages in the sampling of run-of-mine (ROM) ore, namely the collection of primary increments by the crossbelt samplers, the mass and size reduction of the bulk samples to obtain aliquots for the fire assays, and the fire assays themselves.
Primary go-belt sampling
The ROM sample increments are extracted by a cross-belt cutter, referred to as a go-belt sampler, with a cutter aperture of 450 mm. The cutter traverses across the belt at an angle calculated to minimize the disruption of the load on the belt, and so that the angular speed of the cutter is matched to the speed of the belt.
The cutter is programmed to sweep an increment off the moving belt after a specified tonnage of ore, measured with belt weightometers, has passed over the belt. The tonnage interval between increments is about 160 t, but this varies from shaft to shaft. The width of the conveyor belts varies between 450 mm and 600 mm at the different shafts, with the primary increments having a mass of about 50 kg.
Sensors are fitted ahead of the cross-belt samplers to detect large rocks on the belts, which would damage the sweep arm if it were to attempt to collect them. The sampler is also programmed not to sweep if there is no load on the belt.
Various concerns arise from the operation of the go-belt samplers, chief among them being:
►Fine material may not be completely removed and is left on the bottom of the belt after the sweep. The quantity of this material is minimized by attaching strips of rubber on the trailing edges of the cutters
►Large rocks, over 300 mm in size, are not collected for safety reasons, and this could cause bias if the large rocks form a significant proportion of the feed and they are different (lower) in grade than the bulk. The proportion of large rocks is kept to a minimum for process reasons, and therefore their effect on sampling bias would be minimal relative to the precision of this sampling method.
In operation, the cross-belt samplers take increments at the tonnage intervals specified for the different shafts and discharge them into 1 m3 bins that are left in place until they are filled. Therefore there is more than one bin at those shafts with high tonnages, whereas at the smaller shafts one bin could take some days to fill.
On average the bins contain 800 kg or 16 by 50 kg increments, which represents between 400 and 1000 t of ore. The sample bins are transported by truck to the sample preparation plant where the samples are dried, crushed, and split in stages to obtain the samples for assay.
All samplers are inspected daily for wear on the brushes and to ensure that the sweep arm takes a clean cut, leaving as little fine material as possible on the belts.
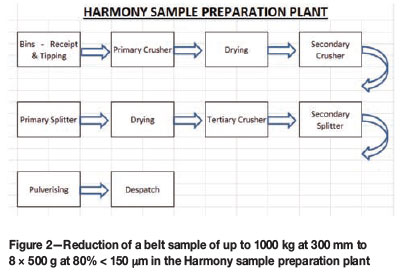
Sample preparation plant
A belt sample of up to 1000 kg is received at the plant from the shaft. The sample is passed through a 300 mm screen prior to primary drying with infrared heaters. Primary crushing to <70 mm is followed by secondary crushing to <25 mm, after which the sample mass is reduced by 7/8ths. At the primary splitter the 7/8ths of the sample is discarded via a conveyor belt and 1/8th progresses to final drying. Tertiary crushing to <6 mm is followed by secondary splitting. Again, 7/8ths is discarded and 1/8th is of the sample is pulverized to 80% <150 µm. At final splitting all eight sub-samples are packed and sent to the laboratory for analysis.
All samples are analysed at the Harmony laboratory, which has SABS 17025 accreditation.
The sample ticket with the necessary information from the shaft accompanies the sample throughout the process. Empty bins are hosed out, while cleaning continues as part of a procedure to avoid contamination. At regular intervals grading analyses are done at the laboratory. A quartz sample is processed weekly to monitor any possible contamination.
To ensure that a high standard of preparation is maintained, each step of the procedure, which includes adherence to safety standards, is checked by a supervisor. The flow sheet for the plant is given in Figure 2.
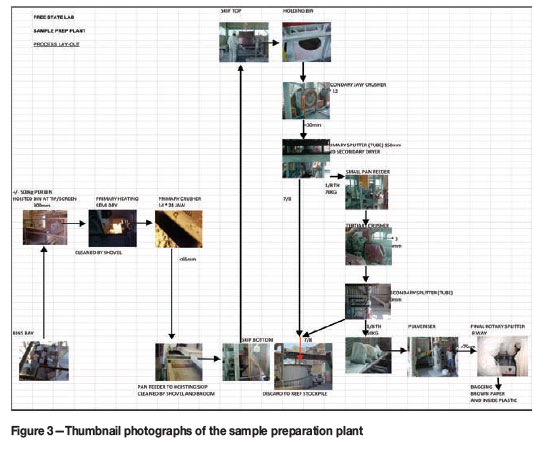
Photos of the plant are shown in Figure 3. The primary and secondary splitters have been replaced with Multotec rotating plate splitters.
Statistics for ROM sampling
Precisions of single samples and of averages of samples
Sub-sampling and assay variance
The relative standard deviation as a percentage (RSD%) is defined as:
RSD% = Std. Dev/Mean*100%
The average grade for a bin sample is calculated from the eight assays of the final pulverized samples, and the RSD% is a function of grade, with low-grade ore (0.4 g/t) having an RSD°/o of about 10% whereas higher grade ores (5 g/t) have an RSD% of about 5%. As expected, the RSD% for the averages of the eight sub-samples is much less than the RSD% between bins.
The RSD% of the pulverized samples is for those samples that have been split out of the bulk samples of the bins. There are three stages of size reduction and splitting:
►Primary and secondary crushing to 25 mm and splitting out 1/8th
►Crushing to 6 mm and splitting out 1/8th
►Pulverizing the final 1/8th to <150 µm and splitting out eight sub-samples on a rotary splitter. Single assays are performed on these.
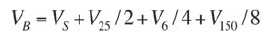
The variance (expressed as the square of RSD%) at each stage is calculated. Since variances are additive, the total variance for a bin, with the current sample preparation methods, is given by:
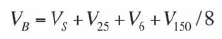
where:
VB = Variance from bin to bin as measured
Vs = Variance of go-belt sampling
V25 = Variance of splitting at 25 m.
V6 = Variance of splitting at 6 mm
V150/8 = Variance of splitting at 150 µm divided by 8 (because eight assays are done).
The between-bin variance is determined by statistical analysis of the grades of the bins and the variance of go-belt sampling is estimated by difference.
V150 is determined as the square of the RSD% of the eight assays on the final samples.
The RSD% of these assays is between 5% and 10% for a single assay. With eight assays the RSD% of the mean would be less than 2%. There is therefore no point in increasing the number of assays of the pulverized samples.
However, the overall bin-to-bin variance, VB, could be reduced by rationalizing the assay protocols and analysing more than one split at the 25 mm and 6 mm splitting stages.
A proposed regime for sample preparation is given in the nested design in Figure 4.
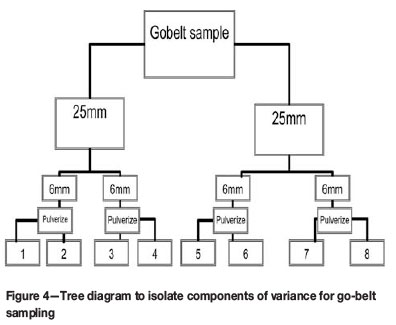
V25 and V6 cannot be determined for the existing flow sheet for the sample preparation plant because all eight assays pertain only to the pulverized <150 µm material.
At present the variances at 25 mm and 6 mm are included in the bin-to-bin variance of the go-belt sampling. With some changes to the flows in the sample preparation plant, as indicated in Figure 4, it would be possible to split out two sub-samples at the 25 mm stage and to split these into two sub-samples at the 6 mm stage, and then to assay two aliquots. In this way there would still be eight assays for every bulk sample but the variance at the 25 mm and 6 mm stages would be reduced by half and the total variance would be:
In this way the bin-to-bin variance would be reduced without any additional assays.
The bin-to-bin variance, Vb, would be lower than the 30% RSD values that are now encountered if the proposed changes to the sample preparation plant were to be adopted. The magnitude of the reduction depends on the magnitudes of V25 and V6.
There is a caveat to the proposed changes. The laboratories apply QC procedures to their results and high and low results of the eight aliquots are eliminated. With the proposed method of splitting there will be increased variance between aliquots. No results should be deleted unless there is direct evidence of a blunder, such as cracked crucible, sample swop etc.
Semivariogram of bin samples
The standard error of the mean expressed in relative terms is the standard deviation divided by the square root of the number of observations (N).
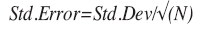
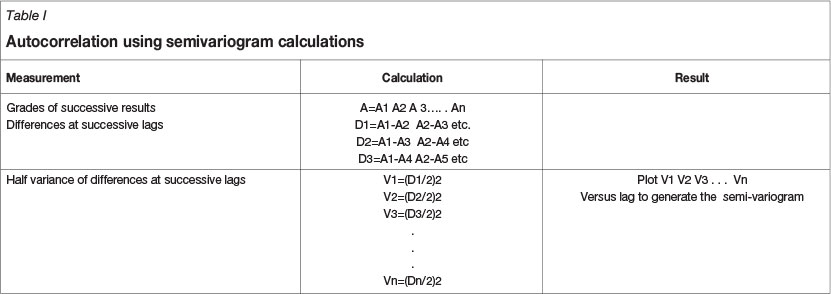
For this equation to apply there should be no autocorrelation of the data. The auto-correlation for the bin samples was tested using a semivariogram (Table I).
The semivariogram shown in Figure 5 indicates that there is no autocorrelation at successive lags. The 'nugget effect', which is the intercept on the y-axis at zero bin spacing, is nearly the same as the mean variance. The nugget effect is the variance at zero spacing and is the variance that would be obtained for two samples immediately adjacent to one another.
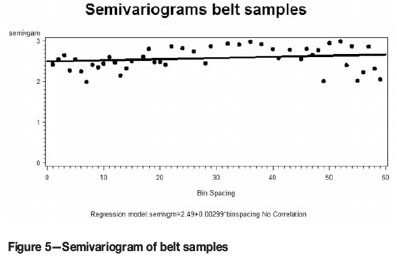
Because there is no correlation between bin samples, all bin grades in a month would have an equal weighting and the standard error of the means for a month can be estimated from the average of the results.
As shown earlier, the bin-to-bin variance is high, with an RSD of about 30%, and the contributors to this include the variance of go-belt sampling itself and the variances introduced in the splitting stages at the sample preparation plant. The variances of the sample preparation stages could be minimized by performing replicate assays at these stages, but are likely to be considerably less than the variance of the go-belt sampling itself.
The sampling variance associated with an increment taken from a lot includes the Fundamental Sampling Error arising from the constitutional heterogeneity of the ores, as well as all other sampling errors that may have accumulated during the sampling processes. This variance is equivalent to the nugget effect on the semivariogram in Figure 5. Methods for calculating the mass of sample to obtain a minimum specified variance (Pitard and Minnitt, 2009) and methods to calibrate the well-known Gy formula relating variance to mass of an individual sample and its particle size are by Francois-Bongarcon and Gy (2002). Minnitt Assibey-Bonsu (2009) and Bartlett and Viljoen (2002) have also applied the calibration methods. However, the variance that is reflected in the nugget effect provides no information about the variance of the statistical sample from which the individual sample has been drawn. Since the main requirement for metal balancing is the variance of the statistical sample, it is therefore necessary to calculate the actual variances from the statistical samples of the grades.
As indicated above, the variance of go-belt sampling is due mainly to the constitutional heterogeneity of the ores, with contributions to the variance from other sampling errors that arise when taking the primary increments. For example, although every care is taken to sweep the belts clean when the increments are taken there are times when material is left on the bottom of the belt. Increments from the belt could also be biased because not all size ranges are collected in the single sample. However, these effects should be regarded as second-order refinements in the light of the 30% RSD of go-belt sampling. On the basis of these considerations, there is not much motivation to spend time and resources on ensuring the go-belt sampler, or some modification thereof, is taking a perfect cut as specified in the general rules for sampler design.
Bin-to-bin variance and average RSD% per bin
Histograms of the distribution of the grades of the bins for one of the shafts are shown in Figure 6.
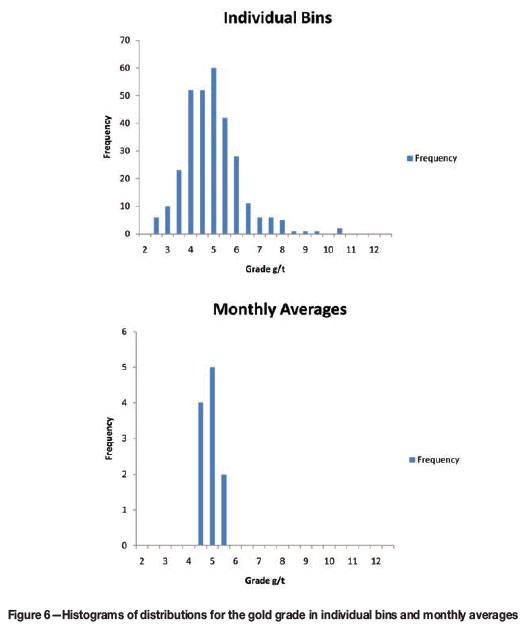
The means for the individual data and for the monthly averages are the same, but the standard deviation is reduced in the ratio of the square root of the number of bins in a month. There are outliers for the individual bins but none for the monthly averages.
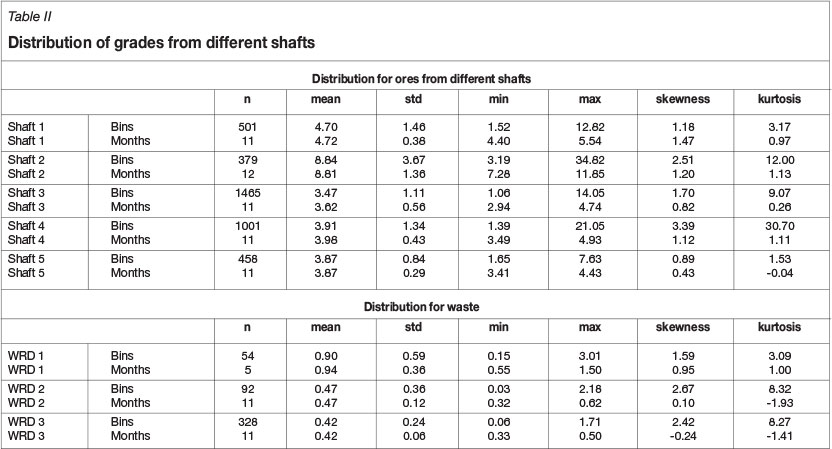
Descriptive statistics of the distributions for bin values and monthly averages for the bins are shown for the different shafts and sources of waste in Table II.
It can be seen from Table II that the means of the individual results and of the monthly means are close.
The minimum values are increased, the maximum values decreased, and the standard deviations reduced for the monthly mean values.
The central limit theorem states that data from skewed distributions tends towards a normal distribution as it is averaged, and that the mean of the original distribution and the average distribution will remain the same.
RSD°% per month for different shafts
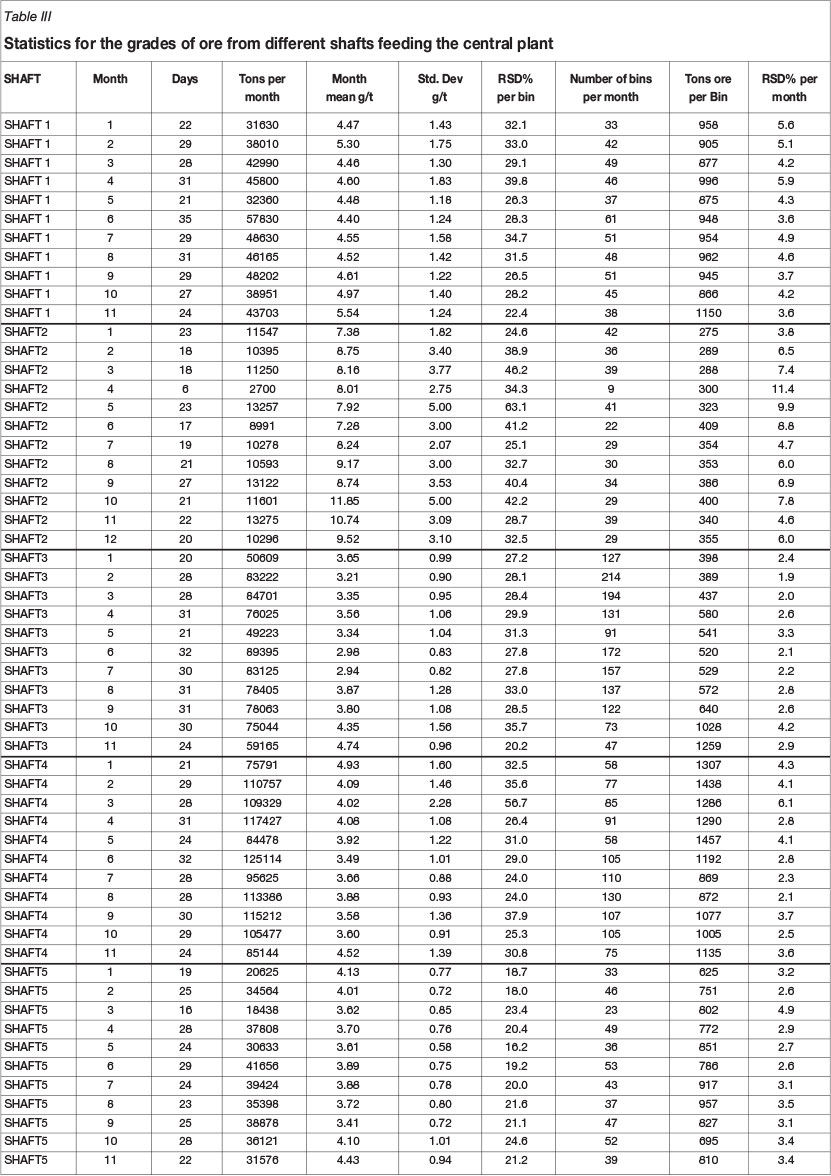
For the gold split it is necessary to estimate the precision of go-belt sampling for the average of all the bins sampled during the month.
The RSD% per month is:


The monthly precisions presented in Table III depend on the precision per bin and the number of bins in a month. The precision per bin is poor and the RSD is of the order of 20% to 40%. However, there are a large number of bins per month and the RSD% for the monthly means is reduced accordingly.
The tons of ore per bin are a calculation of the tons of ore per month divided by the number of bins in that month.
The bins are not weighed but contain about 800 kg of sample, which represents 10 to 20 individual increments depending on the frequency and the belt loading. The standard frequency is for an increment to be taken every 160 t, but this varies from shaft to shaft.
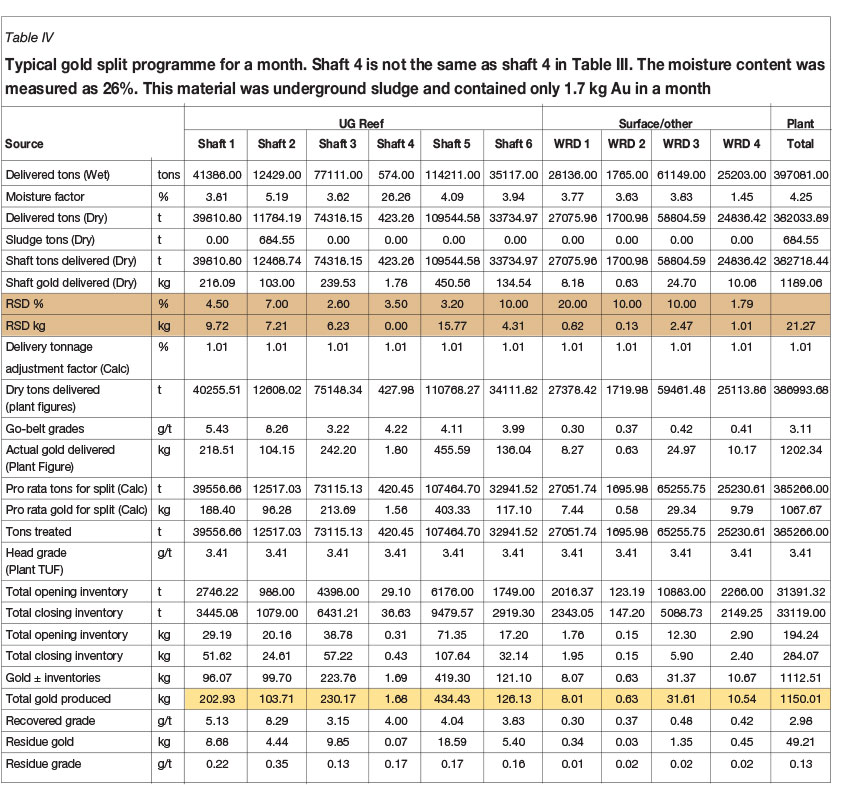
Gold split programme
Table IV is a typical gold split that is produced each month to allocate tons and grade to the various shafts and surface operations feeding ore to the central plant. The tons delivered are determined on the train weighing system and are adjusted for moisture content. Daily moisture samples are taken with the go-belt samplers separately from the bulk samples sent to the sample preparation plant. The bulk samples lose moisture while they are waiting to be transported and they are also dried in the sample preparation plant before crushing.
The mass of ore in the hoppers is checked by passing two hoppers, one filled to the top with concrete and sealed and the other half full, over the weighing system every day. If the results fall outside the known weights the weightometers are re-calibrated. Outside experts in weightometer calibration also perform 6-monthly calibration tests.
A comparison is made between the dry tons delivered as determined from the train weighing system and the tons treated as determined by flow and density measurement in the plant. The comparisons fall within 1% or 2%, showing that the tonnage measurements are accurate.
The 'shaft gold delivered' is the gold content in kilograms from a shaft calculated from the tonnage multiplied by the monthly average go-belt sample grade. The confidence, at one standard deviation or a probability of 68%, and the kilograms from each source are calculated from the monthly RSD% values for the different sources as given in Table III. The waste RSDs are higher than the percentage RSDs from the ore sources but their kilogram contributions are low (highlighted region in Table IV).
The variance of the gold for each source is the square of the RSD%. These variances are added for all sources and the square root of the total is taken as the RSD% for all sources.
The overall confidence in the total gold delivered to the plant from all sources was 21 kg in 1189 kg gold in a typical month, giving an RSD of 1.8%. Over 12 months the RSD% for go-belt sampling would be 0.5%, which is within the confidence of the mass measurement and assays.
The 'shaft gold' for all sources is added to obtain the total gold from the shafts and the ratios of the individual source to the total yields the split between them.
These ratios are used to split the gold finally produced in the plant among the various sources.
Comparison of monthly go-belt grades, thickener underflow, and recovery plus residue grades
The statistical analyses on the go-belt sampling indicated that the precision (RSD%) of the means of all the bin samples is about 1.8% per month and 0.5% per year (1.8/√12=0.52% ). However, these analyses do not give any measure of accuracy, which is defined in terms of a value being close to the unknown true value.
The accuracy of the means of the go-belt sampling is assessed by comparing the grades of go-belt sampling to the grades of thickener underflow (TUF) samples in the plant and the recovery plus residue (R+r) determined from the bullion (recovery) actually sold and the plant residue(residue).
The accuracy of the recovery (bullion sold) is absolute and the plant residues are measured with appropriate sampling and analytical procedures.
However, the gold produced, which gives the R+r grade, is complicated by the changes in inventory in the plant and by unknown loss, which could include theft. There are lockups and releases from month to month in thickeners, in the CIL sections, and elsewhere in the plant. Over a period the changes in inventory should sum to zero.
The thickener underflow grade (TUF) from sampling plant feed should be the most accurate measure of grade. The samplers are cross-stream samplers operating at sufficient frequency to obtain shift samples that are assayed by shift. The shift and daily samples are accumulated monthly. The TUF grade is not affected by inventory changes or losses in the plant, and is not affected by tonnage measurements.
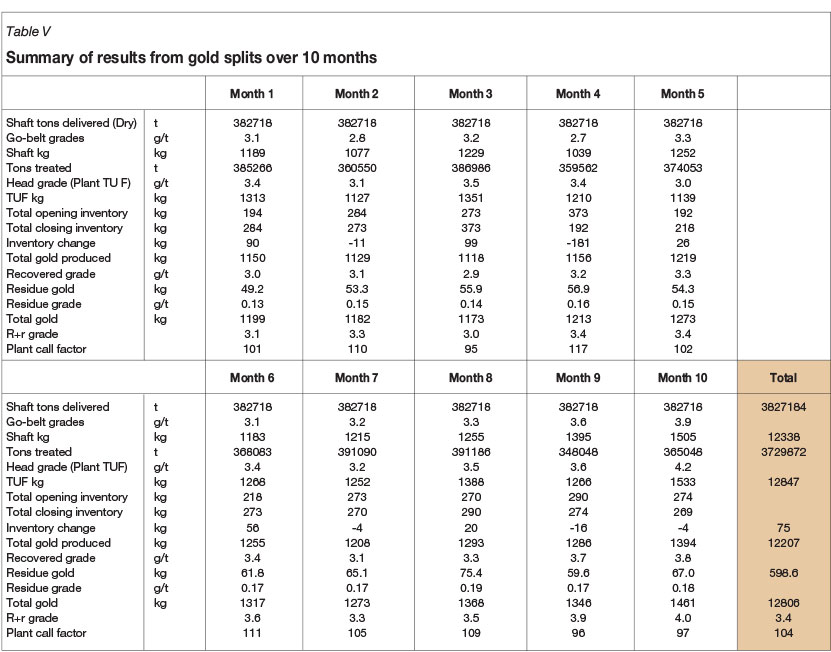
The plant call factor is the ratio of gold produced Au (R+r) and shaft Au , both of which are measured in kilograms. The gold split over 10 months is shown in Table V.
It can be seen from Figure 7 that there are wide differences between the go-belt, thickener underflow, and R+r grades over the first six months, but from month 7 there is closer agreement. This is most likely due to inventory changes from the delivery of ore to the plant to the production of gold in the plant. The inventory changes between deliveries from the shafts to treating the ore in the plant are not measured. The inventory changes in the plant itself, in the thickeners and the CIL plant, are estimated. Because of the inventory changes the comparisons between grades can only be done over a long period.
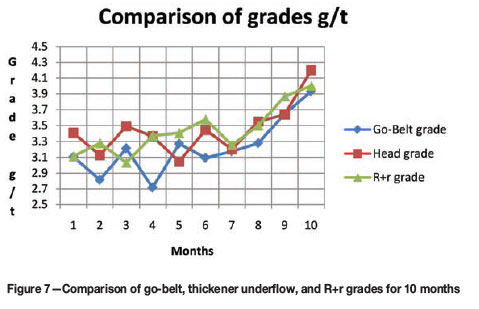
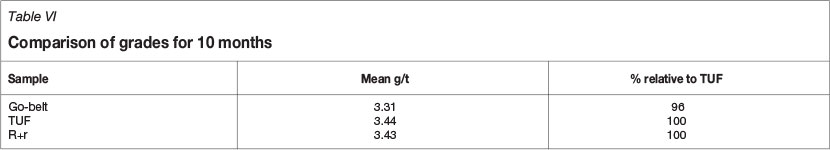
On the basis of this comparison over 10 months (Table VI), the R+r and TUF grades agree, with the R+r grade being slightly low.
The composite go-belt grades could be biased low relative to the TUF by 4%. However, it is known that gold accumulates behind the liners in large mills leading to a lockup as described by van der Merwe, Viljoen, and van Drunick (2005) for the AngloGold Ashanti Kopanang gold plant. The gold concentrate that is collected from the liners during mill relining is called 'mill gold' and, as shown by van der Merwe et al. and at other plants with large mills, contains significant amounts of gold. These mill concentrates are either treated internally by recycling or are sent to the Rand Refinery. Because of these lock-ups it is expected that the TUF grades should be lower than the go-belt grades and not the other way around as found for Harmony. The relatively low grade for the go-belt sampling may be related to the proportions of low-grade ore that are fed to the plant.
This requires investigation of the metallurgical balances, particularly in the plant, where the same percentage recovery has been assigned to the recovery from different shafts irrespective of the grade from the shafts. As increasing proportions of low-grade ore are fed to plant, to replace declining production from high-grade shafts, there could be a tendency for the gap between go-belt and plant grades to increase, possibly because of the metallurgical accounting procedures in the plant. These procedures should be reviewed following the principles in the Codes of Practice and statistical analyses as applied for the balances from shaft to plant.
Go-belt sampling for grade control
The go-belt sampling at the shaft head is the first point in the mining chain from stope to shaft head at which reliable samples are taken. Face sampling by chipping is known to be problematic, particularly where the hardness of the rock varies from hard, difficult-to-chip quartz to soft, gold-bearing carbon-rich ore that is preferentially collected in the face samples. In addition there is a proportion of materials from other sources which are not sampled. Consequently, comparisons of the survey called-for grades and the shaft head grades are not particularly useful.
The precision of a single go-belt sample is poor (RSD%= 30%), but with moving average grades the precisions improve and the results can be used to monitor the performance of a shaft.
Concluding remarks
The overall objective of measuring the mass and sampling the ore delivered at a shaft was to provide accurate data for metal accounting from shaft to gold recovery in the plant. Previously, the tonnage and grade at the shaft head were determined from survey returns, which rely on chip sampling of faces, volumetric measurement of tons of waste excavated, development ore, sweepings from old areas, and other sources, not all of which are sampled. The tonnage of ore delivered at the shaft is often estimated using the skip count and skip factors, which are subject to manipulation, and not all the skips are filled to the same level. Using this system for shaft grades and tons led to disputes involving shaft bonuses and questions over the profitability of individual shafts.
The challenges to achieving the objective were:
►Measurement of the mass of ore using a method that was stable and could be calibrated against known standards. This objective was met by weighing hoppers of ore using in-motion rail weight systems that are calibrated daily with standard hoppers and also undergo 6-monthly calibration. Wet mass is corrected to dry mass using measured moisture contents
►Sampling of run-of-mine ore. Run-of-mine ore has a particle size of up to 300 mm. Cross-belt samplers were developed to take samples from existing belts. Crossbelt samplers (go-belt samplers) can be retrofitted and are less expensive than cross-stream samplers. Also, cross-stream sample cutters can be damaged by the occasional large rock in the process stream. Sensors are in place for go-belt samplers to prevent the cutters operating when a large rock is detected. These go-belt samples have to undergo preparation procedures in order to obtain samples for analysis in the laboratory. Go-belt samplers have been installed on all the relevant belts. The design of go-belt samplers is simple and robust. Cross-belt samplers are inspected and maintained on a regular basis so that a full cut of the process stream is taken, since biases arising from sampling extraction errors are not acceptable
►Establishing metal accounting systems for the data from the mass and sampling measurements. The variance of single go-belt samples is high, mainly because of the large particle size. Large numbers of samples therefore have to be taken to make use of the averaging effect of large numbers. The data sets were handled using classical statistical techniques.
These objectives have been met, and the results of the grade and tonnage measurements have been used since 1993 in the gold split programme at Harmony for gold allocation, with acceptance by the stakeholders that the gold allocations are fair.
However, with possible increases of the proportion of low-grade ore fed to plants to replace declining production from high-grade sources, there could be a tendency for the gap between go-belt and plant grades to increase when using the current metallurgical accounting systems in the plant. This is the next challenge to be addressed by investigating metal balances in the plant using the Code of Practice for Metal Accounting and statistical analyses as have been applied to the balances from shaft to plant.
Acknowledgement
The comments by the referee, which broadened the emphasis of this paper from mine specific to industry-wide, are gratefully acknowledged.
References
AMIRA International. 2007. P754 Metal Accounting: Metal Accounting Code of Practice: Release 3 Feb. 2007. Melbourne, Australia. [ Links ]
Pitard, F. and Gy's, P. Sampling Theory and Sampling Practice CRC Press 1989. [ Links ]
Gy, P.M. 1982. Sampling 0f Particulate Materials.Theory and Practice.Elsevier Publishing Company. [ Links ]
Moore, D.S. and McCabe, P. 1998. Introduction to the Practice of Statistics.Freeman. [ Links ]
Pitard, F. and Gy's, P. 2000. Sampling Theory and Sampling Practice CRC Press 1989. [ Links ]
Quantifying Uncertainty in Analytical Chemistry. 2000. Editors S.L.R Ellison (UK), M.Roslein (Switzerland) A.Williams (UK). EURACHEM/CITAC Guide CG4. [ Links ]
Pitard, F. and Minnitt, R.C.A. 2009. The Sampling of Mineral Deposits.A Primer in Sampling Theory and Sampling Practice. [ Links ]
Francois-Bongarcon, D. and Gy's, P. The most common error in applying 'Gy's Formula' in the theory of sampling. Journal of SAIMM, vol. 102, Dec 2002. [ Links ]
Minnitt, R.C.A. and Assibey-Bonsu, W. 2009. A comparison between the duplicate series analysis and the heterogeneity test as methods for calculating Gy'ssampling constants, K and alpha. Fourth World Conference on Sampling & Blending. The Southern African Institute of Mining and Metallurgy. [ Links ]
Bartlett, H.E. and Viljoen, R. 2002. Variance relationships between the masses, grades and particle sizes of gold ores from the Witwatersrand. Journal of the Southern African Institute of Mining and Metallurgy, vol. 102, no. 8. pp. 491-500. [ Links ]
van der Merwe, M.F., Viljoen, J., and van Drunick, W.I. 2005. The economic benefits of minimized gold lock-up at AngloGold Ashanti Kopanang gold plant. Journal of the Southern African Institute of Mining and Metallurgy, vol. 105, no. 5. pp. 301-310. [ Links ] ♦

