


Services on Demand
Article
 English (pdf)
 Article in xml format
 Article references
Indicators

Related links
-
 Cited by Google
 -
 Similars in Google
Share

 Permalink
Journal of the Southern African Institute of Mining and Metallurgy
On-line version ISSN 2411-9717
Print version ISSN 2225-6253
J. S. Afr. Inst. Min. Metall. vol.114 n.1 Johannesburg Jan. 2014
SAMPLING AND ANALYSIS PAPERS
Sampling in the South African minerals industry
R.C.A. Minnitt
School of Mining Engineering, University of the Witwatersrand, Johannesburg, South Africa
SYNOPSIS
Although not fully accepted in South Africa, the Theory of Sampling originally proposed by Pierre Gy is fast becoming the cornerstone of sampling practice throughout the world. The growing acceptance of Gy's Theory of Sampling in South Africa can be attributed to a number of factors, chief amongst them being the development of a tradable mineral asset market, the promulgation of the Mineral and Petroleum Resources Development Act (MPRDA), the growing number of commercial and academic courses that are offered on sampling, and the regulation of the industry through internationally acceptable guidelines and rules for reporting and trading in mineral assets. The size of the South African minerals industry and the dependence of our economy on mineral production have also meant that correct sampling is of key importance to mineral trade. ISO standards have been the principal guides for producers of mineral bulk commodities who produce to customers' specifications, whereas Gy's insights have been most readily accepted by precious and base metals producers whose product is sold into metal markets. Understanding of small-scale variability is essential in the precious and base-metal industries, but detailed studies of the effects of heterogeneity have not been as productive in the bulk commodities. Sampling practices at different stages of mineral development from exploration, face sampling and grade control, ore processing and handling, metallurgical sub-sampling, point of sale sampling, and sampling in the laboratory are considered in the gold, platinum, ferrous metal, and coal industries. A summary of the impact of poor sampling in these industries is presented. Generally it appears that poor sampling practice is most likely to erode mineral asset value at the early stages of mineral development. The benefits of good sampling are considered, especially with regard to the financial implications of bias and error on large and consistent consignments of bulk commodities.
Keywords: theory of sampling, sampling errors, ISO standards.
Introduction
This paper provides a brief review of sampling issues covered in a more extensive consideration of the state of sampling practice in the South African minerals industry (Minnitt, 2010). The term 'sampling' here is taken to include all types of sampling in the minerals industry, from face or chip sampling of solid ore in mining operations, through cross-belt, cross-stream, or cross-ram sampling of streams of broken ore or slurry, sampling of cuttings from reverse circulation or blast-hole drilling, to the collection of dust and fine particulate products of drilling and rock cutting. The focus in dealing with sampling issues is to use the principles from the Theory of Sampling as a template against which to compare different sampling practices. The paper is not aimed at identifying either best or worst practice, but tries to present an impartial view of what sampling practices are prevalent in the gold, platinum, non-ferrous metals, ferrous metals, and coal industries. The focus is on sampling practice in South Africa, and where possible, to indicate the levels of compliance with the globally accepted principles of the Theory of Sampling as laid out by Gy (1979, 1982, 2003). It is clear that many practitioners, particularly in the bulk commodities trade (coal, iron ore, manganese, chrome, and vanadium), apply the principles of sound sampling practice through application of the ISO standards. These standards uphold all the principles of sampling as espoused in the Theory of Sampling, although they do not apply the terminology, such as the Delimitation Error, Extraction Error, Preparation Error and so forth, as prescribed in the Theory of Sampling. As the Theory of Sampling gains acceptance it is more than likely that the associated terminology will also be incorporated in the international mineral resources and reserves reporting codes and codes for metallurgical balance reporting.
A number of events in the preceding three decades of South African political, economic, and regulatory history have driven interest, awareness, and recognition of the importance of sampling in the minerals industry to the forefront of concerns. Firstly, the unbundling of mineral assets and the commercial activity in mineral asset markets in the early 1990s introduced a heightened awareness of mineral development valuations - all of which are reliant on sample values. Secondly, growing foreign control of South Africa's mineral assets also stimulated trade in mineral assets, and with that a necessary focus of attention on sampling and related issues. Thirdly, the promulgation of the Mineral and Petroleum Resources Development Act (Act 28 of 2002) (MPRDA) provided opportunities for historically disadvantaged entrepreneurs to invest in mining operations. A total of 25 867 applications for prospecting and exploration rights were received by the Department of Mineral Resources (DMR) since 2004 (Department of Mineral Resources, 2009). Due diligence studies and re-evaluation of many older operations meant that sampling took on a new importance. In the mid-1990s interest in sampling was stimulated as a result of a number of short courses presented by Geoff Lyman, Dominique François-Bongarçon, Francis Pitard, and more recently by Kim Esbensen. Most of these courses were presented through the Geostatistical Society of Southern Africa in the School of Mining Engineering, at the University of the Witwatersrand, although these consultants have also presented many in-house courses to private mining companies. In a number of cases this led to the identification of individuals who then took on the role of the sampling 'champion' for their companies, much to the benefit of company and individual. Finally it is probable that the single most important event to stimulate the strengthening of mineral industry-related institutions and with it an interest in sampling, particularly in countries with vibrant minerals industries, was the Bre-X affair in the late 1990s. This episode exposed weaknesses in these institutions' ability to rightly guide and control the reporting of mineral resources and reserves. This brought the processes of sample taking, quality assurance and quality control (QA/QC) practices, the creation of guidelines for fledgling codes, due diligence, and the critical role of the sample audit trail into sharp focus. The event also galvanized the already growing interest in sampling and Gy's Theory of Sampling in southern Africa and fomented an interest in the sampling-parallel topic of quality assurance and quality control (QA/QC) (Minnitt, 2010).
The checklist and guidelines in the South African Code for Reporting of Exploration Results, Mineral Resources and Mineral Reserves (SAMREC, 2007: Table I) for reporting relevant information and assessment criteria in public reports require that Mineral Resource and Mineral Reserve estimates be supported by disclosure of sampling methods, sample preparation, analyses, quality assurance and quality control, and the integrity of the database. The range of issues about the way sampling is undertaken and reported is wide. They include sampling method, sample collection, validation, capture and storage, sample preparation, and sample analysis (Table I, Sections T3.1 to T3.4), data capture and storage, validation and integrity, QA/QC practices, and policies affecting sample retention (Minnitt, 2010). Downstream, this affects the way in which listing companies disclose sampling techniques along lines set out in Section 12 of the Johannesburg Securities Exchange Listing Rules. A description of the nature and type of sampling, the precise location, unique numbering of each sample, and measures taken to ensure representivity must be reported. For all sample types, the nature, quality and appropriateness of the sample preparation techniques must be indicated, including quality control on all subsampling stages and measures taken to ensure that the sampling is representative of the in situ material collected. Requirements in regard to subsampling and non-core samples and their treatment are to be disclosed. Furthermore:
'A view must be expressed as to whether the sample sizes are appropriate for the grain size of the material being sampled. The results of selected intersections must be verified by both independent and alternative personnel, and the use of twinned holes, deflections or duplicate samples must be reported. With respect to assaying, the laboratory used and its accreditation with SANAS must be stated. Laboratories not yet accredited, should be able to demonstrate that their application for accreditation is not older than one year from the date of publication of the report. Accreditation, applicationfor accreditation, and/or rejection of accreditation by international standards, such as ISO 9000, must be disclosed. The nature, quality and appropriateness of the assaying and laboratory procedures, and whether the technique is considered partial or total, should be explained. The nature of quality control procedures adopted must be highlighted (e.g. standards, blanks, duplicates, external laboratory checks) including whether acceptable levels of accuracy (ie lack of bias) and precision have been established: (Minnitt, 2010, p. 2).
Reporting codes have enhanced the importance of sampling in the mineral industries even though the Theory of Sampling and Gy's formula for the Fundamental Sampling Error are not mentioned per se. While sampling practice and laboratory performance are consistently emphasised in both the SAMREC code and the JSE Listing Rules, scant attention is paid to the very important aspects of material characterization, large-scale variability in the plant, and the specifications and performance of sampling equipment, which are the main generators of sampling bias. This deficiency is in need of attention.
Economics of South Africa's minerals industry
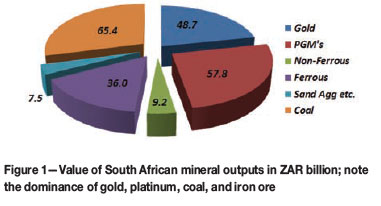
The Department of Mineral Resources (DMR) reports that research by Citigroup indicates South Africa's non-energy mineral reserves are worth $2.5 trillion, making her the world's richest country (Department of Mineral Resources, 2009, p. 7). The four most economically important products are gold, platinum, ferrous metals, and coal, and these are shown with their primary sales values for 2009 in Figure 1. South Africa accounts for 88 per cent of global platinum group metals (PGMs) reserves, 80 per cent of manganese, 72 per cent of chrome, 32 per cent of vanadium, and 13 per cent of gold. South Africa's exploration budget of R220 million in 2009 placed her 10th in line behind the big spenders, amounting to about 3 per cent of the global exploration budget (Department of Mineral Resources, 2009).
In 2009 South Africa's mining industry employed about 500 000 people or 2.9 per cent of the country's economically active population (Figure 2), and about 1120 jobs were provided through 112 new small, micro, and medium enterprises (SMME). Apart from the readjustment in 2008, Figure 2 also shows a steady increase in both local and foreign mineral sales, the latter increasing faster than the former.
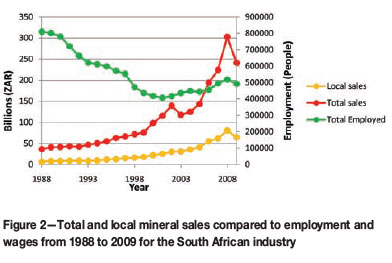
South Africa's mineral diversity and abundance is demonstrated by the fact that 53 different minerals were supplied from 1 548 mines and quarries to 80 countries in 2009. Gold was produced from 53 mines, platinum-group metals from 45 mines, non-ferrous metals from numerous mines, ferrous mineral ores were produced at 32 mines, coal from 108 mines, and diamonds from 395 mines, all as primary commodities and as value-added ferroalloys at 23 metallurgical works during 2009. Since 2003 there has been a steady increase in revenue from mining (Figure 2), but revenues from processed minerals in 2009 (R46.8 billion) were down almost 50 per cent on 2008.
These economic highlights simply emphasise the fact that South Africa's economy is deeply reliant on the mining industry. Even though it is seventh in line after manufacturing, electricity, financial services, tourism, communications, and construction as a contributor to national GDP, mining is still the economy's largest employer (Figure 2). Thus, despite a general lack of appreciation of its relevance and importance, sampling in the mining industry plays a major role in establishing mineral resource value and we do well to pay attention to it. Since sample values form the basis for many major financial decisions, the manifestation of sampling errors and bias can have considerable implications.
Theory of Sampling and the ISO standards
Pierre Gy's Theory of Sampling (ToS) (Gy, 1979, 1982, 1983, 2003) was the central subject at the First World Conference of Sampling and Blending (WCSB1) held in Denmark in 2003, entitled '50 years of Pierre Gy's Theory of Sampling'(Esbensen, 2003). Since then world conferences have been held every second year, with WCSB6 being planned for 2013 in Lima, Peru. Generally there seems to a separation between the applications of ISO standards and ToS in the minerals industry. ISO standards have been applied mainly in regard to the international trading of bulk commodities, while the ToS finds its most important applications in the precious and base metal sectors. The rise and popularity of ToS as a means of identifying, categorizing, and minimizing sampling errors has not overshadowed the importance of the ISO-linked methods and equipment that are embedded in the minerals industry. The ISO is in a strong position to incorporate and accommodate the benefits available through the ToS.
The sampling process aims at ensuring that a sample bears all the representative characteristics of the lot from which it was taken. Diversions from this goal arise during increment collection due to the characteristics of the material, the equipment used for increment extraction, the handling of increments after collection, and finally the analytical process itself. The combination of errors from these sources identified by Gy (1992, 2003) and Pitard, 1993) is termed the Total Sampling Error (TSE), shown in disaggregated form in Table I.
The sampling protocol along the lot-to-aliquot route is generally understood by process operators, but it is rare to see the total lot-to-aliquot process documented and displayed in such a way that it can be followed irrespective of the person involved. Each step in the protocol involves the application of tools or technology to particulate materials. The design and application of such sampling equipment must be implemented such that the principle of sampling correctness -'all fragments must have an equal probability (p) of being in the sample' - is upheld for each volume of observation at each step of the protocol. The incursion of bias due to the four errors DE, EE, WE, and PE can be avoided only if p is maintained when the lot is presented to the sampling equipment. Sampling equipment should not be selective either in terms of fragment size, shape, or density, and increment sizes must be proportional to the mass of the lot presented for sampling. Contamination, loss of mass, or chemical alteration of material increments during crushing, milling, screening, drying, filtering, and transportation between sample selection events, must be avoided (Pitard, 2009).
The defining framework within which the protocol is constructed is referred to as the sampling nomogram. This is a staggered series of comminution and mass reduction processes applied to the broken ore and designed so that changes in the variance of the FSE with changes in fragment size and increment mass can be followed. The nomogram is constructed so that the FSE should not exceed 10 per cent precision at any point along it. The two constants K and alpha (α) are determined through an experimental process of calibration for each specific ore type (Francois-Bongarçon and Gy, 2002a, 2002b). These values are then substituted into a modified version of Gy's formula and form the basis for compiling a nomogram.
The importance of the International Organization for Standardization (ISO) standards in providing stable guidelines for sampling prior to the widespread dissemination of the ToS is referred to by Minnitt (2010). This organization was established in 1947, at about the time that Pierre Gy began to develop the underlying concepts and ideas for the ToS. Although not restricted to the minerals industry, the ISO standards represent minimum requirements for product quality and provide definitions, terminology, and concepts for effective quality management in the trading of mineral commodities and products. According to Cook (2010) the main aim for the ISO is to facilitate trade by institutionalizing attitudes towards quality that are based on right policy, procedures, records, technologies, resources, and structures. The benefits to ISO-registered suppliers are product differentiation through superior quality products and a measure of customer loyalty because their expectations in regard to quality are being considered. The ISO provides carefully researched off-the-shelf standards for sampling-related issues in mining and quarrying (73.020), coals (73.040), metalliferous minerals and their concentrates (73.060), non-metalliferous minerals (73.080), and equipment for processing of minerals (73.120) (Minnitt, 2010).
The application of ISO standards also appears to rest on an important distinction between precious/base metals and bulk commodities. Generally, precious and base metals are sold into metal markets where prices are fixed through a number of different methods, but all are related to the balance between supply and demand. In addition, because precious and base metals can be produced to a 'five-nines' standard, there is very little in the way of product differentiation in the market place. For the bulk commodities, however, once a supplier-customer relationship has been established, linkages between producer and consumer are likely to be much stronger. The producers of ferrous metals, for example, produce to meet fairly inflexible customer specifications that are established before the product arrives at the port of destination. The ISO provides a valuable standard and basis against which international trading partners can measure product specifications.
Sampling at South Africa's mineral deposits
The economic significance of gold, platinum, ferrous metals, and coal (Figure 1) to South Africa's export earnings forms the basis on which the sampling practices in the industry were investigated. For each of the four principal mineral products the sampling procedures and processes during exploration, face sampling and grade control, ore processing and handling, and metallurgical subsampling of solids and slurries are considered in tabular form in the following sections. The influence and effect of the two main sampling errors, Fundamental Sampling Error (FSE) and the Grouping and Segregation Error (GSE), as well as the biases that arise due to the Delimitation, Extraction, Preparation, Weighting, and Analytical errors, are noted. The possible magnitude of each error or bias for the mineral product at each stage of sampling is estimated on a scale of one to ten and the sampling practices are graded in this way. While the impact of laboratory practices is shown in the tables, the issues of sampling in the laboratories for these minerals are dealt with elsewhere in this paper.
Sampling gold deposits
For more than 100 years the gold mining industry has applied itself to a variety of aspects of sampling, particularly face sampling, which are controlled by strict, documented protocols for sampling at all stages of gold production. The methods and reasons for good sampling, including health and safety measures are provided in detailed standard operating procedures (SOPs), or codes of practice, for example Internal underground chip sample standards (Flitton, Bernard, and Spangenberg, 2009). Monitoring of sampling sites, underground and on surface, during regular planned task observations (PTOs) by company sampling champions ensures that protocols, standards, and SOPs are adhered to. Most large mines have information management systems that verify data through checks and approvals (Minnitt, 2010). Details of sampling in gold mining operations are summarized in Table II.
Face sampling
The run-of-mine gold content and day-to-day economic viability of South African gold mining operations is maintained through a grade control process that relies on chip sampling of mineralized rock faces. Training for the practice and procedures for channel sampling of the stope faces for samplers and surveyors is provided as part of the Mine Surveyors Certificate of Competency (Department of Minerals and Energy), through technical colleges, the Chamber of Mines, and mining companies.
The sample mass, sample spacing, sample size, and the ratio of sample mass to the gross mass as the critical factors determining the representivity of samples were described by Storrar (1981). Various aspects of face sampling of the Witwatersrand-type gold reefs has been investigated by many (Watermeyer and Hoffenberg, 1932; Hoover, 1933; Beringer, 1938; Jackson, 1946; Truscott, 1947; Sichel, 1947a, 1947b; Harrison, 1952; Krige, 1952, 1964, 1966; Rowland and Sichel 1960; Whitten, 1966; Rowland, 1966; Storrar, 1981; Lerm, 1994) and are documented by Cawood (2004). Although these insights were not ordered in a structured taxonomy like that in the ToS, Cawood's (2004) study of the historical development of sampling practice on South African mines suggests that a complete spectrum of sampling errors equivalent to those that Gy identified were appreciated and accounted for in the principles underlying sampling practice.
The combination of error and bias is generally not as severe for the wider more homogenous reefs such as the Ventersdorp Contact Reef (VCR) and Main Reef (Brokken, 2010) as it is for the narrow composite reefs (Carbon Leader, Basal Reef, Vaal Reef). The latter reef types consist of a small pebble conglomerate 10-20 cm wide, with a carboniferousrich layer, between 0.1 cm and 2 cm wide, at the base of the reef. The carbon-rich layer may contain fly-speck or columnar carbon that makes this narrow unit much softer than the overlying quartz pebble conglomerates. The softer carbon-rich layer may contain up to 90 per cent of the gold mineralization and easily produces a 20 per cent oversampling, something that Sichel (1947) and later Harrison (1952) warned of. Even under ideal circumstances channel samples are defined only in two dimensions and owing to the hardness of the rock the most carefully delimited samples can never be fully extracted. Sample extraction using hammer and chisel is not acceptable, and generally the sampling process is dictated by what is possible in practice rather than the requirements of a prescribed sample mass. The common use of accumulation values (centimetre-grams per ton, cmg/t) means that different densities (e.g. Ventersdorp Contact Reef uses 2.71 g/cm3 whereas Carbon Leader and C Reef use 2,78 g/cm3) are applied to a reef width, rather than sample mass (Cawood, 2004).
Overstatement of sampling values is the principal contributing factor to apparent loss and low mine call factors on gold mines where narrow carbon-type reefs are mined. Attempts to use single- or multiple-blade diamond saws have made little difference to the overstatement of sampling values, and nondestructive radiation analysis in the stope face has not gained much acceptance (Lerm, 1994). 'Despite some small advances over the years, it is now nearly sixty years on and there is still no mechanized tool that can take the perfect sample at an even depth efficiently and economically (Cawood, 2004). Irrespective of how well samplers are trained, face sampling differs from one sampler to the next; even under the strictest supervision, uniform sample extraction is almost impossible (Lerm, 1994, Flitton, 2010, Minnitt, 2010).
Go-belt sampling
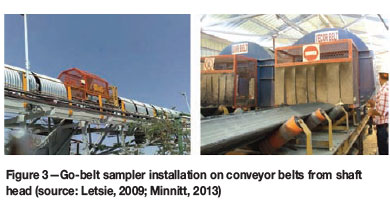
Although no studies have been reported, it is likely that a good proportion of the softer, carbon-rich gold ores are broken during the seven-fold handling from underground workings to the plant. Much of the contained gold will be liberated and either segregated or lost to the system. On surface the ore is fed from the tip to the go-belt, sampled using a cross-belt hammer sampler (Figure 4), and then stored in a silo from where it is fed to the plant. The ore skips are equipped with weightometers that provide a record of tons hoisted. In terms of sizing, the first constraint occurs as the ore is passed through the 30 cm x 30 cm grizzly, at the tip in the underground workings or on surface, before reaching the go-belt sampler.
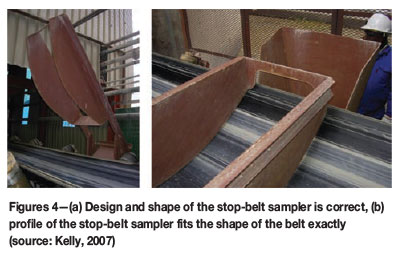
Typically the go-belt sampler is the first point at which both grade and tons are estimated in the reduction of gold ores. Some gold mining companies characterize their ores by means of heterogeneity tests, detailed deportment studies, and calibration of the sampling constants (K and α). Such studies provide the basic information for compiling an optimal sampling protocol that describes the changes in sampling variance as the mass of the samples is reduced as recorded in the sampling nomogram. Studies indicate that a composite sample collected at the go-belt should be 200 t to 500 t (Letsie, 2009). Variographic analysis of ore streams is an important step in minimizing large-scale cyclical variability due to process variations in the plant. Such insights from the daily go-belt samples provide guidance for the optimal size and timing of increment extraction, e.g. one 70 kg sample per 500 t of ore.
Go-belt samples provide an estimate of the total gold produced from each reef every month. The go-belt sampler is screened off to prevent either injury or interference with the collection of the ore (see Figure 3). The two main factors affecting representative sampling at the go-belt are sampling frequency and sample mass (Spangenberg, 2007). At some operations go-belt samplers are activated on a mass basis by a weightometer, such that a single 200 t increment is collected over a 24 hour period from 10 increments of about 20 kg each (Kelly, 2007). Generally, the increment mass for a representative composite sample should be determined from a heterogeneity study. Information from go-belt sampling is valuable if the results are used in a 'fit-for-purpose' manner. Unfortunately, the inability to reconcile the geostatistically evaluated call on gold from underground face sampling with what is found on the go-belt has meant that go-belt samplers have been decommissioned at several mining operations. However, the experience at Harmony Gold Mining Company is that RoM sampling can be used for monthly metal accounting to allocate production to different shafts, despite the high variance of go-belt sampling.
Moisture may affect the sample mass leading to a bias in the sampling results, particularly if the proportion of fines is high (Pitard, 2009, personal communication), but moisture is usually measured on samples taken specifically for the task rather than using material that is collected for assay purposes.
Waste stream sampling
Material sent to the waste dump is analysed on a regular basis using a stop-belt sampler consisting of a static steel frame that exactly matches the profile of the stopped conveyor belt. The frame is placed on a stopped belt, allowing the total increment to be easily removed from the belt together with all the fine material that accumulates at the bottom of the belt; the ideal situation is shown in Figure 4.
The nominal top size of the waste rock is 150 mm and the width of the cut is 50 cm, at least three times greater than the nominal top size. The opening through which the sample is delivered and collection chute are designed to minimize any spillage or loss of sample (Spangenberg, 2009).
Plant sampling
Sampling in the plant is used to ensure that in-plant processes as well as flow rates, pulp densities, and pH measurements are maintained within specifications. In contrast, sampling for recoveries and efficiencies of metallurgical balances ensures that gold entering and leaving the plant is accounted for.
In gold plants, pulp head feed to the thickeners (thickener overflow) is sampled using robust Vezin-type cross-stream samplers to produce a daily composite made up of sample increments collected every 15 minutes. Radial cutter blades on Vezin samplers (Figure 5a) are radial along the full length of the collector, but may accumulate a residue of pulp on the blades immediately adjacent to the portion that cuts the slurry stream. In some cases adequate and effective cleaning mechanisms have been installed as shown in Figure 5b.
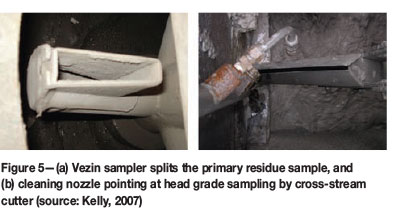
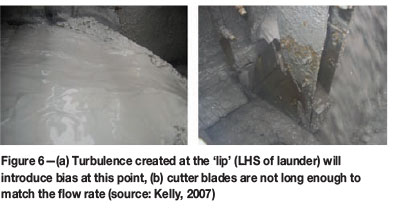
Turbulent flow of slurry along the edges of the launder at the thickener underflow (Figure 6a) may generate a bias as the cutter blades cross the stream at this point. Cross-stream slurry samplers may be installed where the flow rate in the launder is too high so that unbiased, representative samples cannot be collected. While the cutter blades for sampling device illustrated are not worn, the length of the blade is inadequate for the flow rate (Figure 6b, Kelly 2007).
Residue pulp samples collected in the plant (final tail sampler) are sent to the filter press and submitted for analysis. Training in the simple aspects of sample correctness and good sampling practice is essential if staff across the plant are to be sensitized to the importance of sampling. In any responsible position, untrained staff could potentially generate biases during sample preparation because of a poor understanding of the sampling processes involved.
Several samples are taken at different points in the elution stream, most of which are extracted manually. In the acid wash phase pH and Ca are determined before and after the wash and during loaded carbon lifting. Loaded, barren, and regenerated carbons are sampled by in-line carbon samplers during the transfer from the acid wash to the elution column, and during transfer from the elution column to the kiln feed bin. Solutions from the electrowinning feed and the barren electrolyte are sampled manually by an operator at the electrolyte drain valve. Smelthouse bullion and slag are manually sampled by drilling and increment collection by an operator. Waste products, including carbon, wood chips, and solids, are also sampled manually as required.
Sampling platinum group metals
The 2 060 million-year-old Bushveld Complex contains 68 per cent of the world's economically viable chromite reserves and 86% of all known platinum group metals. The Critical Zone hosts the Upper Group (UG) chromitite layers, among them the UG2 Chromitite Layer, which averages 1 m in thickness, carries economically important platinum group element (PGE) deposits. The uppermost unit of the Critical Zone carries the PGE-bearing Merensky Reef, a feldspathic pyroxenitic assemblage with associated thin chromitite layers that rarely exceeds 1 m in thickness. Apart from faults and dykes the Merensky Reef and UG2 Chromitite Layer are characterized by potholes - slightly sunken, circular features where lithological layers of economic significance are completely or partially absent, causing geological losses of up to 25 per cent. Chromitites of the UG2 Chromitite Layer typically consist of fine-grained (1-2 mm) chromite (>80 per cent) and interstitial feldspar (<20 per cent ), and accessory interstitial pyrrhotite and chalcopyrite. The platinum group minerals (PGEs) cooperite, braggite, sperrylite, and laurite are typically very fine-grained, and hosted within the base metal sulphides (Lomberg, 2009, Minnitt, 2010). A summary of the sampling issues in the platinum mining sector identified in this study is provided in Table III.
Exploration
Exploration borehole cores are treated with particular care in that they are the primary indicators to prospective investors of the value of the potential mineral development (Donlon, 2010). Borehole cores are split using a diamond saw and half-core samples 15-20 cm long are taken within the UG2 Chromitite Layer, with slighter longer samples (up to 30 cm) in the immediate hangingwall and footwall. Samples include approximately 2 cm of hangingwall or footwall, the same as in the gold mining industry. Samples are placed in a numbered bag, documented, and dispatched to the laboratory for analysis. The remaining split core is marked showing the relevant sample numbers is stored for future reference (Lomberg, 2009). Core samples, between 500 g and 600 g, are crushed to 70% -2 mm and milled to 85% -75 µm, and 30 g and 50 g aliquots assayed by fire assay using lead collection. PGE fire assays are undertaken locally, but Cu and Ni assays (XRF) are undertaken abroad. QA/QC controls ensure that PGE and base metal assay techniques are appropriate for mineral resource estimates, and that the assay techniques for recent drilling are compatible with the techniques used for the historic data.
A recent comparison of chip sampling against reef intersections in boreholes indicate that the chip samples return higher grades than the borehole intersections by 35 per cent on UG2 and 30-40 per cent on Merensky Reef (Mosholi, 2009).
Face sampling
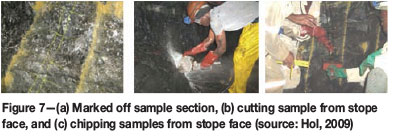
The similarity in dip, thickness, and stratiform nature of the reefs means that face sampling protocols for the platinum mines and Wits-type gold mines are similar. Underground chip sampling is undertaken for evaluation purposes on all stope faces and reef development ends (winzes and raises) at sampling intervals of 2-6 m. Sample positions are carefully marked off, using a chalk marker, as a channel perpendicular to the dip of the reef and across the full width of the reef (Figure 7a). The channel width of the sample is 20 cm, and the full width of the reef, hangingwall to footwall, is subdivided into 20 cm intervals. Sample borders are cut into the face along two vertical guide lines using a circular rock saw to a depth of approximately 4 cm; samples are then cut along horizontal lines (Figure 7b). A hammer and chisel are then used to chip, from the bottom upwards, about 500 g of rock from the face with the rock fragments being collected in a metal tray and transferred to a numbered sample bag (Figure 7c, Hol, 2009).
Sampling standards are maintained by careful training and regular auditing of samplers, because the likelihood of contamination and loss of material is high (Hol, 2009). Although the sampling is made easier using diamond saws to cut along the correctly delimited sample boundaries on the exposed rock face, traditional sampling using a hammer and chisel has been a preferred method since the opening of South Africa's precious metal mines in the late 1880s.
Go-belt sampling
The first sampling of ore on surface is by means of an automated cross-belt (hammer) sampler that is activated by a weightometer on a mass basis (Figure 8a and 8b). Although standard cross-belt cutters may meet all the necessary engineering specifications, one must accept that non-biased sample extraction is not possible with this device because the cross-belt cutter does not sweep close enough to the belt to ensure that all the fines are removed (Figure 8c).
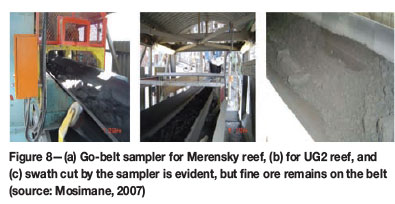
The fines invariably carry higher grades than the larger lumps of ore and the extraction of larger fragments in preference to smaller ones introduces a bias in the grade of the samples. Poor adjustment, sub-standard installation, or simple neglect may mean that the already-biased samples incur additional bias (Mosimane, 2007). Time-based increment extraction has the disadvantage that large amounts or very little ore may be on the belt at the instant the cutter is activated, and the efficiency and effectiveness of the device is questionable. The mass of some increments may be too small, giving rise to biased and inaccurate samples.
Plant sampling
Detailed mineralogical studies together with material characterization of the ores and precious metal assays provide the database for the compilation of sampling nomograms that allow one to minimize the FSE. Many such studies are conducted, as recovery from both the Merensky and UG2 reefs depend critically on comminution and liberation of the host sulphide minerals. Comminution protocols and sample preparation are very sensitive to grain size because the sulphides containing the PGEs are interstitial to the grains of the chromitite host. The UG2 Chromitite Layer breaks along grain boundaries and liberates the sulphides, which means that fines on a UG2 mine typically have twice or three times the in situ grade (Lomberg, 2007). The liberation of the precious metals is a function of the liberation of host sulphides, which in turn is a function of their grain size and the chromitite-sulphide grain structure. Samples with lower grades are more sensitive to the comminution protocol; this is particularly true of lower grade gold mineralization. Recoveries from the UG2 are lower than for the Merensky Reef because of the poorer metallurgical flotation performance of UG2 ores. UG2 flotation concentrates still contain entrained chromite; this in turn affects the metallurgical behaviour of UG2 concentrates in the downstream smelting process (Donlon, 2010).
Sampling departments at the larger mining operations have well-designed and rigorously enforced codes of sampling practice. Larger mining operations treat Merensky and UG2 reefs separately using conveyors to deliver Merensky and UG2 ore to their respective mills; smaller operations simply process a combined stream of ore. Milled products are sampled using a cross-belt hammer sampler to provide management with shaft-specific indicators of metallurgical balances and the effectiveness of grade control. Sampling of the UG2 and Merensky reefs are considered separately because of the large amount of by-product chromite associated with the UG2 reef. Types of samplers encountered in the plant at UG2 operations include automated cross-belt samplers (Figure 8a), as well as manual sampling of slurries, falling streams (chromite concentrate), and tailings. Typically the plant is designed to separate PGEs and chromite in UG2 ores by crushing and cleaning with heavy media separation. Particle sizing of the crushed ore is checked every 4 hours before it is milled; ore is acceptable if 75 per cent of a 3 kg sample passes -19 mm. Head grade and moisture are measured on an eight-hourly, 12-15 kg composite of increments taken by an automated cross-belt sampler.
At some mines spirals are used to separate the chromite and to produce a saleable metallurgical product. After primary crushing, ores being conveyed to the silos are sampled on an hourly basis using stop-belt methods. Increments are accumulated over an eight-hour shift into a 10-15 kg composite sample that is assayed for head grade and moisture. Chromitite ores pass through a primary mill followed by primary floatation that removes PGE-bearing sulphides. Chromite is removed and the material flow is subject to a secondary crushing followed by secondary floatation for PGE-bearing sulphides.
Milled Merensky ore is sent to a primary flotation plant where the ore is slurried with water and reagents. Once the waste material is removed, the floatation concentrate and the sinks (tailings) are sampled using a time-based cross-stream cutter and a continuous Vezin sampler. Installation of the equipment is done by the mine according to the manuals provided by the manufacturers, who will provide equipment guarantees only if they perform the inspection phase of the installation; training and manuals for the use and maintenance of the equipment are provided by manufacturers.
In summary, possible biases have been reduced by considering the feed size, the feed rate, mill capacity, SAG mill loading size, and the product size in the design phase of comminution circuits. In the design of flotation circuits the potential for sampling biases in slurries has been reduced by considering feed rates and grade, froth flows and grade, and the percentage solids. Spot checks for obvious defects, contamination, broken parts, and sample masses are performed at random on a daily basis by senior staff members who record their findings on a checklist.
Summary for platinum deposits
Consistent training and exposure to courses given by leading international experts over the past 15 years is bearing fruit as practitioners and manufacturers incorporate concepts from the ToS into plant designs and custom-built sampling equipment used in both Merensky and UG2 plants. To consolidate the advances in equipment manufacture, further process optimization in platinum plants requires sampling campaigns, mineralogical analysis, fractional analysis, data analysis, and feedback. However a lack of management buy-in, inappropriate flotation cell sizes, unstable feed characteristics, poor plant control, and skills shortage act as constraints on such developments (Naidoo, 2010).
The cross-belt, rather than cross stream, samplers are generally used on the run-of-mine ores before or after the primary crush. Such samplers are easy to retrofit, cheap to manufacture, and need no transfer point as for cross-stream sampling (Naidoo, 2010). Cross-belt samplers are adjusted to minimize the chance of damage to the conveyor belt while taking the best possible sample. Segregation of coarse and fine material occurs on conveyor belts during transportation of material over a large number of idlers before sampling (Robinson and Cleary, 2009). Consequently there tends to be an over-representation of coarser material from the top of the belt and the side of the belt nearest the sample chute, with a substantial amount of finer material left on the belt. Such samplers are not recommended (Lyman et al., 2009). Rotary and Vezin-type samplers generally have good extraction ratios and negligible bias under a range of operating conditions (Robinson and Cleary 2009) so their use at the plant is recommended.
The strongly biased nature of grab samples, as well as the ease with which a cross-stream sampler can be fitted at a transfer point on the conveyor from underground to stockpile, should preclude the use of grab sampling, especially to determine the head grade of feed to the plant (Lyman et al., 2009). These investigators also suggest that the stop-belt sampling creates undue strain on the belt, causing overloading of the belt, spillages, and overflow into the sample collected (Naidoo, 2010). In the same way the use of spigots and pipes to manually sample slurry streams in the chrome and tailings re-treatment plant should be replaced by a sampling mechanism that will introduce turbulent flow. This will break up the segregation that develops during laminar flow and allow a more representative sample to be taken (Robinson and Cleary, 2009). According to Naidoo (2010), test work has indicated that in the flotation cells, recovery decreases with higher density in the primary thickener underflow (Valenta, 2009). It is therefore important to keep a good check on densities, so the pitfalls in the current density measurement process (i.e. consistency of sample mass, possible dilution and contamination) can be avoided.
'Over the last few years the largest of South Africa's platinum producers has improved its evaluation processes through implementing strict corporate governance and Best Sampling Practice. The 'Home and Away Sampling' strategy allowed samples to be analysed at the Sender and Receiver sites, and was convenient due to the geographic distribution of plants in the eastern Bushveld Complex. However as the operations expanded, maintaining sampling quality and sample throughput was threatened, so that single-point sampling and analysis in an ISO17025 accredited laboratory was introduced. This facility was then upgraded knowing that 'the best defence against sampling bias is correctly designed mechanical sampling.
'Sampling protocols that define stages of comminution and mass reduction, minimising and eliminating dust losses, and monitoring of quality control parameters, for different material streams have been introduced. Improved QA/QC for sample preparation procedures, improved audit trails, and electronic transfer of data became essential as the number of samples to be processed has increased. Electronic management of sampling protocols, sample bar coding, audit trails, process variation, and statistical process control are now standard procedures. New mechanical equipment (the Variable Split Sample Divider) has been successfully designed and developed to replace manual methods for compositing weighted samples. Optimisation of the mass determination as well as correct sampling of concentrate slurries has reduced operational cost significantly...
'...The likelihood of serious introduction of bias in the analytical stages of sampling has been minimised ... by the installation of completely robotic systems that eliminate human handling and intervention from the time the sample is submitted to the time the grade appears as a figure on the report document: (Minnitt, 2010).
Sampling ferrous metals
Manganese deposits
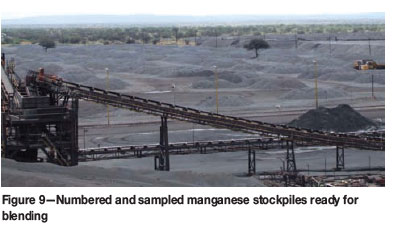
The Kalahari Manganese Field in the Northern Cape Province hosts the stratiform manganese beds that occur in the banded ironstone sediments of the Hotazel Formation in the lowermost Postmasburg Group at the base of the Transvaal Supergroup. Of the three sub-horizontal manganese beds, only the lowermost (Mn1) is currently mined at Nchwaning Mine. However, numerous small mining operations have entered the market and are extracting ores from other units. Experience has shown that of the 6 m thick beds, only a more or less central 3.5 m mining cut in the lowermost unit provides the optimal grade and recovery. The ISO 9000 standards for manganese sampling are strictly applied during the stacking and reclamation of numbered, sized, and sampled stockpiles that are about 300 t (Figure 9).
The ores being stockpiled are sampled using automatic cross-stream samplers to collect mass-based increments. Inspection of the cross-stream samplers indicated that they obey the principles of correct sampling as per CSIRO (2000) requirements. Each sample of a stockpile consists of 10 increments of between 150 kg and 170 kg to give a composite sample of between 1.5 t and 1.7 t per stockpile (stack); the sampling rate here is 0.64 per cent. This allows extremely accurate grade control for all shipments from the mine. The average size distribution for the manganese ores is shown in Table IV. Products are typically split into lumpy (9-75 mm) and fines (<9 mm) (Assmang, 2010).
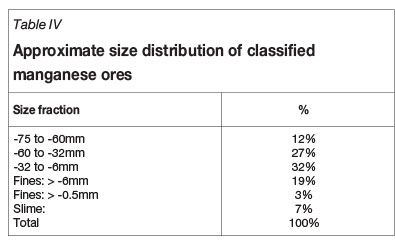
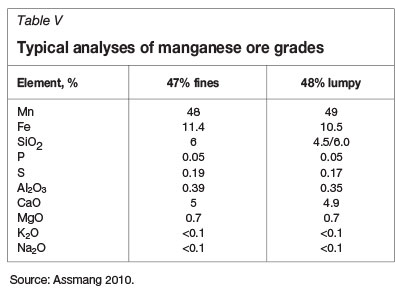
Typical analyses of the fines and lumpy manganese ores are listed in Table V.
A summary of the main issues in regard to sampling in the ferrous metals industries, taken here to be represented by iron and manganese, is presented in Table VI.
All exploration holes, 36mm BQ core, are drilled vertically to intersect the three sub-horizontal manganese layers. Core from all three seams is split, logged, and sampled at 50 cm intervals so that the best 3.5 m composite section can be identified. In-mine grade control is done by profiling of the orebody for manganese and iron by marking off samples in a 30 cm wide vertical channel across the face. The channel is divided into 30 x 30 cm blocks, the sample mass collected for every 30x30 cm block being about 200-300 g. This means that every mining cut (about 1300 t of ore) is covered by 12-15 samples with an average mass of 5 kg.
In the metallurgical plant the ore is crushed, washed, and screened to various sizes and then is stacked according to size and grade. Processes in the plant are strictly controlled using the ISO9000 standards for manganese sampling. The run-of-mine ores are crushed to -150 mm, and are then further crushed in a secondary crusher to -75 mm. A detailed flow sheet of the process indicates that there are four main products, namely -75 to 60 mm, -60 to 32 mm, -32 to 6mm, and the fine-grained product, i.e., -6 mm fines. These sized, sampled products are stockpiled in numbered 280--320 t stacks (Figure 9), built by compositing ten loads of 25 t each delivered by truck to the pile.
Sampling tower
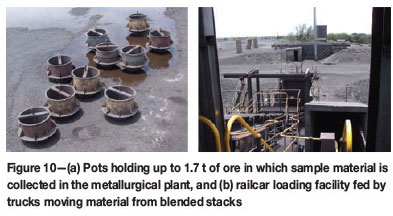
The samples taken during creation of the stockpiles and loading of the railcars are collected in sampling pots, each holding up to 2 t of material (Figure 10a). Composite samples from the stockpiles (1.5-1.7 t) and from the railcars (1.2 t) are taken to the sampling tower, where they are reduced in size and mass to a manageable size of about 200 g that is sent to the analytical laboratory.
Samples arriving at the sampling tower are split 17 per cent and 83 per cent by mass in a vertical splitter and the smaller fraction is subjected to a size analysis using a series of screens. The larger fraction (83 per cent) is then hoisted to the top of the tower again and fed through the sampling tower to reduce both size and mass, and about 200 g of pulverized sample is sent to the laboratory for XRF and wet chemical analysis. It is difficult to follow exactly what the size-mass reduction processes in a typical sampling tower are. The sampling towers are usually aged and there is no certainty that equipment on the floors between the top and bottom of the towers is functioning as it should.
Loading station
The ores are loaded to open railcars via a loading station (Figure 10b). Each railcar hold approximately 63 t of ore, with two samples being collected every five railcars loaded. This means that there are 10 increments of approximately 120 kg each, collected to give a composite sample of 1.2 t representing 315 t of ore shipped. The sampling rate is 0.38 per cent; the ores are primarily shipped through Port Elizabeth (Minnitt, 2010).
Iron ore deposits
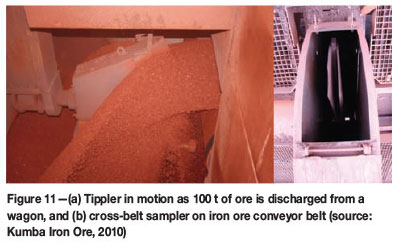
South Africa's iron-rich sediments of the Transvaal Supergroup occur in the Northern Cape Province, adjacent to the massive Kalahari Manganese Field, and in Thabazimbi in Limpopo Province. South Africa's main producers deliver about 38 Mt/a from these mining operations (Mbendi, 2010). The ores consist of laminated haematite ore and a conglomerate ore. These originated through a combination of primary and secondary haematization producing orebodies that range is grade from 50 per cent to 68 per cent Fe. Approximately 37.1 Mt per annum is railed to Saldanha Bay, from where about 82 per cent is exported and the remainder used locally. Export volumes have increased annually and reached nearly 53 Mt of iron ore in 2012, with projections that the total port exports will be 60Mt in 2012. Discharge at the port is done in a dual line using a tippler (Figure 11b). Iron ore is stockpiled in designated beds as it arrives at the port and is sampled using a radial arm sampler in a sampling tower en route to the vessel for loading (Minnitt, 2010).
Exploration and grade control sampling
Extensions to the orebodies are explored with diamond drilling at 50 m intervals and reverse circulation infill drilling at 25 m centres. Detailed geological mapping of benches and mining faces as well as drillhole information provides the basis for outlining the orebody. Information for geological orebody domaining, modelling, mine planning, and production is provided by in-pit grade control drilling on a 25 m x 25 m grid to a depth of 40 m, and percussion drilling to 12 m. Analysis of data allows a grade distribution block model providing a geometallurgically cost-efficient pit layout and quality control on ores delivered to the plant. Blast-hole sampling provides the basis for classification of the ore types as pure ore (58-67.5 per cent Fe), ore (50-58 per cent Fe), and low-density material (26-50 per cent Fe) (Nel, 2010). The grade of the blended iron ore products is initially controlled during the open pit mining operation by demarcating suitable run-of-mine ores for the primary crusher. Both the beneficiation properties of the ores and the content of iron and silica, together with the deleterious element (K, P, S, and Al) content (Minnie, 2010, Minnitt, 2010) which are Kumba Iron Ore specific names (Nel, 2010).
Producing and blending an acceptable product of 64 per cent Fe at 25 mm or 64.5 per cent Fe at 70 mm takes place in the pit at the time of mining. The iron ore quality from different mining faces (sites) is combined to indicate the required proportion of ore from each face so that an acceptable product can be blended. The initial production is fed to the so-called Taster Plant to test the beneficiation characteristics of the RoM product, and the information is supplied to the DMS plant where necessary changes are made to enable planning of the blending beds. A 45 000 t bed is stacked in two hours, so rapid turnaround time on sample information is essential (Minnitt, 2010).
Sampling in the plant
Early determination of quality and composition of stockpiled ore is compiled to produce an inventory of ores prior to their dispatch to the plant for sizing and beneficiation. Lower grade ores are washed by dense medium separation or jigging to remove diluting contaminants. The final products are sampled on a time basis by cross-belt samplers (Figure 10b) installed on all final product conveyors. The cross-belt hammer samplers and the cross-stream cutter samplers are of the highest quality and performance. Unfortunately, the sampling is done on a time rather than a mass basis, which may introduce significant bias to the results. It has been suggested that the sampling revert to mass-based collection of increments (Minnitt, 2010). Samples are split 18:82 for sizing and chemical analysis. Size distribution of samples is determined using a range of screens with apertures from 70 mm to 4 mm (Minnitt, 2010).
The process for sample handling is a robust, well-designed system. Approximately 45 samples per day, made up of sample increments collected in adequately sized, electronically identifiable steel pots, are collected in the metallurgical plant. Geoscan on-line analysers run 24/7 to provide a very good result for iron ores that have been washed and screened (Minnitt, 2010).
Sampling of blending beds
Blending beds of 100 000 t to 200 000 t are built on a chevron arrangement and are sampled exactly according to ISO chemical and sizing specifications every 2 hours as the ore is stacked. Thus an accurate total composition of the bed is reported to the plant quality control division. The fact that iron ore is produced to strict customer specifications means the ability to build, reclaim, and control stockpile compositions is essential. Cumulative qualities using weighted averages (analyses weighted with tonnages produced) for each blending bed are used to meet customer specifications. The consistency of bed blending and product quality is determined during reclamation of the beds. Sampling of the ore during loading of all railcars (34 200 t) allows each car to be matched with the bed specifications. The ore is then transported and stockpiled at the Saldanha port loading facility (Minnitt, 2010).
Sampling tower
Samples collected in specially designed steel pots at sampling stations throughout the plant report to a dedicated sampling tower where both sizing and XRF analysis are undertaken. The sampling tower is a recent and robust addition to the mine's capacity to monitor and control the iron ore products. The mechanisms are largely automated and allow minimal human intervention in the processes. Preparation for chemical analysis consists of four consecutive crushing and splitting stages to obtain a particle size smaller than 0.5 mm. Compressed powder pellets are prepared from 150 g of pulverized ore for a combination of wet chemical and XRF analysis (Fe, Al2O3, SiO2, K2O, P, and S). There is very little in the way of QA/QC, and although duplicate samples are taken it is rare that duplicate analyses are made. There is nothing in the way of application of certified reference materials, duplicate analyses, or blanks in the analytical process.
Port loading facilities
Manganese ore is exported through Port Elizabeth ore terminal where it arrives by rail after a 30 h 1100 km journey from Hotazel. In the marshalling yard railcar loads of manganese ore are split on the basis of grade and conveyed either directly to the ship or to the stacker-reclaimers where stockpiles up to 460 000 t can be built. When required, the reclaimers are positioned alongside the required grades and extract the ore from the stockpiles and the ships are loaded.
For iron ores a calculated loading grade for the 200 000 t vessel, against which the invoice is issued, is derived from sampling that takes place as the vessel is loaded (Figure 12a), and this value is reconciled back to the original blending bed value at the mine. Four stacker-reclaimers manage the stockpiles (Figure 12b) with a capacity of 4.8 Mt; the facility is capable of stacking seven different product types.
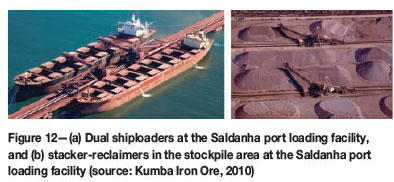
Stockpiles are reclaimed at 8 000 t/h and the product is delivered to the quay on two conveyors, where dual ship-loaders can load up to 16 000 t/h. The new sampling facility provides continuous sampling of iron ore streams being loaded to vessels.
Sampling coal deposits
The most extensive and currently productive coalfields occur in the Witbank-Secunda-Carolina area, but the importance of these fields will be eclipsed by the production anticipated from the Waterberg coal deposits in the next five to ten years. In terms of its global position South Africa is ranked fifth for exports (60.5 Mt), sixth for reserves (30 408 Mt), and seventh for production (250.6 Mt), in 2009 (Department of Mineral Resources, 2011). The country hosts 7.4 per cent of the world's total coal reserves. Of the total coal production South Africa consumes 75 per cent locally and exports about 25 per cent. The 18 operating coal-fired power stations owned by Eskom absorb about 65 per cent of the domestic consumption to produce 240 300 GWh annually (Department of Mineral Resources, 2010).
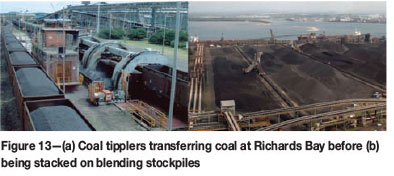
Total run-of-mine production increased to 317.3 Mt in 2009, but saleable coal production fell to 250.6 Mt under depressed European markets. The depressed demand from Europe means that the 50 per cent of South African coal exports that Europe accepted until 2009 is currently being sold off to eastern markets, with current prices (February, 2013) being around R85 per ton. Total sales value for coal declined 12.6 per cent, with 75.3 per cent being sold locally, while the remaining 24.7 per cent was exported. Coals are beneficiated to export quality, low-ash metallurgical, and steam coal and exported through Richards Bay (Figure 13a and b; Department of Mineral Resources, 2011).
Sampling procedures for coal vary considerably depending on what the analyses are to be used for, which may include technical evaluation, process control, and quality control for international trade. 'Sampling of coal forms an integral part of the coal production route, yet it is often a misunderstood and underrated activity on collieries. It is a vital aspect of ascertaining that the coal provided to the customer is of the correct quality. Since large amounts of money change hands based on results of samples, it is vitally important that the activity of sampling be made unambiguous and regulated - especially in the case of international trade' (De Korte, 2005).
Intersections of coal seams in diamond drill core during exploration for new coalfields are analysed for calorific value and washability. Bulk samples of coal are extracted as rectangular blocks from the full seam thickness. At Richards Bay commercial consignments of coal are checked for quality as they move along conveyor belts towards the stockpiles. Results from 'stopped belt' sampling are compared with automated mechanical sampling devices during bias testing. The choice of mechanical or manual sampling from moving conveyor belts, stockpiles, or stationary wagons depends on the accessibility of the lot. ISO 13909 (2001) and 18383 (2005) standards provide the protocols for representative sampling by different methods, and are extensively applied in South Africa. Sellers and purchasers may jointly modify the sampling methods depending on costs and technical constraints (Minnitt, 2010). A summary of the sampling issues faced by coal producers and sellers is provided in Table VII.
Application of international standards
Most coal quality parameters are determined using ISO or ASTM standards. These are deeply embedded in the coal industry, and while the concepts are virtually identical the terminology and description of errors, such as the Delimitation Error, Extraction Error, and Weighting Error as used in the ToS are not used. However, a statement of the basic principles of coal sampling by Johns (2010) suggests that there is considerable agreement between ISO and the ToS. General sampling, coal preparation, and bias testing, mechanical sampling, and sample preparation are covered in ISO 1988-1975 and ISO 13909-2001. Manual sampling, sampling of stationary and moving streams, and sample preparation are covered in ISO 18283-2005. According to the ISO standards the number of increments and minimum mass of increments per composite depends on the coal size. Johns (2010) provided some additional recommendations in regard to coal sampling that require cutters on sampling equipment to be at least three times the nominal top size of the coarsest fragment, that cutter capacity should be sufficient to hold the entire increment, and that the cutter velocity must be less than 0.6 m/s (Minnitt, 2010).
Sampling at the open pit mine and port
The primary source of information for a new coal development or extension is the exploration drilling. Very specific sampling protocols govern the way in which such samples are collected and the core is treated before, during, and after sampling. This information is the basis for a feasibility study that includes a layout of the minable orebody and there is generally no further in situ sampling of the coal. Once production commences the coal is reduced to -300 mm in the primary crusher and delivered via conveyors to the silos or stockpiles. A secondary and tertiary crush reduces the coal to -120 mm and to -32 mm or less, respectively. The coal is sampled on a daily basis during the building of the on-site stockpiles to monitor the quality of production. There may be two or three sites in the open cut from which coal is produced. The coal is reclaimed from the stockpile and the -32 mm to -0.5 mm coal is deslimed by removing the -0.5 mm material. The 0.5-32 mm product is then beneficiated in heavy medium cyclones. After washing (removal of high-density rock and inertite) the upgraded product is again sampled as the stockpiles are built, mainly with respect to sizing, but percentage ash and calorific value are also taken into account. Coal from these stockpiles is then loaded on trains destined for Richards Bay Coal Terminal (RBCT). At Richards Bay the South African Bureau of Standards (SABS) samples the coal on an hourly basis-using automatic samplers at two transfer points, before the coal is loaded and when the coal is being loaded into the ship (Johns, 2010).
The procedure for coal sampling requires firstly that the coal quality parameters to be analysed be defined. The range of variables includes calorific value (CV), percentage ash, moisture, volatiles, sulphur, phosphorus, ash fusion temperature, Hardgrove index, etc. The lot and its dimensions should be defined, together with the required overall precision on the analytical results. This should include a determination or an assumption about the variability of the coal and the variance associated with preparation and testing. A choice as to the use of continuous or intermittent sampling methods and equipment, as well as the method of combining increments into composite samples, should be made. The number of sub-lots, the number of increments per sub-lot required to attain the desired precision, and the minimum average increment mass must be determined. A decision as to the sampling intervals and whether time- or mass-based increments will be extracted must be stated. The nominal top size of the coal and the resulting minimum mass of sample must be ascertained.
Continuous sampling extracts a prescribed number of increments from every sub-lot. In the case of manual sampling a relatively large number of increments must be taken, spread evenly over the whole lot. The average value of a cargo can be established with reasonable accuracy if sufficient samples are taken. Each sub-lot should be approximately the same size; however, for practical reasons sometimes sub-lots of different sizes are used. The estimated mean should have the correct precision. Intermittent sampling is used by agreement between contracting parties when frequently sampled coal has demonstrated a consistency in type and quality. In such cases intermittent increments may be collected from some of the sub-lots, but not from others, but the same minimum number of increments should be taken from every sub-lot that is sampled. Sub-lots for sampling should be chosen at random, except if systematic choice of sub-lots is demonstrated to be bias-free. If the variation between sub-lots is too large, it may be necessary to introduce continuous sampling to achieve the desired precision (Johns, 2010).
Design of the sampling scheme
Written sampling instructions strictly based on the ASTM or ISO standards are issued to sampling operators by supervisors once the data requirements and the design of a sampling scheme have been reviewed. The material to be sampled, the overall precision of results, the division of lots, the basis of sampling, the bias of results, and the requirements for test samples must be documented in the instruction. Coal stockpiles at the mine site are reclaimed and loaded on trains destined for RBCT. On arrival the coal is discharged at the train tippler and is sampled at the in-going sampling site before it is stockpiled in 68 Mt lots. The stockpile is reclaimed and again sampled at the out-going site on its way to the vessel. The South African Bureau of Standards (SABS) is the sampling authority at RBCT, sampling the coal on an hourly basis using automatic hammer-type cross-belt samplers that are activated on a mass basis (Johns, 2010).
On-line coal analysis
Prompt gamma neutron activation analysis (PGNAA) technology has undergone extensive tests over a long period of time, and has faced strong opposition from those with interests in maintaining the existing quality control systems. In 1999 Eskom appointed the CSIR to evaluate the results of an initial test. The results indicated a better and more representative analysis, the primary sample reduction being about 1:120 with the scanner and 1:2 x 10¹⁰ in the laboratory. The insight that at least 80 per cent of the sampling error arises during the sampling event (even if sampling is done properly) provides strong motivation for installation of the on-line scanners, and since 2000 Coalscan has been used for tariff purposes for moisture, CV, volatiles, and ash (Johns, 2010). The advantages of the in-line scanner are that it has no vested interest in the result, it requires no training, it has no learning curve, it provides real-time data for process control, it warns immediately of out-of-specification coal supply to power stations, and it has performed well in regard to tariff purposes. The main disadvantage is that there is no contingency plan for when the analyser is out of action (Moodley and Minnitt, 2009).
Benefits of good sampling
The benefits of good sampling are difficult to quantify, but there are numerous examples of the costs and losses, in some cases amounting to millions of dollars, incurred by companies when good sampling practice is compromised (Carrasco et al., 2004; Carrasco, 2008; Johns 2010; Pitard, 2009; Tice, 2013). Poor sampling practice will influence outcomes, evaluations, estimations, and bottom line cash flows from the earliest stages of mineral exploitation and extraction. For example, Carrasco (2008) records losses of US$156 million over a ten-year period at a copper mine in Chile when the grade of tailings was not properly ascertained. The introduction of errors and bias as a result of poor sampling practice is probably the main reason for failure to reconcile material flows and balances when trying to account for the metal that is finally produced. This especially true for precious- and base-metal deposits where the metal produced is the outcome of what should be a closed circuit in which all the inputs - a known tonnage of ore with a known grade, and the outputs -a known mass of tailings at a certain grade, are matched. Persuading managers to spend the money to rectify the problems, even when they are clearly identified, can be challenging. Only when errors and bias are translated into monetary terms are managers able to identify with them (Minnitt, 2010).
The possibility of eroding value from a ferrous metal operation occurs in the early stages of exploration, extraction, and grade control. At current metal prices a grade control blast-hole evaluates a block of ground that is potentially worth R140 000. If samples from such blast-holes are biased or unrepresentative and if 50 such holes are drilled per day the overall revenue at risk could be substantial. During the evaluation stage the likelihood that a high-grade block (say 64.5 per cent Fe) could be classified as a low-grade block (say 62.5 per cent Fe) could mean that the opportunity to use the high-grade block as a sweetener for a number of lower grade blocks is lost. In some cases the difference in grade on which a decision as to how a particular block should be utilized is based could be as low as 0.5 per cent. Where mining projects are in the process of expansion, newly installed capacity has to be filled by increased production, and the larger tonnages are likely to come at slightly lower grades and increased overall cost. Economies of scale and new technologies should keep the mine profitable, but the lower grades mean that accuracy and precision, especially in the vicinity of cut-off grades, must be carefully guarded.
For gold and base metal mining operations, better metal prices mean that ores with lower grades can be profitably mined, but this also means that the limits on accuracy and precision near the much lower cut-off grades is crucial, especially as the workable limits of detection are approached. Where selective mining is used the effects of sampling error and bias can be especially severe (Minnitt, 2010).
Bulk commodities - chrome, iron ore, and manganese -are produced to customer specifications that are generally quite rigidly controlled, with payments for contained metal based on the current price and penalties for out-of-specifi-cation sizing. Pricing for chromite varies between R580 per ton for 34-37 per cent Cr2O3, and R720 per ton for 37-42 per cent Cr2O3 so the difference in price of R150 per ton is based on a 1 per cent difference in grade. At the margin a 3000 t stockpile could be at risk for R450 000 if the analysis is incorrect. Penalties of about 30 per cent are payable for out-of -spec lots below 70 mm, so a lot selling for R500 000 could incur penalties of R150 000 (Minnitt, 2010).
Suppliers of manganese and iron ore usually settle within 0.5 per cent around the specified grade, usually 46 per cent for Mn and 64 per cent for Fe. However, at the margins the 0.5 per cent difference can amount to R150 000 for a 40 000 t manganese consignment and R160 500 for a 150 000 t iron ore consignment. The gain or loss within the 1 per cent range of variability around the specification limits could be to the supplier as well as the customer. On 50 such transactions in a year the revenue at risk would be around R12 million for manganese and R240 million for iron ore. As mentioned by Minnitt (2010), the question is: how easy is it to make such losses?
'The back-of-the-envelope calculation by CSIRO (2000) provides some insight. If during loading of the vessel a 2t composite sample is taken from the stream, a single 70 mm particle weighing about 140g is 0.00007 as a fraction of the composite. So the larger particles are underrepresented by less than one part in 10 000. If the average grade of a large particle is 0.5 per cent Mn higher than the average for the entire stream of ore, a single particle failing to enter the sample cutter would cause a bias of this grade difference (0.5 per cent Mn), times the proportion by which large particles were under represented or 0.5 per cent Mn x 0.00007 = 0.000035 per cent Mn. In order to make this up to 0.1 per cent you only need 0.1/0.00004 = 2500 particles or a loss of about 350 kg of material. Since lost material simply re-joins the stream of material one would never know about it: (Minnitt, 2010, p. 16).
The value of maintaining good mechanical and sampling integrity for coal mining operations was described by Long (2000). A modified example by Minnitt (2010) demonstrated that an increase in moisture of 0.25 per cent or eight cents per ton does not sound like a lot. However, this translates into R8000 on a monthly sale of 100 000 t. The example illustrates that poor sampling could equally favour the supplier or the buyer, and that there is potentially great value in maintaining good sampling integrity.
Conclusions
The events of the past three decades have promoted awareness of the importance of correct sampling techniques and equipment. Managers are taking note of the potential and hidden costs associated with poor sampling and rather than retrofitting, which has had to take place in some cases, new mineral processing plants are being designed with state-of-the-art sampling equipment.
A summary of the main sampling errors at each of the main stages of mineral development, from exploration to point of sale, for the four main commodities examined here is shown in Table VIII. The table is necessarily subjective, but nevertheless shows some broad and interesting results. The table suggests that the most vulnerable stage in the development of mineral projects is early, during initial feasibility and pre-feasibility studies. This is also true for operating mines where the effects of unrepresentative sampling could potentially put huge revenues at risk. For the bulk commodities the revenue at risk is large for out-of-specification product, but generally the standard deviations around the specified grades are less than 0.25 per cent.
Generally, the risks to project value due to poor sampling tend to be lower in the laboratory. The introduction of QA/QC measures using blanks, duplicates, and standard reference materials means that problems in the laboratory are identified reasonably early, can be monitored, and are usually addressed swiftly. As a general point there is a possibility that the value of ferrous metals industry projects could be more severely affected by errors and bias in all stages of mineral developments compared to other mineral commodities.
The importance of sampling in the minerals industries is being acknowledged more and more, and the human and financial resources needed to ensure good sampling takes place at mining operations are being applied by the industry at large. Corporate culture is changing, and in most mining operations those who have been ready to take on the role of champion for the cause of sampling within companies have emerged.
It is also evident that the ToS has supplied a framework within which the different aspects of sampling across the minerals industries can be captured. In the precious and base metal industries an understanding of the small-scale variability, the Fundamental Sampling Error, and the Grouping and Segregation Error is crucial in compiling a meaningful nomogram and establishing a usable protocol. As one moves towards the bulk commodities - the ferrous metals and coal - the need for such detailed studies becomes less important. Instead the use of ISO standards has proved to be sufficient, although the principles of ToS are not to be violated in any part of the minerals industry. The fact that grades in precious and base metal deposits are usually lognormally distributed, while the variables of interest in the bulk commodities are normal or negatively skewed, also tends to affect the impact and influence of sampling errors. Other aspects that emerged in the 2010 study (Minnitt, 2010) include the fact that precious metal deposits tend to be overvalued (Krige, 1994), while bulk commodities tend to be undervalued at the grade control stages. In the metallurgical plants, however, it is the precious metals that are undervalued and the bulk commodities that are overvalued.
In general, the finer-grained portions of precious and base metal material tend to contain the higher grades, whereas the coarser fragments in the bulk commodities tend to have the higher grades. Bulk commodities require relatively little in the way of beneficiation to bring them to saleable products according to customer specifications, whereas precious and base metals require many and costly steps in order to concentrate and recover the metals.
Acknowledgements
The original research for this paper was carried out in 2009, and the contributors have all been thanked in an earlier publication. However it would be wrong not to thank the people who helped me again in the compilation of this paper. Numerous individuals assisted in arranging mine and port visits and provided input from different sources. Special thanks are due to Marie Nel for organizing the visits to Sishen Iron Ore Mine and the port loading facility at Saldanha Bay, and Panna Loubscher and Lionel for their help at the Saldanha loading facility. Jonathan Wolfe (African Rainbow Minerals) arranged visits to the Black Rock manganese and Khumani iron ore mines. Sakkie van der Merwe, Pierre Du Plessis, and Andre Fulhard all provided input at the Khumani iron ore mine. The assistance of Magda Klindt, Gerhard Botha, Ben Ruziwe, and Danny Maluleka, at Black Rock Mine operations is acknowledged. Patricia Tennant (Assore) and Chris Minnie (Kumba) provided valuable insights into the marketing of ores. Conne Spangenberg and Tarryn Flitton (Anglogold Ashanti) assisted in gathering information for the section on gold sampling. Bob Lavery provided guidance and input in regard to the sampling in Wits-type gold deposits. Special thanks are due to Coert Kruger and Erika van Tonder (Anglo Platinum) who provided exceptional input and contributions for the platinum section. Patrick Donlon (Wardrop Consulting) is thanked for reading and editing portions of the manuscript. Alan Johns (Witlab), Cecilia Barbosa (Inspectorate), Gerhard Esterhuizen (Coalserve), Fanie Botha, and Ricky Pinhero provided assistance with the section on coal. Dr Geoff Visser made a significant contribution in regard to ISO standards applications. The danger with thanking people individually is that I am bound to have inadvertently omitted someone; in which case please forgive the oversight.
References
Beringer, B. 1938. Underground Practice in Mining. 2nd edn. Mining Publications Ltd, London. 277 pp. [ Links ]
Cawood, F.T. 2003. Underground face sampling on narrow gold reefs: sampling practice and its impact on the mine call factor on Witwatersrand gold mines - lessons learnt. Journal of the Institute of Mine Surveyors of South Africa, vol. XXXI, no. 7. pp. 202-224. [ Links ]
CARRASSCO, P. 2008. Some key facts and concepts in the evolution of sampling and assaying practices at Codelco. Proceedings of Sampling 2008. Australasian Institute of Mining and Metallurgy, Melbourne. pp. 3-8. [ Links ]
Carrasco, P., Carrasco, P., and Jara, E. 2004. The economic impact of correct sampling and analysis practices in the copper mining industry. Proceedings of the First World Conference on Sampling and Blending. Chemometrics and Intelligent Laboratory Systems, vol. 74. pp. 209-213. [ Links ]
Cook, C.D. 2010. What is ISO 9001 and why is it important to my organisation? http://www.entrepreneur.com/tradejournals/article/109569568.html [ Links ]
De Korte, G.J. 2005. Sampling in the coal industry, environmental, mining, metallurgical engineering. Operating and Developing Coal Mines in the Republic of South Africa. Department of Mineral Resources, Pretoria. Directory D2/2009. [ Links ]
Department of Mineral Resources. 2009. South Africa's Mineral Industry 2007/2008. Department of Mineral Resources, Directorate: Mineral Economics, Pretoria. 207 pp. [ Links ]
Department of Mineral Resources. 2011. South Africa's Mineral Industry 2009/2010. Department of Mineral Resources, Directorate: Mineral Economics, Pretoria. [ Links ]
Esbensen, K.H. 2003. 50 years of Pierre Gy's "Theory of Sampling"-WCSB1: a tribute. Aalborg University Esbjerg, Denmark. [ Links ]
Flitton, T.M. 2009. Structural problems at sample stations from the face to the ingot. Assignment in partial fulfilment of the GDE course in Sampling Theory and Practice, School of Mining Engineering, University of the Witwatersrand. 16 pp. [ Links ]
Flitton, T.M. Barnard, A.C., and Spangenberg, I.C. 2009. Proposal for an investigation into the current sampling methodology and the testing of a new sampling method at Kopanang mine. Internal report REP2009 1020. AnglogoldAshanti. [ Links ]
FRANÇOIS-BONGARÇON, D. and Gy, P. 2002a. The most common error in applying 'Gy's Formula' in the theory of mineral sampling, and the history of the liberation factor. Journal of the South African Institute of Mining and Metallurgy, November/December 2002. pp. 475-480. [ Links ]
FRANÇOIS-BONGARÇON, D. and Gy, P. 2002b. Critical aspects of sampling in mills and plants: a guide to understanding sampling audits. Journal of the South African Institute of Mining and Metallurgy, November/December 2002. pp 481-484. [ Links ]
Gy, P.M. 1964. Variography. International Symposium of Applied Statistics, Golden, Colorado, USA, April 1964. Colorado School of Mines Quarterly, vol. 59. pp. 693-711. [ Links ]
Gy, P.M. 1967. L'Echantillonage des Minerais en Vrac (Sampling of Particulate Materials). vol. 1. Revue de l'Industrie Minerale, St. Etienne, France. Numero special (special issue), 15 January 1967. [ Links ]
Gy, P.M. 1979 and 1983. Sampling of Particulate Materials, Theory and Practice. Developments in Geomathematics 4. Elsevier Scientific, Amsterdam. [ Links ]
Gy, P. 1982. Sampling of Particulate Materials: Theory and Practice. 2nd edn. Elsevier, Amsterdam. [ Links ]
Gy, P.M. 1988. Heterogeneite - Echantillonnage - Homogeneisation: Ensemble coherent de theories. Masson Editeur, Paris. [ Links ]
Gy, P. 2003. Sampling of discrete materials - a new introduction to the theory of sampling. I. Qualitative approach. Chemometrics and Intelligent Laboratory Systems, vol. 74. pp. 7-24. [ Links ]
Harrison, R.N. 1952. Comment on the mine call factor. Journal of the Institute of Mine Surveyors of South Africa. pp. 102-104. [ Links ]
Hol, K. 2009. Sampling protocol at Northam Platinum Limited. Assignment in partial fulfilment of the Mineral Resource Management Project on Sampling Theory and Methods, School of Mining Engineering, University of the Witwatersrand. 10 pp. [ Links ]
Hoover, T.J. 1933. The Economics of Mining. Stanford University Press, California. 547 pp. [ Links ]
Jackson, J.O. 1946. Mine Valuation: Rand Practice. Louis Gordon Booksellers. 155 pp. [ Links ]
Jooste, R, 2007. Audit of sample preparation at a laboratory. An assignment completed in partial fulfilment for the postgraduate course on Sampling Theory and Methods (MINN7061). School of Mining Engineering, University of the Witwatersrand. 13 pp. [ Links ]
Kelly, S.M. 2008. Audit Plant Sampling. Assignment for the course MINN 7061, Modern Sampling Theory and Methods. Assignment completed in partial fulfilment of the Masters in Engineering, School of Mining Engineering, University of the Witwatersrand, Johannesburg. 9 pp. [ Links ]
KRIGE, D.G. 1952. A statistical approach to some basic mine valuation problems in the Witwatersrand. Journal of the Chemical, Metallurgical and Mining Society of South Africa. pp. 201-215. [ Links ]
Krige, D.G. 1964. A review of the impact of statistics on mine valuation in the gold mining industry. Journal of the South African Institute of Mining and Metallurgy, vol. 2, no. 2. pp. 373-380. [ Links ]
KRIGE, D.G. 1966. Two-dimensional weighted moving average trend surfaces for ore valuation. Symposium on Mathematical Statistics and Computer Applications in Ore Valuation. Southern African Institute of Mining and Metallurgy, Johannesburg. pp. 373-380. [ Links ]
KRIGE, D.G. 1994. A statistical approach to some basic mine valuation problems on the Witwatersrand. Journal of the South African Institute of Mining and Metallurgy, vol. 1, no. 1. pp. 95-111. [ Links ]
Lerm, C. 1994. Evaluation of chip sampling vs the gold analyser. Journal of the Institute of Mine Surveyors of South Africa, vol. XXVII, no. 5. pp. 77-87. [ Links ]
Lomberg, K.G. 2007. Sampling theory and methods; Construction and use of a nomogram. Assignment completed in partial fulfilment of the postgraduate course on Sampling Theory and Methods (MINN7061). School of Mining Engineering, University of the Witwatersrand. 20 pp. [ Links ]
LONG, A.M. 2000. Maintaining coal sampling systems - managing objectives with limited resources. National Weighing and Sampling Association. http://www.nwsassn.org/files/pg3_amm.pdf [ Links ]
Lyman, G., Nel, M., Steinhaus, R., and Bartlett, H.E. 2009. Bias testing of cross belt samplers. Proceedings of the Fourth World Conference on Sampling and Blending. Southern African Institute of Mining and Metallurgy, Johannesburg. pp. 183-192. [ Links ]
MBENDI. 2010. Iron ore mining in South Africa - overview. http://www.mbendi.com/indy/ming/iron/af/sa/p0005.htm#5 [Accessed 22 January 2010]. [ Links ]
Minnitt, R.C.A. 2010. The state of sampling practice in the South African minerals industry. Sampling 2010, Perth, 11-12 May 2010. Australasian Institute of Mining and Metallurgy, WA. 20 pp. [ Links ]
MOSHOLI, T. 2009. Sampling at the Crocodile River mine. Assignment completed in partial fulfilment of the postgraduate course on Sampling Theory and Methods (MINN7061), School of Mining Engineering, University of the Witwatersrand. 21 pp. [ Links ]
Naidoo, P. 2009. Sampling theory - identification of structural and circumstantial problems in the process sampling of a platinum group metal concentrator plant. Report in completion of the MINN7061 course of the Graduate Diploma in Engineering, School of Mining Engineering, University of the Witwatersrand. 25 pp. [ Links ]
Pinheiro, H.J. 2010. Coal quality requirements for the metallurgical industries, principles of coal selection, acquisition and substitution, and coal classification for marketing purposes. Presented to the postgraduate course in Coal Utilization, University of the Witwatersrand, 19 February 2010. [ Links ]
Pitard, F. 1993. Pierre Gy's Sampling Theory and Sampling Practice.2nd edn. CRC Press, Boca Raton, Florida. [ Links ]
Pitard, F.F. 1993. Exploration of the nugget effect. Geostatisticsfor the Next Century: An International Forum in Honour of Michel David's Contribution to Geostatistics. Dimitrakopoulos, R. and David, M. (eds). Kluwer Academic Publishers, Boston. [ Links ]
PITARD, F. 2004. New sampling technologies for ore grade control, Metallurgical accounting, and laboratory preparation. Metallurgical Plant Design and Operations Strategies 2004, Perth. Australasian Institute of Mining and Metallurgy. [ Links ]
PITARD, F.F. 2009. Theoretical, practical and economic difficulties in sampling for trace constituents. Proceedings of the Fourth World conference on Sampling and Blending. Southern African Institute of Mining and Metallurgy, Johannesburg. pp. 3-12. [ Links ]
ROBINSON, G.K. 2005. Economic justification for capital expenditure on sampling and blending. Proceedings of the Second World Conference on Sampling and Blending. Australasian Institute of Mining and Metallurgy, Melbourne. pp. 111-120. [ Links ]
Robinson, G.K. and Cleary, P.W. 2009. Should we aim for 'zero bias' or merely for 'acceptable bias'? Proceedings of the Fourth World conference on Sampling and Blending. Southern African Institute of Mining and Metallurgy, Johannesburg. pp. 195-202. [ Links ]
ROWLAND, R. ST J. 1966. Broken ore sampling. Symposium on Mathematical Statistics and Computer Applications in Ore Valuation. South African Institute of Mining and Metallurgy, Johannesburg. pp. 324-326. [ Links ]
Rowland, R. St J. and Sichel, H.S. 1960. Statistical quality control of routine underground sampling. Journal of the South African Institute of Mining and Metallurgy, vol. 60. pp. 251-284. [ Links ]
Sichel, H.S. 1947a. Mine valuation and maximum likelihood. MSc dissertation, University of the Witwatersrand. 21 pp, [ Links ]
Sichel, H.S. 1947b. An experimental and theoretical investigation of bias error in mine sampling with special reference to narrow gold reefs. Transactions of the Institute of Mining and Metallurgy, vol. 56. p. 403. [ Links ]
SPANGENBERG, I.C. 2007. A standard for broken ore, plant head, and residue sampling in a typical gold mine. Proceedings of the Third World Conference on Sampling and Blending, Porto Alegre, Brazil, 23-25 October 2007. pp 282-327. [ Links ]
SPANGENBERG, I.C. 2009. Audit on plant sampling: Kopanang gold plant and east gold acid and float plant, broken ore sampling: Kopanang mine and assay: Vaal River Chemical Laboratory. Internal report, Anglogold Ashanti. [ Links ]
Storrar, C.D. 1981. South African Mine Valuation. Chamber of Mines of South Africa, Johannesburg. 470 pp. [ Links ]
TICE, B. 2013. Screening for a sticky situation, aggregates and road building, http://www.rocktoroad.com/content/view/1339/67/ [Accessed 22 February 2013]. [ Links ]
Truscott, S.J. 1947a. Mine Economics. 2nd edn. Mining Publications Ltd, London. 366 pp. [ Links ]
Visser, G. 2010. Personal communication. International Organization for Standardization (ISO), South Africa. [ Links ]
Whitten, T.E.H. 1966. The general linear equation in prediction of gold content in Witwatersrand rocks. Symposium on Mathematical Statistics and Computer Applications in Ore Valuation. Southern African Institute of Mining and Metallurgy, Johannesburg. pp. 124-141. [ Links ]
Wills, B.A. 1979. Mineral Processing Technology.1st edn. Pergamon Press. [ Links ]
Wilke, A.V., Carrasco, P.C., and Cortes, M.G. 2009. Evolution of the estimation of the metallurgical balance. Fourth World conference on Sampling and Blending. Southern African Institute of Mining and Metallurgy, Johannesburg. pp. 53-62. [ Links ]


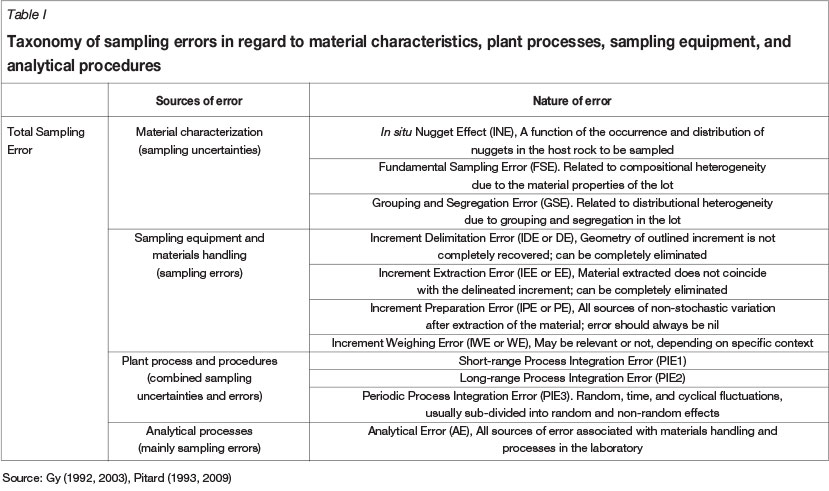
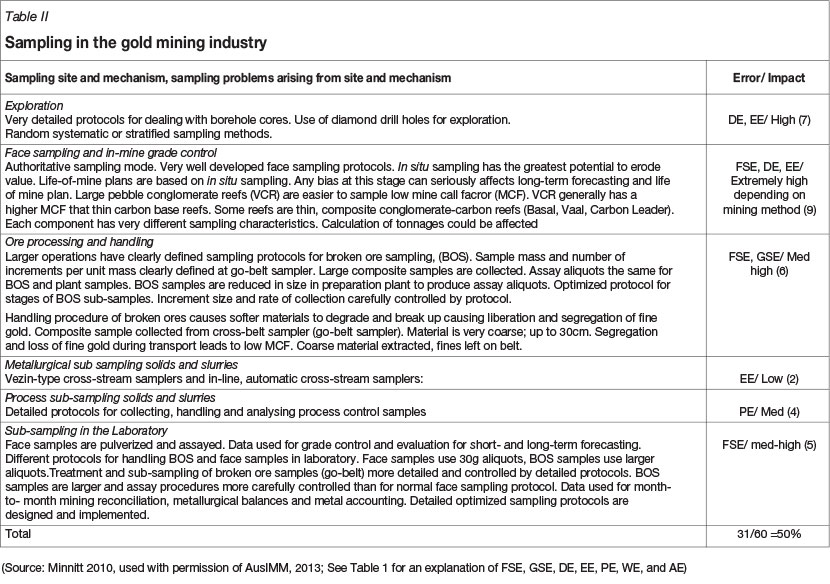
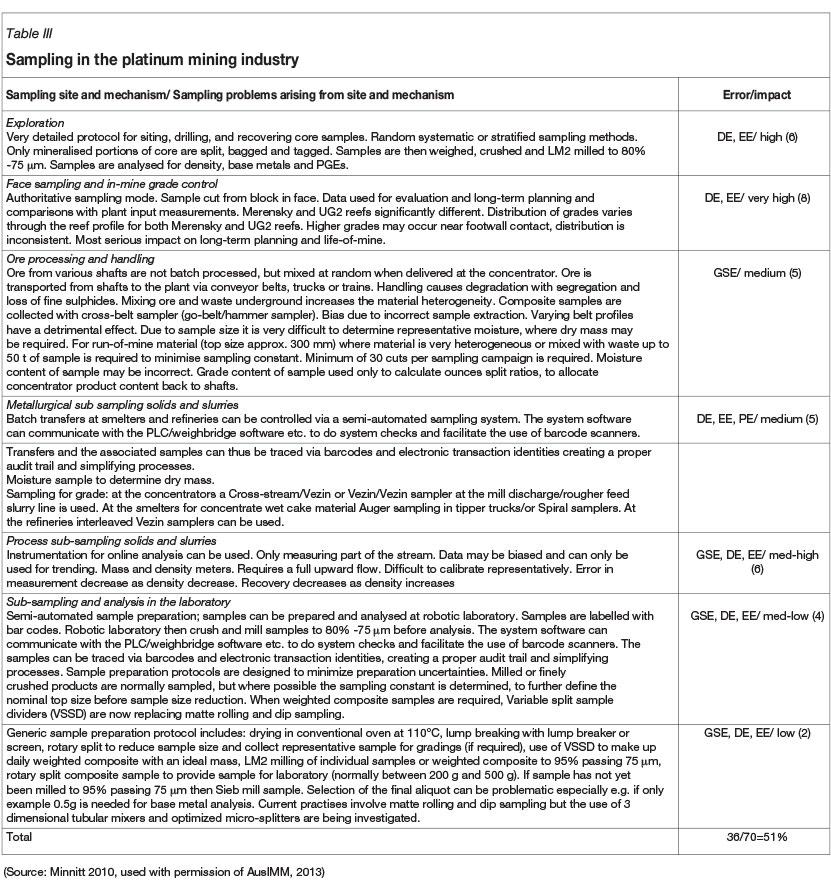
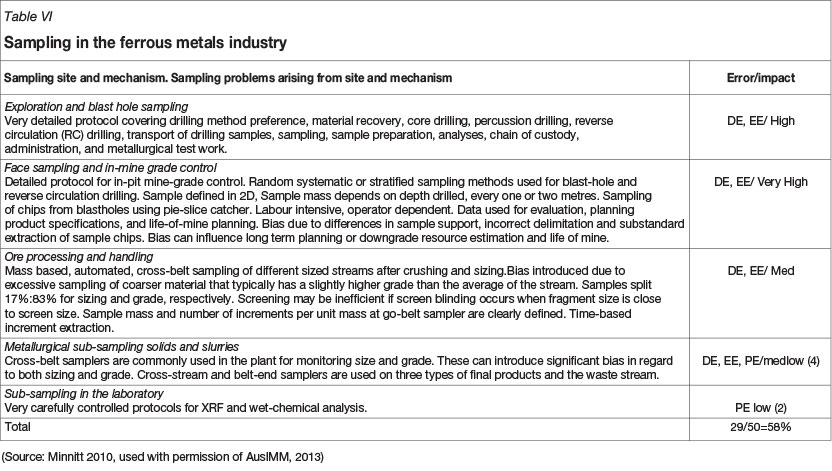
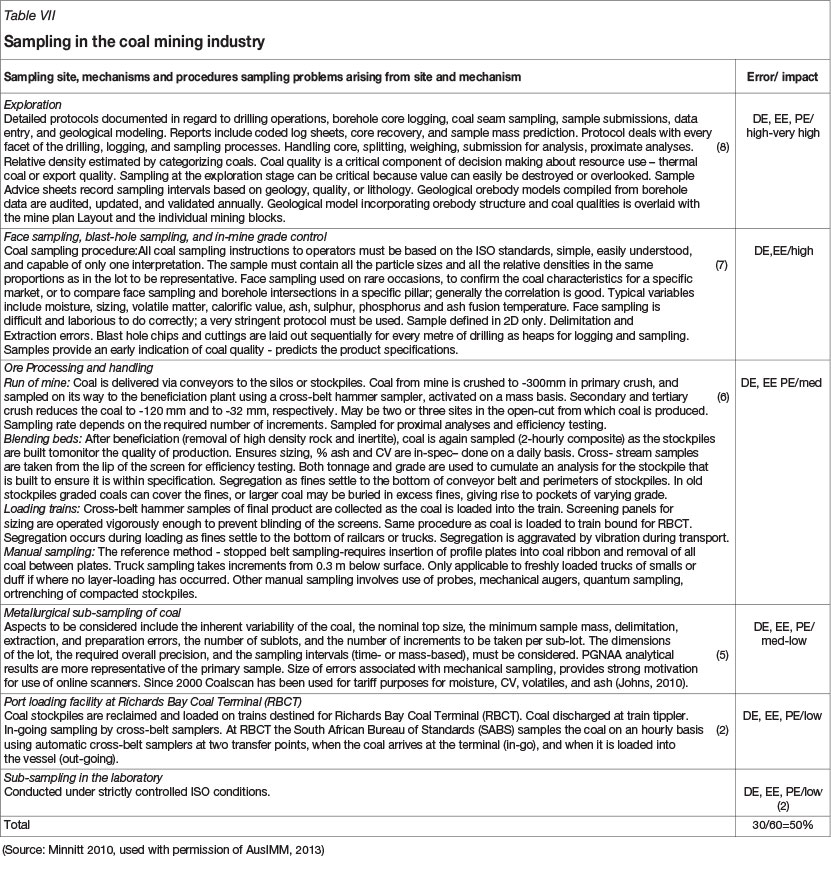
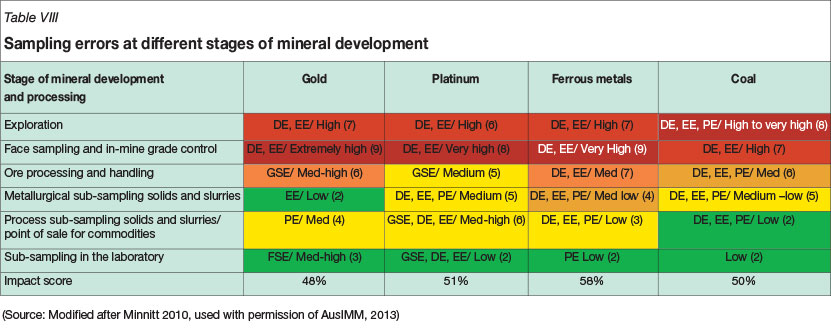