


Services on Demand
Article
 English (pdf)
 Article in xml format
 Article references
Indicators

Related links
-
 Cited by Google
 -
 Similars in Google
Share

 Permalink
Journal of the Southern African Institute of Mining and Metallurgy
On-line version ISSN 2411-9717
Print version ISSN 2225-6253
J. S. Afr. Inst. Min. Metall. vol.114 n.1 Johannesburg Jan. 2014
SAMPLING AND ANALYSIS PAPERS
Best practice sampling methods, assay techniques, and quality control with reference to the platinum group elements (PGEs)
K. Lomberg
Coffey Mining SA Pty Ltd
SYNOPSIS
In this paper the process of sampling and assaying as it relates in particular to the platinum group elements (PGEs) is presented. A discussion of the geology of PGE deposits is included to provide an understanding of the mineralization that is considered necessary prior to sampling, as this has a direct bearing on the mineral resource estimate and also the selection of an appropriate mining cut. The discussion includes the selection of the sampling technique (drilling or face sampling), the size of the sample relating to the requirements of the laboratory, the potential mining cut, as well as a reference to sampling theory. The selection of an assay technique that is appropriate and will yield the optimal result based on sample turnaround, precision, accuracy, and cost is then considered. Examples are drawn from work undertaken on the Bushveld Complex (Merensky Reef, UG2 Chromitite Layer, Platreef) and Great Dyke (Main Sulphide Zone). A discussion of the appropriate QA/QC programme includes the chain of custody, CRM selection and the QA/QC process.
Keywords: sampling, assaying, QA/QC, platinum group elements.
Introduction
The exploration and exploitation of platinum group element (PGE) deposits is extremely challenging due to the very low ore grades, which can approach the detection limits of the assay techniques, as well as factors such as the significant nugget effect. This emphasizes the need for a good understanding of the geology of the deposits and the reef mineralization in order to choose appropriate exploration techniques, and the application of industry standard sampling and assay techniques when developing these projects or mines.
The foundation of mineral resource estimation is a geological model and valid data. The data that form the basis of an estimate includes geological logs, borehole collar positions, downhole surveys, and assay data. Where underground data is utilized, face sampling data would be used and would have the same characteristics as drilling data i.e. position of the cut, the associated geology, and the assay data. The data is interpreted and used to develop a geological model. The raw data is examined, various statistical analysis undertaken to understand it, and possible relationships between the assay data and the geology considered before being incorporated into a mineral resource estimation. This estimate relies on the well-established understanding of the geology and the recognition of the economic horizons, continuity of the mineralization, controls on the mineralization, and ore genesis.
A mineral resource estimate for a PGE deposit has many aspects in common with other deposits, but also has its own unique aspects. Notably the estimate relies on the determination of a mineralization zone or mining cut because the grade is dispersed vertically across a number of horizontally stacked stratigraphic units and lithologies. Thus the determination of the marginal grade cut-off and the optimization of the mining cut must be considered in the light of 'the realistic expectation of eventual economic extraction' (SAMREC, 2009). This constitutes an integral step towards the mineral resource estimate and is informed by the methodology and protocol of the sampling. Inappropriate sampling could produce a poor mineral resource estimate result.
Introduction to the geology of PGE deposits of southern Africa
PGE-dominated deposits occur in large layered intrusions, such as the Bushveld Complex (South Africa), the Stillwater Complex (USA), and the Great Dyke (Zimbabwe).
Bushveld Complex
The mafic rocks of the Critical Zone of the Bushveld Complex host layers rich in PGEs, chromium, and vanadium, and constitute the world's largest known resource of these metals. The Merensky Reef, which is developed near the top of the Critical Zone (Figure 1), can be traced along strike for 280 km and is estimated to contain 60 000 t of PGEs to a depth of 1 200 m below surface. The pyroxenitic Platreef mineralization north of Mokopane contains a wide zone of more disseminated style platinum mineralization, along with higher grades of nickel and copper than those occuring in the rest of the Bushveld Complex.
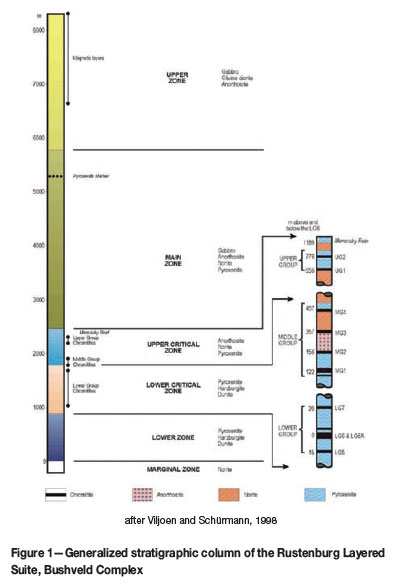
The Critical Zone also hosts all the chromitite layers of the Bushveld Complex, up to 14 of which have been identified. The most important of the chromite cycles for PGE mineralization is the upper unit, the UG2 Chromitite Layer, which averages 1 m in thickness.
PGE mineralization
The Merensky Reef has historically been the most important Au, PGE (Pt, Pd, Rh, Ru, Os and Ir) and base metal (Cu and Ni) producing layer in the Bushveld Complex. The Merensky Reef varies considerably in its nature, but can be broadly defined as a mineralized zone within, or closely associated with, the ultramafic cumulate at the base of the Merensky cyclic unit.
In addition to the PGE mineralization associated with the Merensky Reef, all chromitites in the Critical Zone at times contain elevated concentrations of PGEs. The UG2 Chromitite Layer is the only chromitite layer that is significantly exploited for PGEs at present.
Merensky Reef
The Merensky Reef is typically a feldspathic pegmatoidal pyroxenite, bounded top and bottom by thin chromitite layers. The chromite layers have variable thicknesses up to some 5 cm with one being generally thinner or absent. The pegmatoidal feldspathic pyroxenite (pegmatoid) contains interstitial subhedral pyrrhotite and chalcopyrite blebs. The pegmatoid consists of cumulus bronzite crystals, typically 10-20 mm in diameter. The plagioclase feldspar is interstitial.
The immediate hangingwall is a feldspathic pyroxenite (bronzite) typically 1-2.25 m thick, which grades upwards into a norite. Phenocysts of diopside (±20 mm) are present within the feldspathic pyroxenite. The hangingwall typically contains sulphides (pyrrhotite and chalcopyrite) for some 50 cm from its basal contact with the Merensky Reef. The footwall characteristics are variable because of the various noritic, anorthositic, and harzburgitic footwall lithologies.
The grade profile is concentrated around the pegmatoidal feldspathic pyroxenite with the highest PGE concentration associated with the chromitites (Figure 2). The grade is not restricted to a single lithology or to a stratigraphic unit but is dispersed over a number of units, although typically centred around the chromitites and pegmatoidal felspathic pyroxenite of the Merensky Reef. The rocks immediately adjacent to the pegmatoidal pyroxenite are mineralized with PGEs. The tenor typically decreases further from the chromitite stringers and pegmatoidal pyroxenites.
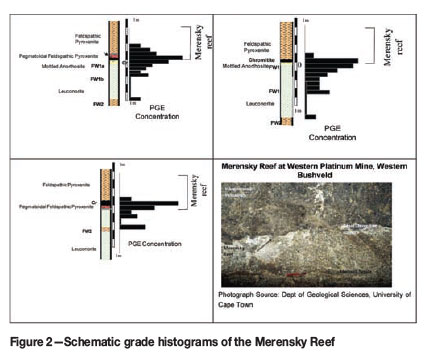
Sulphide mineralization extends into both the immediate hangingwall and footwall. In some cases the PGE mineral- ization characteristics of the Merensky Reef can be correlated with the nature of the footwall. For instance, where the footwall is noritic, the PGE mineralization does not typically extend more than a few centimetres into the footwall, whereas when the footwall is an anorthosite, fine-grained sulphides with good PGE mineralization are frequently present for approximately 40 cm and more erratically to about a metre below the lower chromite layer. The PGEs encountered in this horizon are predominantly PGE-iron alloys and PGE-sulphides. A number of schematic grade profiles are presented in Figure 2.
The importance of the sampling protocol applied is to define the grade profile from which a mining cut can be interpolated.
UG2 Chromitite Layer
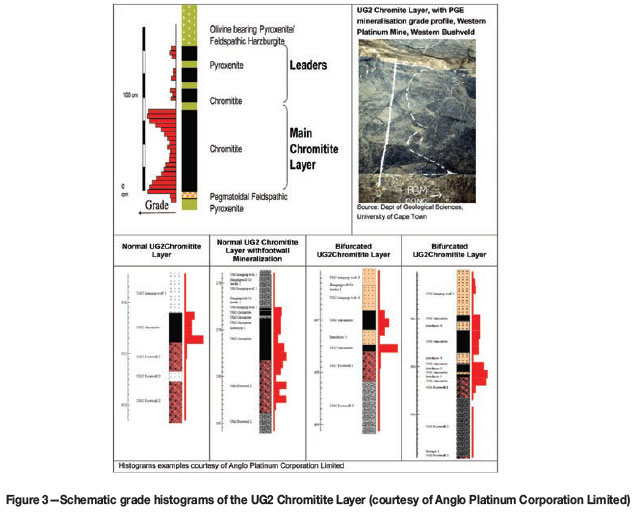
The UG2 Chromitite Layer typically consists of a basal pegmatoidal feldspathic pyroxenite (up to 0.5 m thick) which frequently contains chromite stringers and which is overlain by the Main Chromite Layer (30-140 cm thick). A middling pyroxenite of a few centimetres to 6 m separates the Main Chromite Layer from the alternating chromitite and pyroxenite layers commonly referred to as the leaders or triplets.
The PGEs are associated with sulphides that are interstitial to the chromite grains. The mineralized zone itself is defined by the sharp basal contact with the footwall pyroxenite and the sharp contact at the top of the main chromitite layer. The grade profile typically peaks at the base and top contacts (Figure 3).
The mineralization is generally associated with the Main Chromitite Layer. However, the mining method generally requires mining of the leaders as the lack of cohesion between the chromitite and pyroxenite typically results in falls of ground, which are both dangerous and also dilute the mining cut. A pragmatic approach is to mine the overlying leaders at the same time. The sampling protocol allows the determination of the grade profile for the mining package and provides important information on which strategic mining decisions are made.
Platreef
In the Northern Limb, the Platreef occurs proximal to the basal contact of the Bushveld Complex with the country rock, typically as a thicker zone (up to 30 m wide) containing disseminated sulphides and mineralized (Figure 4). Where the Bushveld Complex is in contact with the Archaean granite and sediments of the Transvaal Supergroup floor rocks, the Platreef is developed. The contact between the Rustenburg Layered Suite and footwall rocks in the northern limb is transgressive, with the Platreef in contact with progressively older rocks of different lithologies from south to north.
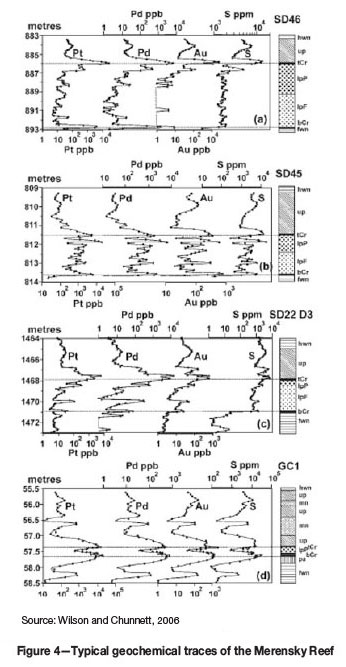
The Platreef is a series of pyroxenites and norites, containing xenoliths/rafts of footwall rocks. It is irregularly mineralized with PGEs, Cu, and Ni. The Platreef (senso stricto) has a strike extent of some 30 km, whereas Platreef- style mineralization occurs over the 110 km strike length of the northern limb (Kinnaird et al., 2005). The Platreef varies from 400 m thick in the south of the northern limb to <50 m in the north. The overall strike is NW or N, with dips 40-45° to the W at surface with the dip becoming shallower down-dip. The overall geometry of the southern Platreef appears to have been controlled by irregular floor topography.
Similar to the Merensky Reef, the importance of the sampling protocol applied is to define the grade profile from which a mining cut can be interpolated (Figure 4).
The Great Dyke
The significant mineralized zone of The Great Dyke is the Main Sulphide Zone (MSZ). The Dyke is divided vertically into an ultramafic sequence, dominated from the base upwards by cyclic repetitions of dunite, harzburgite, and pyroxenite, as well as an upper mafic sequence consisting mainly of gabbro and gabbronorite (Wilson and Prendergast, 1989; Prendergast and Wilson, 1989).
Contained within the ultramafic sequence is the P1 pyroxenite, directly below the mafic-ultramafic contact. The P1 pyroxenite in turn hosts economically exploitable quantities of PGEs in the MSZ, which is generally 10 to 50 m from the top of the ultramafic sequence.
The MSZ is a lithologically continuous layer, typically between 2 m and 3 m thick, that forms an elongated basin. It generally contains iron-nickel-copper sulphides, while elevated PGE concentrations occur towards its base (Figure 5). Peak values for the PGEs and base metals are commonly offset, while the ratio between platinum and palladium also varies vertically. It is often difficult to visually identify mineralization in the MSZ. As a result, the identification of the MSZ is reliant on the identification of the geochemical signature and the identification of the base of the MSZ (BMSZ). This point can be identified by looking down the sequence for where the sulphide mineralization ceases. The geochemistry reflects this with sudden drops in sulphur and associated base metal mineralization.
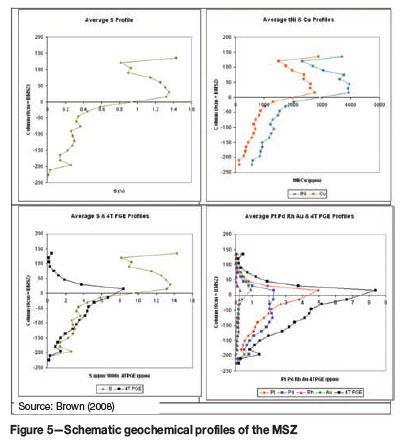
The optimal mineralized part of the MSZ is very difficult to identify. Therefore the application of a suitable protocol to the sampling can allow the identification of the MSZ and the interpolation of the optimal mining cut.
History of sampling and grade control
The protocols currently considered industry standard are based on the work done by a number of geologists working for the two major mining houses - Anglo Platinum and Impala Holdings - during the last 50 years. Considering that until the early 1980s very little information was disseminated by JCI and Gencor, the companies that predated Anglo Platinum and Impala, the methodologies developed were remarkably similar. The current best practice guideline is virtually the same with variations in sample length, numbering, and assay technique being the most significant differences.
The practices have been developed with both mining and exploration in mind. On the operating mines, the mining cut instruction requires that the mining cut for the Merensky Reef be determined. This is based on the sampling of the underground excavations. The determination of the mining cut for the UG2 Chromitite Layer is not required as the mining cut is typically defined based on the lithology rather than the grade alone. An additional criterion is the geotechnical analysis of the hangingwall. The final mining cut therefore considers the grade, metal content, and the geotechnical aspects of the chromite layers in the hangingwall. These are sampled as they are grade-bearing, albeit lower than the main chromitite layer, and are associated with a weak hangingwall due to the lack of coherence between the pyroxenite and chromite. This geotechnical phenomenon is generally unsafe and as a result the layers of leader chromitites are mined together with the main chromitite layer. However, in the project phase the details of the grades of these leaders need to be understood prior to the application of the mining factors.
Mineralogy
Merensky Reef
The PGE mineralogy is associated with the base metal sulphide mineralogy. These sulphides, which constitute about 1-5% of the rock, consist of pyrrhotite (FeS1-x) (40%), pentlandite ((Fe,Ni)9S8) (30%), and chalcopyrite (CuFeS2) (15%). In addition, trace amounts of millerite (NiS), troilite (FeS), pyrite (FeS2), and cubanite (Cu5FeS4) are also present. The major platinum group minerals (PGMs) are cooperite (PtS), braggite ((Pt,Pd)NiS), sperrylite (PtAS2), and PGE alloys, although in some areas minerals such as laurite (RuS2) can be abundant (Schouwstra et al., 2000). On the Western Bushveld Joint Venture (WBJV) nearly 40% of the total PGMs are sulphides larger than 1000 µm2 in size (Muller, 2010)
UG2 Chromitite Layer
The UG2 Chromitite Layer consists predominantly of chromite (60-90% by volume) with lesser silicate minerals (5-30% pyroxene and 1-10% plagioclase) (Schouwstra et al., 2000). Other minerals present in minor concentrations include phlogopite and biotite, ilmenite, rutile, magnetite, and base metal sulphides. The PGMs present in the UG2 Chromitite Layer are characterized by the presence of abundant PGE sulphides, They consist predominantly of laurite (RuOsIr), cooperite (PtS), braggite (Pt, Pd, NiS), and an unnamed PtRhCuS. The PGMs reach an average size of only approximately 12 µm, with particles larger than 30 µm being extremely rare (Schouwstra et al., 2000). They occur in association with the base metal sulphides and silicates. Only the mineral laurite exhibits a preferred association with the chromite grains.
Platreef
The major PGMs consist of PGE tellurides, platinum arsenides, and platinum sulphides (Schouwstra et al., 2000). There appears to be a link between the rock type and the type of PGMs, with serpentinites being characterized by a relative enrichment in sperrylite (PtAs2), and the upper pyroxenites being characterized by more abundant PGE sulphides and alloy. PGE alloys generally dominate mineralization closer to the floor rocks (Schouwstra et al., 2000). Common base metal sulphides include pyrrhotite, pentlandite, chalcopyrite, and pyrite, and with the PGMs frequently occurring enclosed in or on grain boundaries of these base metal sulphides (Schouwstra et al., 2000).
Main Sulphide Zone
The MSZ contains between 0.5% and 10% sulphides, represented mainly by pyrrhotite, pentlandite, and chalcopyrite in about equal proportions, as well as subordinate pyrite. The PGMs are typically included in pyrrhotite or chalcopyrite, sometimes in pentlandite, or they may occur at sulphide/sulphide or sulphide/silicate contacts, or within silicates. PGMs intergrown with pyrite are extremely rare. The suite of PGMs found in the MSZ includes (Pt,Pd)-bismuthotellurides (50.1%), sperrylite (19.0%), cooperite/braggite (8.5%), the PGE-sulpharsenides holling-worthite (RhAsS), platarsite (PtAsS), irarsite (IrAsS), and ruarsite (RuAsS) (11.9%), laurite (RuS2) (5.0%), Pt-Fe alloy (2.4%), as well as some less common PGMs (Oberthur et al., 2012). Grain sizes range from < 5 to 50 µm in general, but may reach up to 480 µm in the longest dimension (Oberthur et al., 2012).
Sampling methodology
Borehole core
The sampling protocol is determined by the requirement of the sampling. The sample sizes and intervals must be appropriate for the deposit and the grain size of the material being sampled as well as the intention of the sampling programme. The need to provide standard 'support', in a geostatistical sense, needs to be considered when designing a sampling programme, especially as compositing based on sample length can be expected in the estimation. Equalizing sample length is not the only criterion for standardizing sample support. Factors such as angle of intersection of the sampling to mineralization, sample type, borehole diameter, drilling conditions, recovery, sampling/sub-sampling practices, and laboratory practices all affect the 'support' of the sample. Typically sampling is undertaken to support a mineral resource estimate or to define an optimal mining cut.
Sampling is generally undertaken on half core with a sample size of 15-25 cm in length from BQ (36.4 mm diameter) or NQ (47.63 mm diameter) core. The taking of samples of varying length is unavoidable due the nature of the intersections and the variability of the mineralized stratigraphy or lithology. Sample lengths of up to a metre are generally used to confirm the lack of mineralization or occasionally to sample a complete lithological unit.
The sampling procedure begins with the drilling of the core. Complete core recovery over the sampling zone is required. This is not always possible as a result of the natural fractures in the core. Recovery of over 95% is generally acceptable and should form part of the commercial agreement with the drilling contractor. The core must be transported from the rig site to the core yard. It is imperative that core samples are not unduly damaged during transit. The chain of custody should be properly documented
At the core yard, the core should be checked and marked according to the drill depths. Thereafter the core must be logged according to industry logging standards. The logs should include descriptions of the lithotype, major and minor fractures (including infilling), and the presence of sulphide mineralization (including the prominent sulphide mineral types). The logging detail should be at the level required for this type of mineralization. Once the core is logged, the sampling protocol is applied and the samples marked out.
Samples should be taken so that they are justified to the major lithological contacts with on average an overlap of 2 cm of material being taken in the footwall and hangingwall of economic zones or mining cut. The exact sample size and frequency must take cognisance of suitable geochemical and geological knowledge of the deposit and mineralized horizon. A number of samples are taken into the footwall and hangingwall of economic zones or mining cut as the grade is distributed into the hangingwall and footwall. Sample breaks are made on the basis of geology, and where possible, natural breaks in the core are used to separate samples if they are approximately perpendicular to the core axis.
The core is then split along its length through the low point of the contact dip using a diamond saw, by an appropriately trained assistant, in preparation for bagging. Half core samples are cut to length, and half of the core is then bagged and sealed with its sample number ticket both inside the bag and attached to the outside. There is a debate as to whether natural breaks be used in preference to cut breaks. The debate includes consideration for the loss of material when cut or the understanding that different samples lengths constitute different support when undertaking a mineral resource estimate. The remaining half core should be suitably marked and kept in the core tray for future reference (Figure 6). Heavy-duty plastic sample bags must be used, and these should be discarded by the laboratory after sample preparation. Sample bags must not be re-used. Once properly labelled, sealed, and documented the samples can be dispatched to the laboratory.
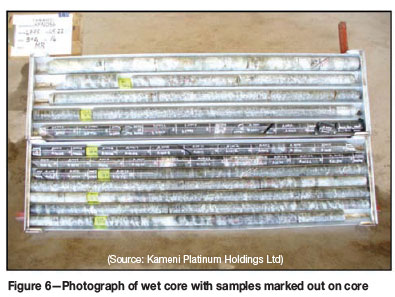
Once the sampling has been completed, it is advisable to photograph the core while both wet and dry. This should be mandatory when whole sampling is necessary. Core should be retained to allow comparison of the assay data with the geology, for other geological studies (density, magnetic susceptibility, structural etc), for additional sampling (1/4 core), and as a record of the drilling. This is invaluable as it allows consideration for aspects of the mineralization that need to be understood and communicated to the mining engineers and process engineers.
Sampling of the Merensky Reef
For the Merensky Reef, the potential mining cut as well as the amount of hangingwall or footwall in the cut needs to be determined. Sampling is extended from well above to well below the reef in order to completely close off the mineralization. The smaller the sample length the better definition can be made, as the result is that the effective decision-making is being made at the edge of the mining cut where the grade is lowest and closet to the detection limit.
The Merensky Reef is measured from just above the upper chromitite stringer to just below the lower chromitite stringer. The interval is then divided into even samples of approximately 20 cm in length; although individual sample thickness may range from 15 cm to 25 cm. All chromite associated with the upper and lower chromitite stringers is included in the top and bottom samples of the Merensky Reef. The sample interval is frequently widened further away from the Merensky Reef proper.
Sampling of the UG2 Chromitite Layer
Sampling of the UG2 Chromitite Layer is dependent on the character of the reef encountered. The reef is measured from the top chromitite contact (top of leader) to the base of the main chromitite layer and divided into fairly even sample intervals of approximately 20 cm (again these may range from 15 cm to 25 cm). Where a leader layer is present, it is treated as a separate sample if the leader and pyroxenite parting are of suitable thicknesses - approximately 15 cm each. If the leader and parting are thin, they are included together in a single sample. A parting will therefore either be sampled separately or included with the leader, and is never included with the main chromitite layer. Where additional pyroxenite lenses are developed in the UG2 Chromitite Layer, these are sampled separately if of significant thickness (>15 cm). Finely disseminated chromite grains and chromitite stringers in the immediate footwall to the main chromitite layer should be included with the basal sample (these often carry extremely high grades). Sampling is extended well into the footwall of the UG2 Chromitite Layer.
A comparison undertaken by Platinum Australia (S. Hunns, personal communication) on the UG2 Chromitite Layer showed that there was little difference in the grade over the stratigraphic unit. The advantage of this approach is that it provides the grade directly and the overall cost will be less because fewer assays are required. However, where some optimization or decision-making with respect to the cut is made, the use of smaller sample intervals is best.
Sampling of the Platreef
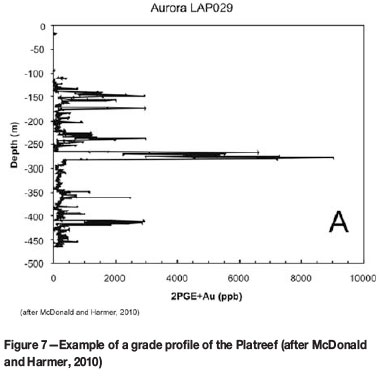
The grade profile of the Platreef may be difficult to determine (Figure 7). As a result, sampling tends to be extensive to identify the mineralized horizon and allow for the optimal mining cut.
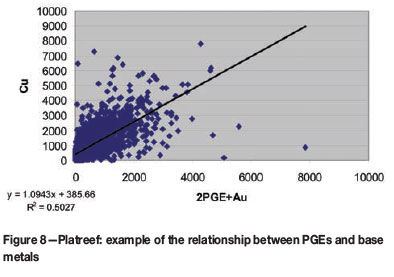
A common way to assist and to try and keep assay costs down is to use an indicator element. Commonly the base metals (Cu or Ni) are used. However, this correlation, although understood academically, needs to be proven or demonstrated before being used (Figure 8).
Sampling of the MSZ
In the case of the MSZ, the determination of the BMSZ is critical to the determination of the mining cut due to the lack of geological markers. As with other PGE-bearing horizons, the smaller sample size is best for decision-making, but needs to be balanced with the cost, as well as the ability to accurately assay the smaller samples. The sample size of 15-25 cm is considered appropriate and allows for significant accuracy in determining the BMSZ and therefore a valid mining cut determination. The sample size is often increased where some understanding of the mineralization exists -however, additional data may be required to confirm that the mineralization does not extend beyond the generally recognized.
Underground sampling
Underground sampling is intended to mimic borehole core. The standard underground sampling protocols are generally similar to those used for core. Differences relate to the access to the underground face and the equipment limitations. Traditionally, underground sampling has been undertaken with a hammer and a cold chisel. This method has been recognized to entail inherent sampling errors and therefore the use of diamond saws has been considered as an industry standard. However, the logistics of getting a pneumatic saw to the face and finding a suitable connection for the compressed air has made it difficult to implement uniformly.
Underground or face sampling is generally undertaken in development ends and in the gullies, advance strike gullies (ASGs), and headings of the stope panels. It is seldom undertaken in the stope faces themselves as the stope faces generally provide only a limited part of the geology to sample. In addition they may be logistically very difficult to sample as getting equipment into and out of stope faces can be extremely hard work. During trial mining, including development, stope and metallurgical sampling may be required.
A location for ease of sampling and preferably with no structural discontinuity is selected and the position determined from the underground survey controls. The sample method requires the use of a diamond saw to cut the sample channels grooves, which are then chipped out with a chisel. The channels should be 5 cm wide and 2 cm deep. The identification of the important lithologies is required to provide the reference from which the sampling is justified. A 2 cm overlap into the hangingwall and footwall lithologies is included with the top and bottom reef samples to ensure consistency with the diamond drillhole sampling.
Marking continues with samples divisions across the economic unit, according to the requirements of the sampling programme or protocol. Starting from the bottom, grooves are cut at these sample divisions with numbering of samples consecutively from the top or bottom as required by the individual protocol.
Prior to sampling, the faces should be cleaned of recent weathered material so that the sample is representative of the actual mineralization. Sampling from the bottom is considered best to reduce contamination. Overbreak into the sample above must be avoided. Samples are put into clean plastic bags of a suitable size. The bags and contents must be properly labelled with reference to the documented location and sample position.
The method of sampling and the marking and cutting out of the sample channel must be similar to that used for core sampling.
Blast-hole sampling
Blast-hole sampling is undertaken in open pit operations such as Mogalakwena Platinum Mine. The blast-holes are sampled and analysed prior to charging with explosive. This is a valuable procedure as it allows determination of grade and therefore indicates to which stockpile the material should be dispatched. The blast-holes are designed and drilled for blasting purposes with 310 mm, 250 mm, and 165 mm size bits.
As a percussion or rotary drill rig is drilling, the chips generated are flushed out of the blast-hole with compressed air. The process is dusty (when dry) and muddy (when waterlogged). Samples come out in the kerf between the rod and the rock walls of the hole. Six 2.5 m samples are collected for every 15 m of blast-hole. One-kilogram (1 kg) samples are submitted for geological (density, PGEs, Cu, Ni) or metallurgical (floatation and hardness parameters) charac- terization. These results are used to determine the nature of the direct feed and/or stockpiling destinations for the blasted muck.
In the last couple of years, Mogalakwena has been replacing blast-hole drilling with reverse circulation (RC) drilling. Beyond 2013, all production sampling at Mogalakwena will be from RC drilling. RC drilling involves using a sampling rig to drill for samples independent of blast-holes and thus entails an extra cost.
RC drilling involves blowing chips from the bit face and transporting them through the centre of the rods (in an inner tube) and out to a sampling unit on the side of the rig. The sampling unit is a basically a series of cyclones to settle the chips and dust before dropping them down an auto-splitter system. RC drilling samples are always dry as the design allows compressed air to hold back the water even in waterlogged situations.
The quality of samples with the RC drilling method (minimum contamination, minimum human interference, and automatic splitting) justifies the extra drilling cost when compared to blast-hole sampling. RC sampling also goes beyond just one bench (15 m) although the 2.5 m sampling interval is maintained
RC drilling is significantly faster (time) than and costs significantly less than diamond drilling. Diamond drilling is still used for exploration drilling only.
Sample size
The weight of the sample should be 230-420 g (BQ core) or 410-710 g (NQ core). The weight is important as it relates to the applicability of sampling theory as well as the practical requirements of the laboratory and the specified analytical technique. The recommendation is always to utilize as much sample as possible for fire assay and hence wherever possible a 50 g aliquot is recommended. Other duplicates are required as well as backup pulp samples in case issues occur with the assay or as a requirement for duplicate analysis of every sample.
An aspect to be considered is the 'nugget effect'. Geostatistical theory assumes that there should be no difference between a sampled value and a potential repeat sample at the same location (Clark, 2010). Included in the variation of the grade between contiguous samples are aspects of the mineralization, geological features, grain size, etc. as well as any 'random' sampling variation that might occur due to the method by which the sample was taken, the adequacy of the sample size, the assaying process, etc. Platinum deposits typically have high nuggets effects i.e. two samples taken close to each other are likely to have different PGE concentrations, probably due to the very small grain size of the platiniferous mineral, the random distribution of the sulphide mineralization in the host rocks, and the low concentration of the precious metals. The normal approach to understanding the level of the nugget effect is to ensure sufficient sampling. The sampling protocols adopted routinely in the industry have over time been demonstrated not to introduce a bias or influence in relation to the nugget effect.
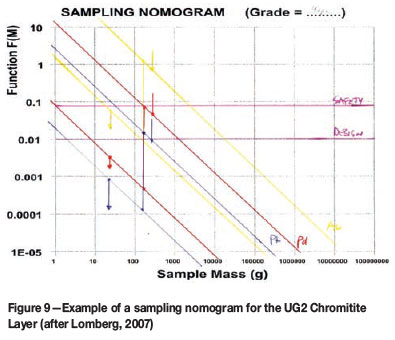
The sample preparation and communition protocol is very sensitive the grain size of the precious metals (Lomberg, 2007). The use of a nomogram can show that the size of the mineral grains can influence significantly the liberation of the PGE during the analytical procedure (Figure 9) (Lomberg, 2007). Au is particularly sensitive due to its much lower concentration.
Analytical techniques
PGEs
The chemistry of this special group of elements makes their determination at low concentrations in geological samples difficult. However, the PGE industry and the commercial laboratories have developed methods, procedures, and protocols that allow the determination of these elements, even at these levels, to be undertaken with a degree of precision and accuracy. This is necessary to support the mining value chain.
The most common form of commercial PGE analysis is fire assay using a number of different collectors to concentrate or capture all of the precious metal. Pulverizing of the samples is undertaken to achieve 85% -75 in size. The Pb-fire assay method involves fusing the sample with a flux mixture at ±1000°C. The resultant melt separates into two immiscible phases, namely a glassy slag (which contains the aluminosilicates and base metals, and is discarded) and a denser phase (including the PGEs collector, which sinks to the bottom). The critical aspect is that the PGE are strongly partitioned into this collector phase, from which they may be subsequently separated for analysis. Thus the selection of the collector is an important decision to be made in the analytical process.
Lead collection is used extensively as it is suitable for the determination of Pt, Pd, Rh, and Au. As these are the major precious elements of the Merensky Reef and UG2 Chromitite Layer the use of Pb as a collector is widespread in the industry. The use of Pb as a collector and the reporting of these elements as a sum is common practice, especially on mining operations. More emphasis on the individual elements or prill split has resulted in the use of other collectors in the analysis, such as silver as a co-collector, which helps prevent volatile losses during the cupellation stage. The practical limit of detection is 0.1 ppb (Pt) and 0.5 ppb (Pd), although the detection limits used for mine samples is much higher; 0.1-0.5 ppm. The practical reasons are the cost, the volume of analyses required, and the use of the results on a mine where the in situ grades are >3 g/t 3PGE+Au.
The best alternative until relatively recently was the NiS collector and fire assay. The technique was used more extensively in the metallurgical environment due to the accuracy required. Geological samples were until the 1990s rarely submitted to NiS-fire assay. The method differs from Pb-fire assay as all the PGEs are collected in the nickel sulphide. The advantages are that there is complete collection of the entire range of PGE and that there is no cupellation step in which some PGEs may be lost. As a result the method is widely considered to provide slightly higher total PGE results. The limits of detection for PGEs provided by commercial laboratories are typically in the range of 0.02 ppm to 0.005 ppm. The analytical detection limit may be 0.1 ppb (Pt) and 0.5 ppb (Pd) if required. However, the the deposit would not economic at grades that low, and so the higher detection limit is a realistic approach given sample volumes and cost.
The fire assay method has the following advantages (Rao and Reddi, 2000):
►Ease of handling large sample weights, which can deal with low analyte concentrations and address non-homogeneity and the 'nugget effect'
►Assurance of quantitative collection of all the PGEs (NiS-fire assay) and their complete separation from base metals and other matrix elements.
The few disadvantages of the fire assay procedures are:
►Large reagent blanks due to the presence of PGEs in the chemicals utilized during sample decomposition and solution preparation (e.g., nickel powder is known to contain appreciable amounts of PGEs and so blank fusions are performed on a regular basis to check for this)
►Selection of suitable flux composition is an important aspect and the tendency to generalize flux weights often lead to erroneous results
►The experience of the assayer has a critical role in successful assaying and the technique therefore requires skilled personnel.
Despite this, NiS-fire assay is probably the preferred pre-concentration method for analysis of PGEs in geological and related materials because of its versatility and broad range. Recently other collectors have been used to provide alternatives to NiS-fire assay. The reason for the use of other collectors relates to the difficulties of NiS-fire assay, and the cost and the time required. These collectors have allowed the reporting of good (precise and accurate) results and so are more widely available with some commercial laboratories.
Base metals
The emphasis of this paper is on the PGEs. However, base metals (Cu, Ni, and Co) are important components of the mineralization. They contribute to the revenue and so need to be assessed in an appropriate manner. For the sake of completeness some discussion is included here. The level of base metal that is being considered is an order of magnitude lower than that in a primary base metal deposit. Therefore the analytical method must have a lower level of detection.
Below is a list of analytical methods used for the determination of the base metals. The list is not exhaustive as the analytical technique chosen should be considered based on its applicability to the task at hand. The selection of the analytical method should include consideration of accuracy and precision, detection limits, expected concentration, and sample matrix.
► Pressed pellet and X-ray fluorescence (XRF)-XRF is a non-destructive analytical technique used to determine a full range of light to heavy elements by pressed pellet disc. This technique is suitable for large numbers of samples (usually at ppm levels) where the matrix of the material is generally consistent, such as Cu and Ni determination for the Merensky Reef, UG2 Chromitite Layer, and Platreef
► Aqua regia leach-Aqua regia will digest chalcophile elements in particular, although elements associated with silicates and more refractory minerals may be only partially digested. The concentration may be determined by atomic absorption spectrometry (AAS) or inductively coupled plasma-optical emission spectroscopy (ICP-OES)
► Four-acid digestions-Four-acid digestion provides a total dissolution of most elements except for a few such as Cr, V, and Ti. The concentration may be determined by ICP-OES or inductively coupled plasma-mass spectroscopy (ICP-MS).
► Sodium peroxide fusion-Sodium peroxide fusion with an ICP-OES finish provides total analyses of base metals but at the expense of higher detection limits and lower precision due to the high sodium salts in solution. Generally detection limits are in the region of 20 to 50 ppm
►Wet chemistry consists of titrimetric and gravimetric techniques, and is more suited to concentrates or percentage-level base metals.
It is also important to consider the sulphide-soluble Cu or Ni as well as the total concentration. This is especially true as Ni commonly substitutes into olivines and so is not recoverable. A partial leach (such as acetic acid) that does not mobilize silicate-hosted material reporting sulphide Cu and Ni would be appropriate.
Quality assurance/quality control
The current investment environment requires the reporting of exploration results against the international reporting codes (SAMREC, JORC, etc.). Owners, promoters, investors, and other interested stakeholders require that the results of the exploration be reported with confidence. Mineral exploration and mining companies have to de-risk their projects from inception right through to production. Investment risk can be lowered and confidence in the results promoted by the implementation of quality assurance and quality control (QA/QC) programmes (Lomberg, 2013).
The application of a QA/QC procedure aims to confirm both the precision and accuracy of assays and is used to ensure that they can be confidently relied upon and thus reduce the risk of a project. The QA/QC programme identifies various aspects of the results that could negatively influence the precision or accuracy of the assay data.
In order to do this, control samples are inserted into the sampling stream. The control samples recommended should comprise two different certified reference materials (CRMs), a blank, and a duplicate within every 20 samples submitted. The CRMs are reference samples with a known (stastically) element abundance. The CRMs should have a composition (matrix) similar to the range of rock types being analysed to ensure that the quality control programme is valid (Méndez, 2011). When choosing which standards to use, the methodology being employed by the laboratory to analyse the samples should be identical to the method used to certify the standard. Finally, the CRMs should include one that has analyte concentrations close to the anticipated average concentration of the deposit and one at or close to the marginal or cut-off grade. A blank is a standard with an abundance of the elements of interest below the level of detection of the analytical technique. The duplicate is a second split of a sample taken at a particular stage of the sampling process; e.g. field or pulp duplicate. The intended aim is 5% coverage for each of the control sample types. The inserted quality controls should allow the identification and reporting of 'non-conformance' or 'out of control' processes during the analytical process (Noppe, 2008). Further control on data integrity is required through submittal of pulps to a referee laboratory at a recommended frequency of 1 in 10 (10%). These check assays are compared with those of the primary laboratory and any bias monitored and eliminated as well as potential analytical errors at the principal laboratory identified. It is very important to remember that exactly the same assay methodology must be employed by the umpire laboratory to ensure an accurate comparison and that standards also be submitted within the real samples to ensure the accuracy of the umpire laboratory. To maximize the comparison between the two laboratories, the pulp residues submitted should be chosen at random from the data-set and cover the entire grade range being reported. QA/QC samples should be inserted as per the protocols adopted for the sampling programme. The quality control data should be analysed on an ongoing basis and queries addressed to the laboratory.
By using this density of QC samples, it is possible to identify samples that had been swapped, missing samples, and incorrect labelling among other aspects. The value of a good QA/QC programme is that it identifies potential weaknesses in the sampling procedure or sampling errors and allows the geologist to correct or minimize them before they can adversely influence the assay data. These errors may include incorrect sampling, poor sub-sampling methods, and errors due to the sampling equipment (e.g. core cutting, invalid splitting methods etc).
Conclusion
The use of the appropriate sampling methodology can ensure that valid data is collected that allows the estimation of a mineral resource and the selection of a mining cut for a PGE deposit. These methodologies have been established over an extended period and proven to be practical and pragmatic
The basis for an appropriate sampling regime is a thorough understanding of the deposit and its mineralization. Related to this is the appreciation of the anticipated exploration methods, mining methods, and metallurgical process flow sheet.
Acknowledgements
I would like to acknowledge the contributions of Kevin Ferguson and Steve Hunns (Platinum Australia), Barend Meulenbeld (Kameni Holdings), Anglo American Platinum (Trust Muzondo), Setpoint Laboratories (Kevin Gerber), and Thys Botha (Platinum Group Metals).
References
Brown, R.T. 2008. A Brief Summary of the Great Dyke of Zimbabwe. Unpublished Report. [ Links ]
Clark, I. 2010. Statistics or geostatistics? Sampling error or nugget effect? Journal of the Southern African Institute of Mining and Metallurgy, vol. 110. pp. 307-312. [ Links ]
Kinnaird, J.A., White, J.A., and Schurmann, L.W. 2005. Multiphase emplacement of the Platreef, northern Bushveld, South Africa. (Abstract.) 10th Platinum Symposium, Oulu, Finland, 7-9 August 2005. [ Links ]
Lomberg, K.G. 2007. Construction and use of a nomogram for the UG2 Chromitite Layer. University of the Witwatersrand. Sampling Theory and Methods course assignment. [ Links ]
Lomberg, K.G. and McKinney, R.L. 2013. Quality Control and Quality Assurance Case Studies for the Analysis of Precious and Base Metals. Symposium Series S75. Southern African Institute of Mining and Metallurgy, Johannesburg. pp. 95-112. [ Links ]
McDonald, I. and Harmer, R.E. 2010. The nature of PGE mineralization in the Aurora Project Area, Northern Bushveld Complex, South Africa. 11th International Platinum Symposium, June 21-24 2010. Ontario Geological Survey, Miscellaneous Release-Data 269. [ Links ]
Méndez, A.S. 2011. A discussion on current quality-control practices. Mineral Exploration, Applications and Experiences of Quality Control. Ivanov, O (ed.). InTech, Rijeka, Croatia. [ Links ]
Muller, C.J. 2010. Technical Report on Project 3 Resource Cut Estimation of the Western Bushveld Joint Venture (WBJV) located on the Western Limb of the Bushveld Igneous Complex, South Africa. Western Bushveld Joint Venture. Prepared for Platinum Group Metals Ltd. [ Links ]
NOPPE, M. 2008. Notes on data QA/QC requirements. http://www.ebah.com.br/content/ABAAAAHTQAH/quality-assurance-and-control [ Links ]
Oberthür T., Melcher, F,, Buchholz, P., and Locmelis, M. 2012. The oxidized ores of the Main Sulphide Zone, Great Dyke, Zimbabwe: turning resources into minable reserves - mineralogy is the key. 5th International Platinum Conference 'A Catalyst for Change', Sun City, South Africa, 18-20 September 2012. Symposium Series S72. Southern African Institute of Mining and Metallurgy, Johannesburg. pp. 647-672. [ Links ]
Prendergast, M.D. and Wilson, A.H. 1989. The Great Dyke of Zimbabwe - II: mineralization and mineral deposits 5th Magmatic Sulphides Field Conference, Harare, Zimbabwe. Prendergast, M.D. and Jones, M.J. (eds.), Institute of Mining and Metallurgy, London. pp. 21-42. [ Links ]
SAMREC. 2009. South African Mineral Resource Committee. The South African Code for Reporting of Exploration Results, Mineral Resources and Mineral Reserves (the SAMREC Code). 2007 Edition as amended July 2009. http://www.samcode.co.za/downloads/SAMREC2009.pdf. [ Links ]
Schouwstra, R.P., Kinloch, E.D., and Lee, C.A. 2000. A short geological review of the Bushveld Complex. Platinum Metals Review, vol. 44. pp. 33-39. [ Links ]
Viljoen, M.J. and Schürmann, L.W. 1998. Platinum group metals. The Mineral Resources of South Africa. Wilson, M.G.C. and Anhaeusser, C.R. (eds.). Handbook 16. Council for Geoscience, Pretoria, pp. 532- 568. [ Links ]
Wilson, A. and Chunnett, G. 2006. Trace element and platinum group element distributions and the genesis of the Merensky Reef, Western Bushveld Complex, South Africa. Journal of Petrology, vol. 47. pp. 2369-2403. [ Links ]
Wilson, A.H. and Prendergast, M.D. 1989. The Great Dyke of Zimbabwe - I: Tectonic setting, stratigraphy, petrology, structure, emplacement and crystallization. 5th Magmatic Sulphides Field Conference, Harare, Zimbabwe. Prendergast, M.D. and Jones, M.J. (eds.), Institute of Mining and Metallurgy, London. pp. 1-20. [ Links ]

