


Services on Demand
Article
 English (pdf)
 Article in xml format
 Article references
Indicators

Related links
-
 Cited by Google
 -
 Similars in Google
Share

 Permalink
Journal of the Southern African Institute of Mining and Metallurgy
On-line version ISSN 2411-9717
Print version ISSN 2225-6253
J. S. Afr. Inst. Min. Metall. vol.114 n.1 Johannesburg Jan. 2014
SAMPLING AND ANALYSIS PAPERS
Determination of sampling configuration for near-shore diamondiferous gravel occurrence using geostatistical methods
J. JacobI; C. PrinsII; A. OelofsenI
INamdeb Diamond Corporation
IIAnglo American plc
SYNOPSIS
Diamondiferous linear beaches in Mining Area No. 1 have been the mainstay of Namdeb's diamond production for more than 80 years. Most of the onshore beaches have been mined out, but in recent years mining has been extended offshore into the surf zone through a process of beach accretion. A total of 61.6 million carats has been produced from the gravel beaches since their discovery in 1928, and Mining Area No. 1 is considered to have great remaining potential from areas currently submerged under water.
To date, the surf zone has remained largely unexplored due to the consistently strong winds, currents, and large waves which make access to this area extremely difficult. This paper describes the processes used in developing a practical methodology for exploration of the surf zone in a domain extending approximately 22 km long in a northwest-southeast direction and 0.3 km wide in a perpendicular direction adjacent to the current Mining Area No 1.
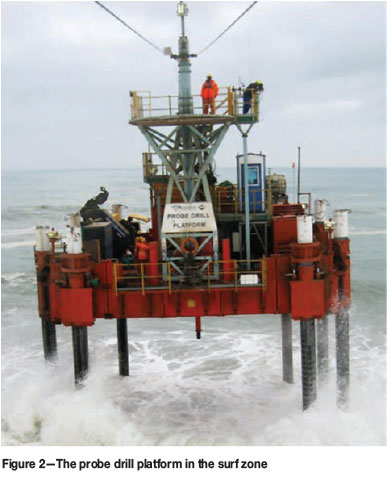
The vigorous surf zone poses multiple technical challenges in terms of obtaining geological and diamond information. In order to access the area for sampling, a jack-up walking probe drill platform (PDP) with a 5-inch diameter reverse-circulation drill has been developed to carry out exploration drilling in the dynamic surf zone. The hydraulically driven platform has eight legs, each of which is 18 m long. Four of the legs are in fixed positions on the fore and aft sides of the platform. The other four moveable legs are fitted to sliding frames attached to the port and starboard sides of the platform. The sets of fixed and moveable legs can be raised and lowered by hydraulically powered jacking stations. By alternately lifting and lowering the sets of fixed and moveable legs in conjunction with the frames moving back and forth horizontally, a walking action is performed by the PDP. The platform can walk at a speed of 10-15 m/h, depending on weather and footwall conditions.
Optimization of sampling for diamondiferous gravel occurrence in Mining Area No.1 was undertaken through creation of a virtual orebody on which different sample configurations were tested. The input data for the construction of a virtual orebody comprises a set of drilling data, collected from recently accreted areas directly adjacent to the 22 km x 0.3 km target domain. The input drilling data covers only 34% of the domain, and for the purpose of this study, a single realization is deemed to be sufficient.
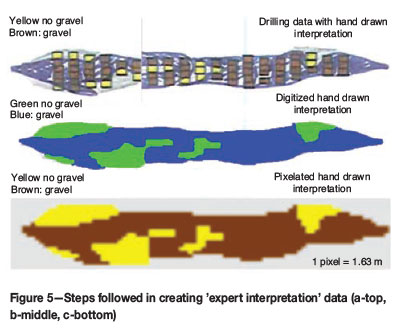
The texture obtained from using only the drilling data to construct a simulation did not make geological sense; hence it was necessary to make use of analog data in order to improve the simulation. The first analog data used consists of the gully patterns found in the metasedimentary Precambrian bedrock footwall. Gullies are, in general, gravel filled and it is fair to assume that gully patterns form a subset of the total gravel occurrence. Total gravel occurrence includes marine terraces (governed by sea-level stands) above bedrock peaks, together with gravel within gullies below bedrock peaks. The second analog 'data' introduced is through the use of 'expert interpretation'. The indicator drilling data is interpreted by expert opinion and the 2-dimensional result is hand-sketched, digitized, and then pixelated. The pixelated data set is then used as input for variogram calculation.
This study cannot provide a single definite optimization result as the nature of the data does not permit this. The use of different validation approaches (conditioning data, where available; expert interpretation; and gully pattern data), however, can give a very good indication of how to balance sampling effort with de-risking aspects related to geological continuity.
Work undertaken by sampling the simulation will give an assessment of the relative probabilities of determining gravel occurrence in the study area. This study showed that a 50 m x 400 m cross-configuration will be a good initial sample spacing for highlighting areas where gravel may be absent, and further infill drilling may be required.
The relative efficiency of a 50 m x 400 m cross off-set sampling configuration has been demonstrated using a trumpet curve versus sampling effort when using kriging as the estimation method.
Keywords: sampling configuration, marine diamonds, orebody simulation.
Introduction
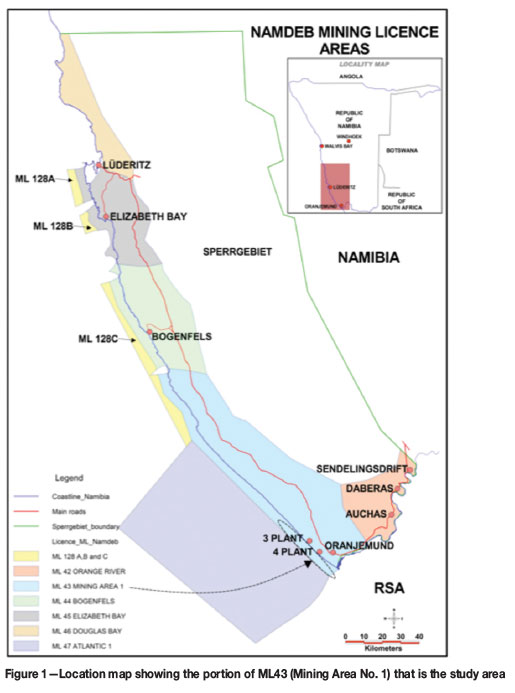
The world-class diamond placer along the southern Namibian coast (Figure 1) is characterized by raised and submerged gravel beach terraces and bedrock-controlled trapsites. As the diamond resources on land are being depleted, the focus is shifting towards gravel deposits under the sea in the near-shore surf zone. To date, the surf zone has remained largely unexplored due to the consistently strong winds, currents, and large waves which make access to this area extremely difficult. This paper describes the processes used in developing a practical methodology for exploration of the surf zone in a domain extending approximately 22 km long in a northwest-southeast direction and 0.3 km wide in a perpendicular direction adjacent to the current Mining Area No 1.
To optimize sampling for diamondiferous gravel occurrence in the surf zone areas, a virtual orebody is required on which different sample configurations can be tested. The input data for the construction of a virtual orebody comprises a set of drilling data, collected from recently accreted inshore areas directly adjacent to the 22 km x 0.3 km domain. The input drilling data covers only 34% of the domain, and for the purpose of this study, a single realization is deemed to be sufficient.
Methodology
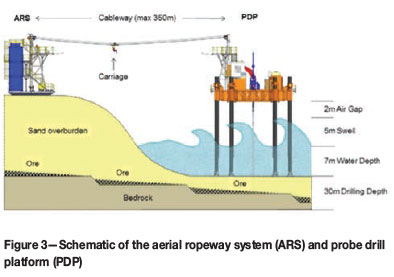
In order to access the area to allow delineation and sampling of diamondiferous gravels covered by the sea, a jack-up walking probe drill platform (PDP), with a 5-inch diameter reverse-circulation (RC) drill, has been developed to carry out exploration drilling in the dynamic surf zone (Figures 2 and 3). The platform weighs 195 t, its deck measures 12 m x 12 m, and it is designed to withstand 144 km/h winds combined with a 5 m swell. It can operate in up to 7 m water depth in calm seas, and drill through more than 30 m of sediment. A 2 m air gap must be maintained between the base of the platform and the top of the waves. The platform is connected to land with an aerial ropeway system which has a maximum extension of 350 m and which is used to transfer personnel to and from the platform. The hydraulically driven platform has eight legs, each of which is 18 m long. Four of the legs are in fixed positions on the fore and aft sides of the platform. The other four moveable legs are fitted to sliding frames attached to the port and starboard sides of the platform. The sets of fixed and moveable legs can be raised and lowered by hydraulically powered jacking stations. By alternately lifting and lowering the sets of fixed and moveable legs in conjunction with the frames moving back and forth horizontally, a walking action is performed by the PDP. The platform can walk at a speed of 10-15 m/h, depending on weather and footwall conditions.
Knowledge and experience gained over many years of onshore exploration was used to simulate and optimize an exploration plan for the surf zone areas. The following methodology was utilized to combine the different sources of input data into the process of creating and analysing the simulation:
►A review of the input data was undertaken to assess the aerial coverage, spatial clustering, and location of the data relative to the study area
►An exploratory data analysis considered the statistics of the data and the percentage split of the gravel/no-gravel indicator data
►Variography testing was carried out, based on input data and geological interpretation
►A hand sketch was used to capture the interpretation of the input data and generate 'expert interpreted' data and parameters for later use in the process of creating the simulation
►The data was kriged to obtain an overall perspective of gravel occurrence and the results used to validate the simulation outcome
►Parameter determination was undertaken using the input data and 'expert interpretation' data to create a conditional indicator simulation
►The acceptability of the simulation realization was assessed against geological understanding and available data
►A 'measure of success' was determined so that the different sample configurations could be compared
►A sample optimization study was performed
►Conclusions were drawn and a decision was made as to what would be considered an efficient sample configuration
Data
The gravel occurrence data used in the simulation is sourced from a combination of onshore aircore, GB50 hydraulic grab, and BG36 auger drilling from Mining Area No. 1. The drilling covers an elongated, roughly north-south, coast-parallel strip about 22 km long and 0.30 km wide. For this sample optimization study the data was rotated in order to create a strictly north-south domain and to improve the efficiency of simulation and subsequent analysis. The relative data positions remain unchanged. After the rotation, the input data was simplified to consist of a location coordinate and an indicator value representing the presence or absence of diamondiferous gravel.
High water lines (HWL) are shown for 1997 and 2011 in pink and red (Figure 4) and the expected HWL for 2020 is shown in blue (based on CSIR accretion models). Beach accretion is an on-going outflow of mining activities. The task at hand is to determine a drill configuration to establish diamondiferous gravel occurrence for the areas currently under water for resource generation purposes. The PDP will be applied to drill in the area currently under water (between the 2011 and 2020 HWLs (Figure 4)).
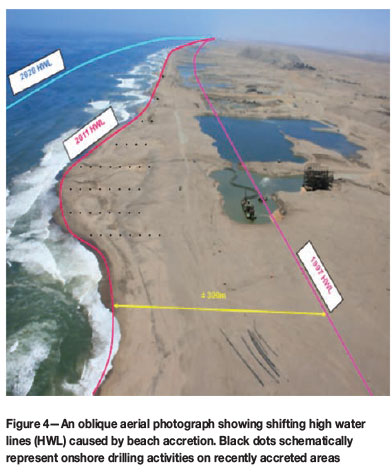
Linear beach deposits show greater continuity in the direction along the coast as opposed the direction normal to the coastline. Hence the onshore drilling data accumulated on an accreted 'sand spit' is ideal for simulation purposes in a long narrow coast-parallel strip. The input data used for the simulation comes from areas where most recent accretion occurred (i.e. there is dry land for conventional RC and large-diameter BG36 drills to operate on - illustrated by the black dots in Figure 4). These patches of beach accretion are limited to and governed by the proximity of recent mining activities. This is the reason why the input data covers only 34% of the simulation domain of 22 km x 0.3 km.
Variography
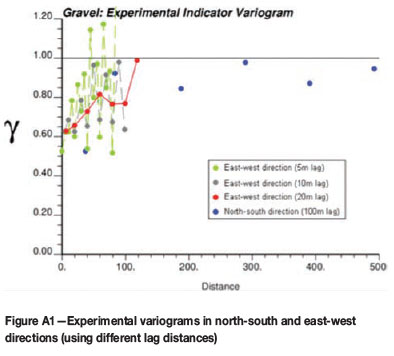
The variography obtained using the drilling data is shown in Appendix A (Figures A1 and A2). The simulated texture based on the variogram structure and conditioning drilling data did not make geological sense, hence additional analog data is considered to supplement the variography interpretation.
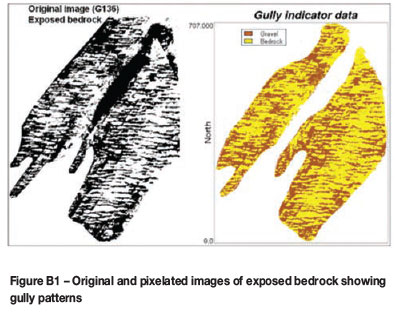
The footwall underlying the diamondiferous beaches is highly gullied Precambrian metasedimentary bedrock. In general, the gullies are filled with gravel and it is fair to assume that gully patterns, as shown in Appendix B, represent gravel occurrence. Appendix B outlines variography obtained from bedrock gully patterns. However, gravel found in gullies is a 'subset' of the total gravel occurrence (as gravel also occurs above bedrock peaks) and cannot be used in isolation. This interpretation was undertaken to obtain a sense of the short-range spatial behaviour and distances over which gravel occurrence is correlated.
In order to further assess the nature of gravel occurrence an 'expert interpretation' method is followed (Prins, 2011). The indicator drilling data (Figure 5a) is interpreted by hand (similar to interpretations involved when building 2- or 3dimensional geological volume models) by geologists with an intimate knowledge of the deposit. In this case, the 2-dimensional interpretation is digitized (Figure 5b) and then pixelated (Figure 5c). The pixelated data set is then used as input data to the variogram calculation and ultimate modelling process (Figure 6).
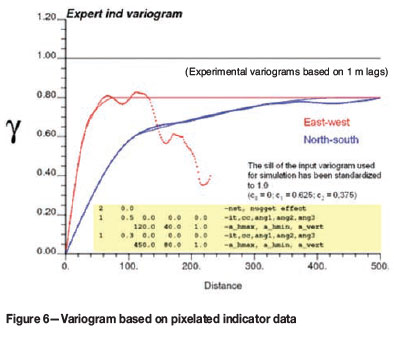
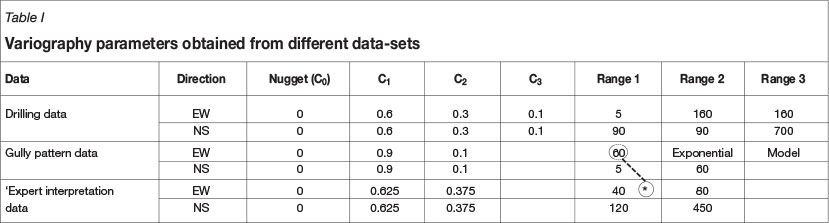
Variogram parameters obtained from different data-sets are summarized in Table I. All variogram models are spherical unless indicated otherwise. The C0 value for all data sets is 0. The C1 and C2 values for the drilling and 'expert interpretation' data is similar at 0.6 vs 0.625 and 0.3 (+C3 (0.1) = 0.4) and 0.375.
In general, analysis of data from previously mined areas shows that about 70% of diamonds occur below bedrock peaks of gullied (fixed trapsite) Precambrian footwall, and diamond occurrence is associated with gravel occurrence. Swash gullies (parallel to the swash direction of the waves -EW direction) are the dominant gully type in the study area. It is thus fair to assume that there should be a correlation between the gully pattern in an EW direction and gravel occurrence.
The range of 60 m for the 'gully pattern' data in an east-west direction concurs with the geometric ranges of 40 m and 80 m as modelled on the 'expert interpretation' data-set. The gully pattern in a north-south direction has a very short range as evident from the texture of the image (Appendix B) of exposed bedrock. In reality there is, however, strong continuity in overall gravel occurrence (marine terraces above bedrock peaks) in a north-south direction governed by sea-level stands. It has been decided, therefore, to acknowledge the variogram parameters observed from the conditioning data and gully patterns, but the variogram obtained from the 'expert interpretation' will be used as a basis for kriging, and to create the simulation, as the parameters are well aligned with the geological interpretation.
Kriging
Kriging of the indicators using the drilled data with zero (gravel absence) and one (gravel presence) is used as a means of visual validation of the simulation outcome as well as to obtain a perspective on the scale and continuity of gravel occurrence. The input to the kriging is the indicator drilling data and the variogram parameters obtained from the 'expert interpretation'.
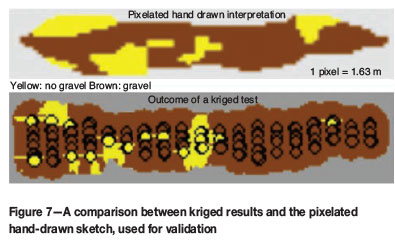
The output of the indicator kriging was re-proportioned in the ratio of 0.77 : 0.23 to convert the kriging results back to indicators of zeros and ones, and to align the output with the zero:one ratio observed in the data (Soares, 1990). The visual similarity between the pixelated hand-drawn interpretation and the kriged result (Figure 7) is deemed to be acceptable.
Simulation
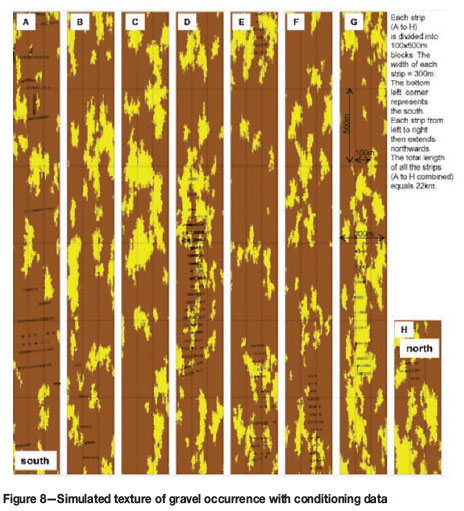
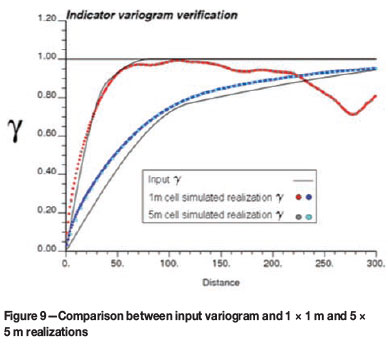
After some experimentation, the most satisfactory simulated texture is obtained when a 5 x 5 m cell spacing is used for simulation. In order to simplify calculations related to the sampling of the simulation, a 1 x 1m cell spacing is preferable. Several attempts at reproducing the input variogram from different realizations (on 1 x 1 m spacing) did not give satisfactory results. Hence, both the drilling data and the 5 x 5m simulated data are used in combination as conditioning data (Tran, 1994) to create a simulation on a 1 x 1m cell size (Figure 8). This approach produced a simulation realization with a spatial structure reasonably comparable to the input variogram (Figure 9), albeit not perfect. The deviation from the original input variogram is deemed acceptable in light of the type of study undertaken, the approach followed, paucity of data, and inability to obtain an acceptable variogram from the drilling data in creating the simulation.
The zero:one proportion for the simulation is very close to that of the conditioning data and the mean of the simulation is 0.7875. The success of sample campaigns will be measured against this average of 0.7875.
Sampling of simulation and measure of success
Different sample strategies can be tested using the created simulation to determine which best predicts gravel occurrence. A measure of success of a sampling campaign is required and for this, different scenarios were used.
Trumpet curve
Consider the outcomes of 100 sampling campaigns, each using a different offset for the origin when sampling the simulation. A different sample configuration for each of the 100 campaigns (Table II) is used and for each realization the estimated percentage of gravel for the domain is plotted.
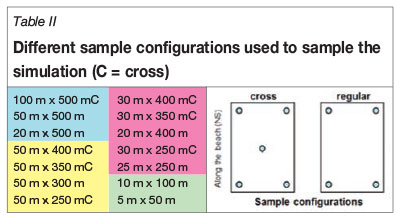
Figure 10 shows a trumpet curve with the different sampling realizations and estimates for the proportion of gravel for the entire simulated domain. The trumpet curve is a relative comparison of one campaign against another and is not meant to give a measure against a 15% accuracy benchmark.
Use of kriging and correlation coefficients to rank the efficiency of different sample configurations
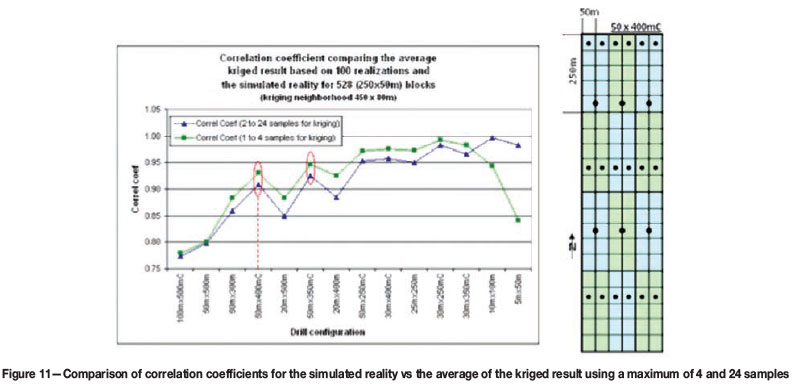
Two strategies of search criteria were used in estimating the percentage gravel for blocks of 50 x 250 m through kriging (based on 100 realizations created by offsetting). A small neighbourhood, using not more than the nearest four samples, and a second strategy, using up to 24 neighbours, were used in the kriging. The estimates from the kriging exercises were plotted against the 'actuals' determined from the simulation and the correlation coefficients calculated.
Figure 11 shows a higher correlation coefficient when comparing the kriged results, using a maximum of four samples, than when comparing the kriged result using 24 samples against the simulated reality (except for the highly dense sampling campaigns based on 10 x 100 m and 5 x 50 m sample configurations). The 50 x 400 m C sample configuration is interpreted to be relatively efficient.
Interpreting the results shows that a smaller search neighbourhood has better correlation with 'actual' than using a large search neighbourhood. Furthermore, the kriging exercise confirms that reasonable results can be obtained using a sample spacing of 50 x 400 m C.
Summary and interpretation of results
This study does not provide a single optimization result with defendable confidence limits, as the nature and lack of conditioning data do not permit this. Different validation approaches, however, resulted in the creation of a simulation on which a comparative study could be done. The results gave a very good indication of how to balance sampling effort with de-risking aspects related to different sampling configurations, and the determination of gravel occurrence and geological continuity.
The simulation obtained from using only the drilling data and associated variogram did not make geological sense; hence, it was decided to make use of analog data in order to create a more acceptable simulated reality which is geologically acceptable. The first analog data used is the gully patterns and the second analog data-set used is the 'expert interpretation', as outlined in Figure 5. This was used to parameterize the simulation to produce a geologically acceptable outcome, which was sampled and analysed to determine a relative efficient sample configuration.
The trumpet curve (Figure 10) shows that a sample spacing of 50 m x400 m C is relatively efficient (compared to other sample configurations) and when used as input to kriging, is also considered as being relatively efficient.
The 50 x 400 m C configuration will give a well-balanced indication of sampling effort and risk aspects related to geological continuity, and will be implemented in future sampling strategies. As more sample data becomes available from PDP campaigns, the 'expert interpretation' will systematically and incrementally be replaced by more conventional simulation studies and the sample strategy revisited.
Acknowledgements
The authors would like to thank the Namdeb Mineral Resource Department for its support and providing access to data. The work presented in this paper forms part of a larger project partially incorporated in a PhD study.
References
Jacob, R.J. 2011. Namdeb Business Plan Technical Report (BPTR) for 2011 FINAL. Namdeb Internal Docs: #103352. [ Links ]
McCallum, K. 2011. MRM CHQ Additional Assurance Note to the Namdeb Business Plan 2012 to 2020. Namdeb Internal Docs: #104078. [ Links ]
Prins, C.F. 2011. Échantillonnage, simulation et estimation des gisements secondaires de diamante. Geostatistics Doctoral Thesis, School of Mines of Paris. [ Links ]
Soares, A. 1990. Geostatistical estimation of orebody geometry: morphological kriging. Mathematical Geology, vol. 22, no. 7. pp. 787-802. [ Links ]
Tran, T.T. 1994. Improving variogram reproduction on dense simulation grids. Computers and Geosciences, vol. 20, no. 7-8. pp. 1161-1168. [ Links ]
Appendix A - Variography based on drilling data
Experimental variograms
The input drilling data comprises multiple spatial configurations, but, very roughly, the majority of data is spaced at 50 x 20 m.
East-west direction
The spacing of the various drilling campaigns varies in the east-west direction. Multiple lag distances have been tested in the variogram calculations in order to obtain the most satisfying spatial structure in terms of detail and structure stability. Lag spacings of 5 m, 10 m, and 20 m have been used (Figure A1). The result from using a 20 m lag spacing, is deemed to be the most stable structure, which also represents the average structural shapes of the 5 m and 10 m lag spacing. Due to the complexity in modelling the variogram, the 5 m, 10 m, and 20 m data have been overlaid to help guide the variogram fitting.
North-south direction
The domain size is about 22 km in a north-south direction. There are areas of up to 6 km in length with no data present, with other areas having sufficient data to enable the use of a lag spacing of 100 m.
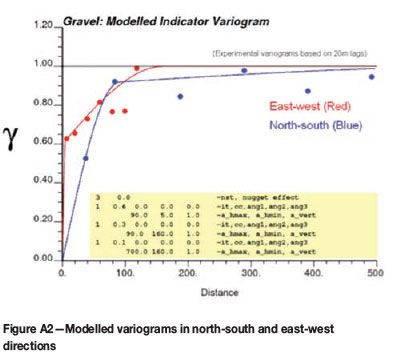
Modelled variograms
The best fit obtained to the experimental variogram points is shown in Figure A2.
Although a model could be fitted to the experimental variogram points, the parameters to enable a fit through the points near the origin (distance close to 0 m), and the geometric anisotropy did not make geological sense. Considering other fits, for example modelling the nugget effect value at 0.6 (plus geometric anisotropic structures), would result in a simulation that will not have continuous gravel occurrences, which would not be comparable to real observations.
Geological knowledge of the continuity and size of gravel occurrences needs to be introduced into the determination of an appropriate variogram model. This is done through the introduction of 'expert knowledge' captured as a hand-drawn sketch.
Appendix B - Variography of gully patterns
An aerial photograph of exposed bedrock was used to create an indicator data-set of gravel/no gravel occurrence, in the form of a pixel map. A variogram was calculated using this interpretation of gullies as proxy to gravel occurrence and the output analysed.
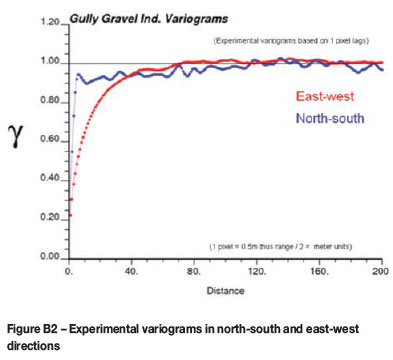
The practical range for an exponential variogram model is interpreted as 3 x modelled range. In this case, the practical range was determined as a 60 m range in an east-west direction. (A scaling factor of 0.5 is used to translate the pixels to real space and a range of 40 m was modelled).
It should be kept in mind that gully patterns represent a subset of overall gravel occurrence. The range of 60 m in an east-west direction broadly concurs with the ranges of 40 m and 80 m as obtained from the 'expert interpretation data-set' calculated in an east-west direction. The gully pattern in a north-south direction has a very short range, but this is due to the texture of the above image of the exposed bedrock. In reality, there is great continuity in overall gravel occurrence in a north-south direction governed by sea-level stands.
The occurrence of gravel in bedrock gullies was analysed to broaden the understanding of variogram behaviour, and to help determine and double-check the reasonableness of parameters determined from the 'expert interpretation'.

