


Servicios Personalizados
Articulo
 Inglés (pdf)
 Articulo en XML
 Referencias del artículo
Indicadores

Links relacionados
-
 Citado por Google
 -
 Similares en Google
Compartir

 Permalink
Journal of the Southern African Institute of Mining and Metallurgy
versión On-line ISSN 2411-9717
versión impresa ISSN 2225-6253
J. S. Afr. Inst. Min. Metall. vol.114 no.1 Johannesburg ene. 2014
SAMPLING AND ANALYSIS PAPERS
The 'simulated chip - sample model' as a method for quantifying error and bias in sampling thin carboniferous reef types
D. FourieI; R.C.A. MinnittII
ITarget 1 #, Harmony Gold Mine, Allanridge
IISchool of Mining Engineering, University of the Witwatersrand, Johannesburg, South Africa
SYNOPSIS
A brief history of channel sampling in South African gold mines is followed by a chronicle of different sampling events and sampling methods that used the traditional 'hammer and chisel' approach as well as diamond core extraction of the sample. The problems associated with each method of sample collection are documented and the use of a laser scanner to measure the exact volumes of sample material extracted from a correctly delimited sample site are considered. Areas where increment delimitation errors (IDEs), increment extraction errors (IEEs), increment weighting errors (IWEs), and increment preparation errors (IPEs) occur were investigated. A 'simulated chip sample model' is introduced and provides the basis for comparing the percentages of error introduced as a result of improper sampling. The heterogeneity experiment showed that reefs that are more homogenous tend have lower extraction errors than the more complex carbon-rich reefs, which may contribute to understanding the poor mine call factor on mines exploiting the latter types of reef.
Keywords: channel sampling, chip sampling, error, bias, modelling.
Introduction
The current protocol for underground channel sampling practiced on most South African gold mines is the collective result of work done during the last 100 years. The historical development of the chip sample in the South African gold mining industry has been well documented by Cawood (2003) and shown to be aimed at extracting a reef specimen that will allow the best possible measurement of grade at that location. These protocols are still practiced on most of the South African gold mines today, where the preferred tool for sample extraction is the hammer and chisel. The large number of samples required for estimation, as well as the difficult underground environment and conditions, favour chip sampling because it is fast, cost-effective, and is still considered a good sampling practice.
Historical work
The gold mining industry relies on channel sampling of the stope faces to provide an indication of gold grades that can be anticipated in the reef that lies ahead of the production crew. This is essential for evaluation processes, and where selective mining is practiced it also provides the necessary information about whether the reef should be extracted or left in situ. In effect, a series of continuous channel samples collected from a raise or stope face may be thought of as a highly heterogeneous, one-dimensional stream that is cut at regular intervals, rather than a static two-dimensional face. The purpose of the project reported in this paper was to undertake channel sampling using the current method of choice - the hammer and chisel - and to see if the sample demarcated could be extracted accurately. The aim was to see if the current in situ channel sampling protocol could be achieved in practice underground.
Poor sampling practice has for a long time been considered to be among the reasons for a poor mine call factor. A number of investigators have tried to demonstrate that poor sampling is indeed responsible for over-estimation, especially in the narrow carboniferous-type reefs. Cawood (2003) stated that 'The literature survey revealed that, given the nature of narrow carboniferous-type reefs, traditional gold mine sampling techniques are likely to over-estimate the gold content in the reef by as much as thirty per cent. This was based on the observation that samplers tend to oversample the soft reef portions and undersample the hard host strata. Magri and McKenna (1986) as well as Lerm (1994) examined a variety of 'sampling tools' but they expressed reservations about the ability of such tools to extract an unbiased sample. These investigators favoured the 'rock saw' above standard chip sampling because of the ability to extract a more representative sample once the outlines of the sample had been delimited using the rotary diamond saw. De Jager (1997) and Storrar (1981) were aware of this limitation with the sampling tool, saying that 'a reasonable approximation is generally accepted to be satisfactory.' During the late 1970s and early 1980s a non-destructive X-ray technology for analysing the gold grade, known as the Gold Analyzer, was strongly promoted through the Chamber of Mine Research Organisation (COMRO). However, the inherent variability of the reefs is such that statistical evidence to demonstrate the superiority of one method over another was inconclusive (Lerm, 1994). All the investigators mentioned above recommend that that the sample mass should be increased, especially when sampling thin, narrow carbon-rich reefs to obtain a larger sample support. Most of them also recommended renewed efforts in regard to training and supervision of the sampling process.
Sampling correctness
The only way of ensuring that a sampling protocol has minimal error is to make sure it complies with the principles of sampling correctness, and to test its practical implementation underground. The principles of correct sampling require that 'every part of the lot has an equal chance of being selected in the sample and the integrity of the sample is preserved during and after sampling (Smith, 1987, p. 19). Smith (1987) further says that correct sampling is achieved by correctly defining the sample to be taken, and then physically obtaining the sample that has been defined. She also mentions that if any part of the lot becomes inaccessible or if the sampling tool fails to collect a sample correctly defined, the rules of random sampling have been compromised and this can introduce a bias.
Pitard (2009) also stresses the importance of complying with principles of sampling correctness, warning that during this important phase of sampling, additional error may be introduced, which is cumulative. These errors are the most dangerous and include the increment delimitation error (IDE), the increment extraction error (IEE), the increment preparation error (IPE), and the increment weighting error (IWE).
Challenges of underground sampling
A development raise situated in the northern Leeuwbosch area of Harmony's Tshepong mine was selected for this project. The Basal Reef member or Basal Reef Zone (BRZ) is the sequence of quartzites and subordinate conglomerates that lie on an unconformity surface marking the top of the UF1 Zone 1 footwall quartzites of the Welkom Formation. The top of the BRZ is represented by the overlying Harmony Formation, either as the Khaki Shale member, or locally the Waxy-brown Leader Quartzite (WBLQ) member. The BRZ across the Tshepong Mine area is a stratabound unit varying from 40 cm to over 200 cm in thickness. The BRZ typically comprises a basal conglomeratic unit that sits on the UF1 footwall unconformity. This is overlain by clean coarsegrained gritty quartzites. Above these quartzites a second unit, frequently less well developed, is present. This second upper unit appears to be better developed in the south of the mine area.
Two facies types have been recognized in the area. The first is known as the Black Chert Reef (BCR) facies. The other is the Lorraine Reef, which is universally present in the extreme north of the mine area and it is typically a thin oligomictic quartz pebble lag which also contains carbon, pyrite, and gold mineralisation. Overlying this lag are distinctive white cross-bedded placer quartzites and a poorly developed upper cycle may also be present.
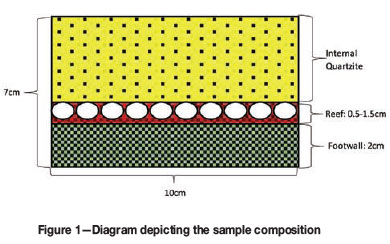
A total raise length of 20 m was sampled at 20 cm intervals with an additional section every 50 cm. The channel width ranged from 0.5 to 1.5 cm and a total of 120 samples were chipped with a sample width of 7 cm (2 cm footwall + reef + internal quartzite) (Figure 1).
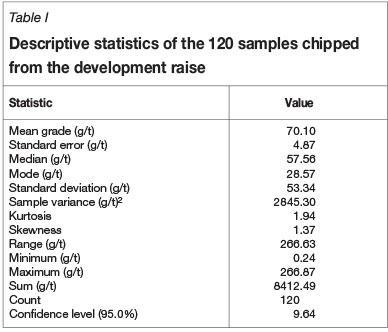
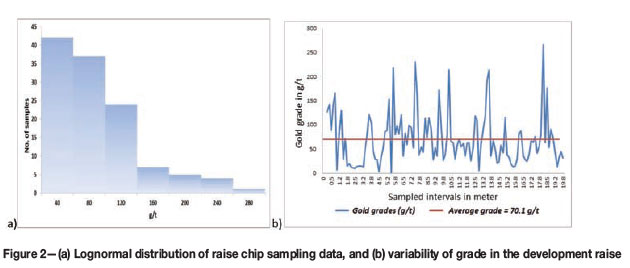
Descriptive statistics provided in Table I suggest a lognormal distribution for these samples, a fact that is confirmed by the shape of the histograms for the grade shown (Figure 2a).
The strong variability of gold grades for samples taken less than 20 cm from each other is a function of the nugget effect and is expected for this type of deposit (Figure 2b).
The standard sampling protocol (Harmony Gold Mining Company Limited, 2006) requires that the sample must be rectangular in shape with solid square corners and should be chipped to an even depth. Out of a total of 120 samples chipped not one sample met the prescribed standard, to be exact not one sample chipped matched any of the other samples chipped in terms of shape, composition, volume, or mass. The standard tool of choice on most of the gold mines is still the hammer and chisel (Figure 3a). The hardness of the reef and its host rocks was too much for the hammer and chisel. The sampler and his team tried as best they could, but only managed to remove material that was already fractured or loose. The author did not observe any sample that was removed from a solid area on the face, and any attempt to do so only resulted in a white spot where the chisel had chipped the surface of the rock. Such a chipped white spot is shown inside the yellow marked sample in Figure 3b.
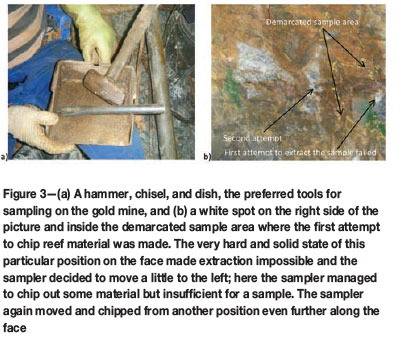
The hardness of the rock prevented any samples from being collected at this exact location shown in Figures 3b and 4b. As a result, the sample position had to be moved continuously to the left until the rock was sufficiently fractured to allow a sample to be collected. According to a sampler, 'We do not trim the section to be sampled, otherwise it's too difficult to collect sample material'.
Obstructions such as piping and services are other factors affecting the team's ability to take proper samples. Although the face may have been accessible in some places, these kinds of obstructions made it impossible to swing a hammer and use a chisel to do the sampling. In places the reef contact was very close to the hangingwall, which meant that the crew had to build a temporary scaffold in order to take a sample. Blast-induced fracturing may also influence the integrity of a sample. Loosened pieces of rock outside the delimited sample area can dislodge during the hammering and chipping process and fall into the collection pan, so becoming part of the sample. The ambient temperature in excess of 30°C with very high humidity means that the sampling team has to function for protracted periods in difficult physical conditions. This leads to a significant decline in the team's ability to perform high quality sampling activities continuously. Some members of the sampling team began chipping single samples from a variety of positions and members began to quarrel among themselves as fatigue and heat exhaustion took their toll.
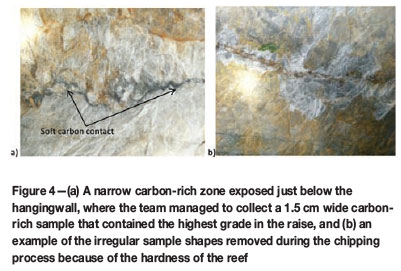
The commonly reported error of oversampling the softer carbon-rich reef was observed only at one sampling section (Figure 4 a). The reef contact for this particular section was on the hangingwall contact and the entire sample mass was removed from the soft contact at a sample width of about 1.5 cm. The grade of 266.2 g/t returned for this section was the highest of all the 120 samples, and if this grade is allocated to an incorrect width of 7 cm then the true cmg/t value would be overstated by almost 467%.
Laser scanner
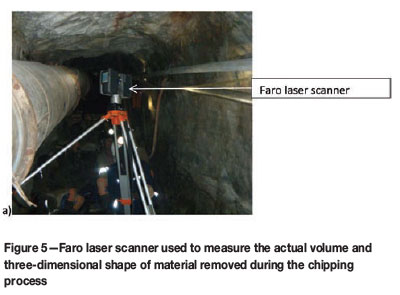
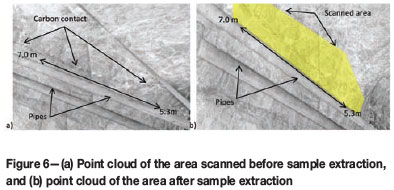
The Faro laser scanner was used to scan the face before and after each sample was chipped (Figure 5). This 'before' (Figure 6a) and 'after' (Figure 6b) comparison is a useful visual tool for comparing the actual shape and size of the sample removed during the chipping process (Figure 6). This scan represents a portion of the raise between 5.3 m and 7 m. The irregular shapes of samples that were removed during chipping process are clearly visible in Figure 7.
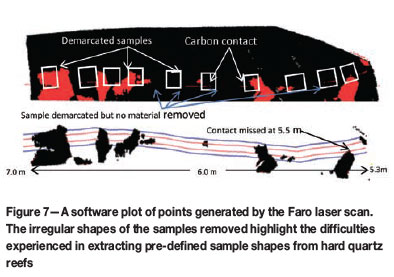
The irregular shapes in Figure 7 depict the actual volumes of sample material determined by the scanner as having been removed during the chipping process. The white squares represent the demarcated samples and red irregular shapes are the boundaries of the actual sample material removed.
It is interesting to note that for some of the samples demarcated, no material was removed, suggesting that the material was collected at a different position. Not a single sample extracted complied with the required geometric shape defined in the protocol. This means that there is significant extraction error associated with the process. The first sample on the diagram at the 5.5 m position missed the reef contact completely, and this observation is supported by the very low grade of 0.239 g/t for this sample (see variability plot, Figure 1b).
Alternative tool tested
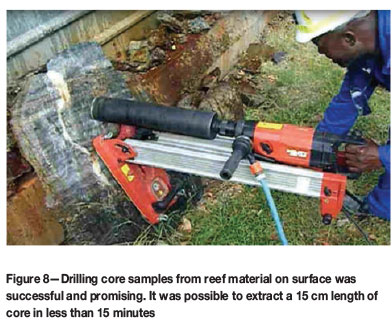
The alternative sampling tool tested for this project is the DD130 diamond coring tool from Hilti, which is capable of drilling and extracting sample core with diameters of 8-162 mm. The tool's capabilities were tested on surface and it managed to drill a 15 cm core with a 65 mm diameter from a basal reef slab in less than 15 minutes (Figure 8). Apart from the fact that the tool is heavy and cumbersome, underground testing proved difficult because the power supply for the coring tool was incorrect, there were difficulties mounting the drill in a confined space, and the combination of water and electricity creates a serious safety hazard.
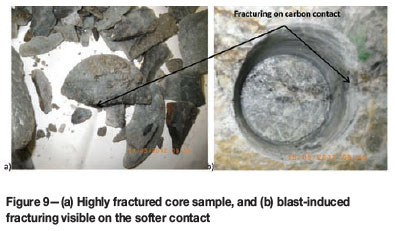
Once these problems had been resolved, it was possible to extract only five fractured samples in a period of three days. The natural fracturing on the softer carbon contact is clearly visible in the photograph (Figure 9b), and the samples tend to break along this contact, resulting in most of the exposed carbon being washed away (Figure 9a). In view of these constraints it is felt that core drilling is not a viable substitute for the current chip sampling process.
Findings
The practical implementation of the sampling protocol with the current tools of choice, the hammer and chisel, failed in all of the aspects defined in principles of sampling correctness. Instead of achieving a representative groove (channel) at regular intervals, samplers are performing a variation of 'grab sampling' at irregular intervals. All the errors observed during the underground sampling process have been classified according to the taxonomy of errors identified in the Theory of Sampling.
Increment delimitation error (IDE)
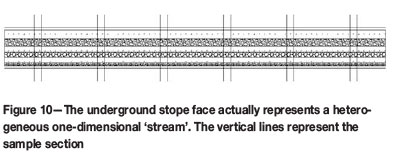
In order for a sample to be correct, every increment making up the composite sample must have exactly the same chance as every other increment of becoming part of the sample. This principle can be upheld only when sampling zero- or one-dimensional lots. While the stope face may be thought of as a continuous one-dimensional lot, it is not a lot that can easily be sampled or cut. In our understanding of particulate sampling, one-dimensional lots are usually confined to a conveyor belt, where the particulate nature of the materials on the belt means that they can easily be sampled using cross-belt or cross-stream samplers. In the case of a solid in situ stope face, the only portion of the face that has a chance of being sampled is that which is immediately exposed in the face (Figure 10). Samples to be collected from such a lot may be considered to be equiprobabilistic, but the physical constraints on their extraction make equiprobabilistic sampling almost impossible.
The difficulties associated with sampling in the given environment are amplified due to the limitations of the sampling equipment, because only portions of the exposed face that are fractured or soft enough can be extracted; other exposed portions on the face that are solid are unlikely to become part of the sample.
Marking of the section or sample to be sampled is just a routine operation, and even if the sides of the channel sample are carefully demarcated it is not possible to chip the material within the channel sample to an even depth. Instead, samplers actually undertake a form of grab sampling on selected areas of the 'stream' determined by how fractured it is. They will even collect sample material outside the demarcated sampling area. The deviation of the sample shape and volume extracted from that specified by the sampling standard contributes significantly to the bias of the sample.
Increment extraction error (IEE)
This error occurs when the sampling tool is selective or unable to extract a sample of the correct shape and volume as defined by the sampling standard. The sampling equipment must be able to extract the correctly delimited sample. A comparison between sample mass extracted and sample mass required is also a good indication on the IEE (Figure 11).
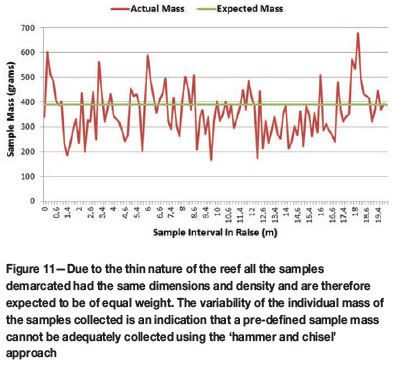
During the sampling exercise samplers did their best to comply with the requirements of the sampling standards. The mass that was expected to be extracted according to the sample dimensions of 10 cm x 7 cm x 2 cm and at a relative density of 2.78 was 389 g, whereas the actual mass collected ranged from 166.6 g to 677.3 g with an average of 362.7 g. This means that 65% of the samples were below the specified mass. Images from the Faro scan also show the highly irregular shapes that result from using a hammer and chisel as a means of extracting a sample from the hard conglomerate reef (Figure 6). This relatively simple sampling exercise provided a clear indication that it is not possible to meet the specifications of the current sampling standards, in terms of mass, volume, and shape, using the commonly applied hammer and chisel.
Increment preparation error (IPE)
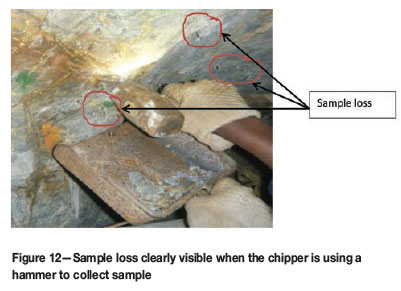
IPEs are introduced between different stages of the sampling process or sample handling, and arise because of contamination, material losses, changes in the physical composition of the sample, human error, ignorance, carelessness, fraud, and even sabotage. IPEs observed during the sampling exercise were related mostly to contamination by fragments or pieces of reef that were dislodged from around the area being sampled. In cases where the reef is very hard the hammer is used directly on the reef face to loosen material for the sample, increasing the chance of contamination and sample loss (Figure 12).
It was also observed that when the sampler had collected sufficient material in the sample dish, he would select some of the bigger pieces, breaking them into smaller pieces by hitting them with the chisel on his leather glove. He then selects pieces, mostly waste, to be discarded until he believes he has sufficient sample mass. Breaking the bigger pieces on the leather glove also increases the possibility of contamination as fine gold grains can be trapped in the leather and the seams of the glove. The collecting dish is cleaned after each sample, thus there is very little chance that fine gold will adhere to the metal surface of the dish compared to the leather glove. Sample losses of one form or another were observed at most stages of the sampling process.
Increment weighting error (IWE)
The hardness of the reef in most areas means that extracting an acceptable sample is very difficult indeed. Because the reefs are very narrow in some places it may be necessary to take only a single sample to represent the section, but elsewhere thicker reefs may have to be sampled using multiple composited samples, as shown in Figure 13a. A section across a composite reef, such as that shown in Figure 13a, should be a cleanly cut sample across the entire channel width. Instead, because of the hardness of the ore, the section consists of scattered portions of reef extracted in a haphazard way (patches shown in black) with highly irregular shapes and sizes (Figure 13b). Poor extraction or recovery for each individual sample extracted and then composited may lead to a bias generated by an IWE (Pitard, 2009, p. 158).
Quantifying the error
Observation of the underground sampling process demonstrated that sample extraction using a hammer and chisel is beset by IDEs and IEEs, but finding a method of quantifying the errors remained a challenge, especially in the light of Lord Kelvin's comment, 'If you can't measure it, you can't improve it. Only if the observed IEE is converted into a quantitative measure will it be possible to convince people of the bias associated with this sampling method.
'It is easier to perceive error than to find truth, for the former lies on the surface and is easily seen, while the latter lies in the depth, where few are willing to search for it: (Johann Wolfgang von Goethe).
A moment of enlightenment
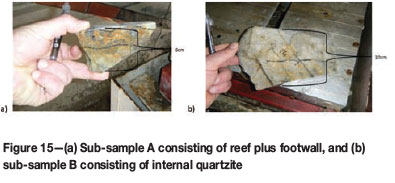
A single sample of 16 cm (Figure 14a) collected from the face during the sampling project was cut into two individual samples, sample A (shown in Figure 15a) consisting of a footwall waste and reef portion, and sample B (shown in Figure 15b) consisting mostly of internal quartzite.
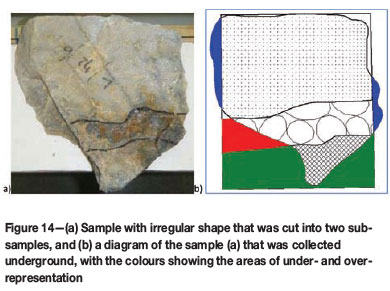
The sample diagram (Figure 14b) indicates that this particular sample does not correctly represent the sample width (or volume). The portions shown in red and green colours are the under-represented areas of the reef and footwall , while the blue area indicates over-representation of the internal quartzite.
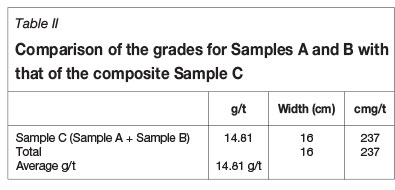
The sample width for the internal quartzite was approximately 10 cm and for the footwall plus reef portions it was about 6 cm. The two samples were weighed and assayed and the result was weighted according to the sample mass. The reef plus footwall sample (Figure 14a) returned a grade of 143.7 g/t and the internal quartzite (Figure 15b) delivered a grade of 0.2 g/t. The remaining pulps of the two samples were combined (Sample C) and bottle-rolled for 48 hours before being assayed. Sample C returned a grade of 14.81 g/t. The original sample would have returned a grade of 14.81 g/t over a sample width of 16 cm, giving a value of 237 cmg/t (Table II). The combined results for sample C is lower than that of the individual Samples A and B, as shown in Table II.
This is acceptable and standard procedure, but the same sample having been cut into two sub-samples and sent for analysis, sample A returned a value of 0.2 g/t over a width of 10 cm, and sample B returned a grade of 143.7 g/t over a width of 6 cm. The combined value for the two individual samples is 864 cmg/t, a difference of 365% (Table III).
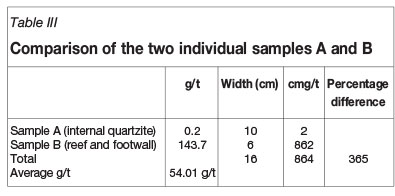
Both values returned from the laboratory are correct and are representative of the material submitted. The actual error is introduced as a result of allocating this value back to a three-dimensional shape or volume. This simple example is a clear indication that error is introduced if a width is applied to an irregular-shaped sample and is a classic example of IWE. Perfect extraction of the 16 cm width would have returned a different grade altogether.
The 'moment of enlightenment' paved the way for the following experiments to quantify the error associated with poor extraction. An obstacle in the quantification of error associated with a specific tool is the uncertainty of the value introduced by the inherent variability of the reef - namely the nugget effect. The only solution to this dilemma would be to simulate the 'perfect chip sample' at a known grade, which we refer to as the 'simulated chip sample model' (Figure 16). Different scenarios of over- or under-extraction possibilities can be simulated and compared to the actual grade and the difference or error can be expressed as a percentage.
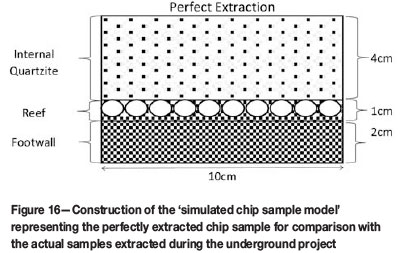
The dimensions of 10 cm x 7 cm x 2 cm for the simulated sample are based on current protocols. The sample is then subdivided into its observed underground lithology with an internal quartzite width of 4 cm, an average reef width of 1 cm, and a footwall width of 2 cm (Figure 16).
The reef portion is assumed to be homogenous at a grade of 150 g/t. Table IV provides a calculation on how the perfect sample was constructed. The results from the perfect sample can now be used as the base to test the error involved with incomplete or over-extraction of any of the units making up the sample.
Probability of under- or over-sampling
There are numerous reasons that could be called on to explain the over- or under-sampling of each component of the 'simulated sample', and quantification of each percentage deviation from the perfect sample is not possible. For this exercise, however, it was decided to simulate six possibilities for under-sampling (Figure 17) and six possibilities for over-sampling (Figure 18).
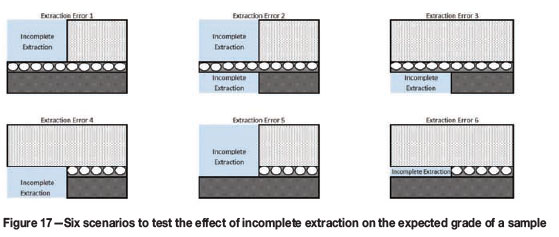
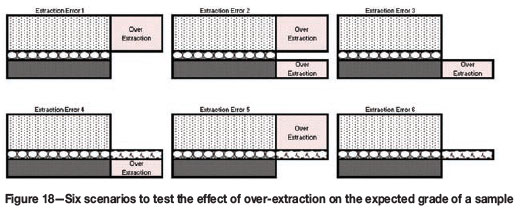
The six probabilities will quantify how the error would change as a result of over- or under-extraction of these units in different combinations. The differences in values are then expressed as a percentage error.
Different extraction errors are simulated for each component of the perfect sample and the difference in value is then compared back to the expected grade and expressed as an error, which may be positive or negative. This simulation will give some indication on the percentage error introduced with poor sample extraction, especially for this type of reef with this specific reef-to-waste ratio. The third dimension (the depth) was kept constant for this exercise, but in reality it is also considered a factor that could influence the error associated with poor extraction. The percentage errors generated due to improper extraction for the different probabilities shown in Figures 17 and 18 are summarized in Table V.
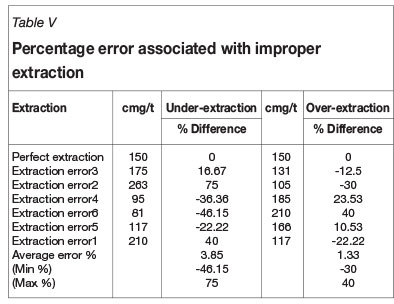
This exercise confirms the effect that poor extraction alone can have on the credibility of a sample value. Any deviation from a pre-defined sample size, shape, and volume will introduce error. In this specific example, 'extraction error 2' as calculated in Table V, the true expected value can be overstated by as much as 75%, and understated by as much as 46.15% in 'extraction error 6'. A closer look at 'extraction error 2' in Table V reveals that the waste portions are under-represented.
It was mentioned earlier that picking of reef and discarding of waste from the sample after the sampling activity was completed is a common behaviour. A sampling team that consistently performs reef-picking at the sample level will introduce enormous biases to the assay results. This exercise indicates that the error incurred with the under-extraction of certain units of a sample may be more severe than that found with the over-extraction of the same units.
Importance of sample shape
It was mentioned previously that the irregular shapes of samples extracted are a major source of bias and error. Any sample that deviates from the rectangular shape, even though the aspect ratio may change, will introduce bias. Initially it was thought that the irregular shapes were responsible for the error because they varied in mass and volume and basically constitute a different support. Although the underground drill core exercise failed to deliver any acceptable core for assay purposes, it was decided to test a theoretically correct piece of core that was drilled horizontally to see if it would pass as being a representative sample.
Most underground drilling, except for cover drilling, is aimed at intersecting the reef perpendicular to the bedding, whereas in extracting core samples from a near-vertical stope face the drill penetrates the reef parallel to the bedding. This drilling orientation combined with a highly heterogeneous reef type introduces extraction errors that would make this method unsuitable, even if a perfect cylinder of core is extracted. This is better explained with the aid of a diagram representing a core sample that is drilled horizontally into a vertical stope face and parallel to the bedding, that hosts a thin 1 cm reef in the middle of the core (Figure 19a). The core diameter is 7 cm.
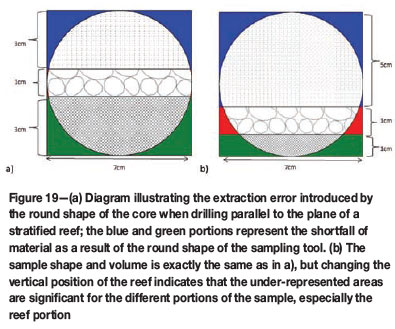
The blue and green areas in Figure 19a are under-represented portions of the footwall and internal quartzite for that particular core sample; the sample would be biased towards the reef portion with the waste portions being under-represented and would probably overestimate the actual grade. In Figure 19b the core sample has the same shape, volume, and dimensions as in Figure 19a, but the reef is now positioned closer to the bottom of the core barrel. The areas of green and blue, as well as the portion shown in red which refers to the reef, are the under-represented portions.
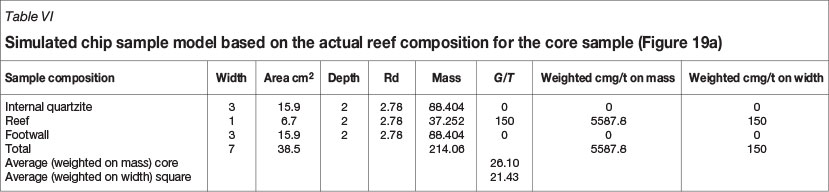
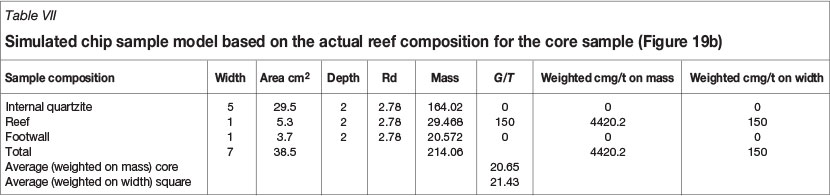
A simulated chip sample model was calculated for the theoretical core values expected in Figure 19a and Figure 19b. The only difference between the two diagrams is the position of the reef in the core. Perfect extraction of the core is assumed at a depth of 2 cm for both examples, thus they would be equal in volume mass and shape. The area for the waste portion and the area for the reef portion were calculated and multiplied by the grade to obtain the average grade for both the core samples and the square 7 cm x 7 cm samples. The grade for Figure 19a was 26.10 g/t (Table VI) which is an over-estimation of 21.8% compared to the actual grade of 21.43 g/t. Figure 19a indicates that the reef was also positioned close to the center of the core and would introduce an over-estimation bias.
The grade for Figure 19b is 20.65 g/t (Table VII), which is an under-estimation of 3.6% compared to the actual grade of 21.43 g/t. The actual grade calculated for the square 7 cm x 7 cm sample does not change even if the position of the reef within it moves up or down. The values for the round core samples are sensitive to the position of the reef within the sample itself. It is concluded that even with perfect core extraction the very shape itself introduces error and cannot be considered an acceptable sampling alternative to the traditional rectangular sample extracted using a hammer and chisel.
This error would be aggravated if on a thicker reef it had been necessary to drill multiple composited core samples.
Heterogeneity experiment
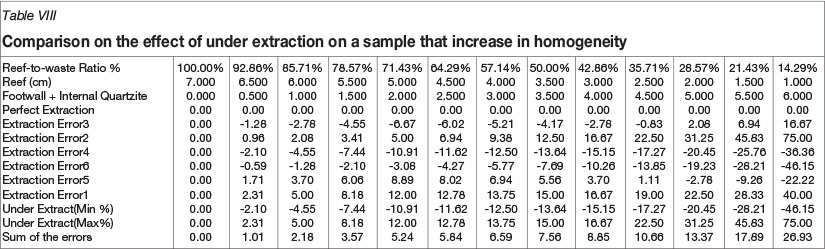
By changing the reef-to-waste ratio in the models of possible over- and under-extraction shown in Figures 17 and 18, it was found that the percentage extraction error changed accordingly. Further experimentation revealed that the percentage error tends to decrease as the sample composition become more homogenous. 'Extraction error 1' (Table V), is used to explain the rationale behind this exercise (Table V; Figure 20). The initial simulated chip sample model had a reef-to-waste ratio of 14.29% based on a 1 cm reef and 6 cm waste portion and incomplete extraction, resulting in an extraction error of 40% compared to that for reef-to-waste ratio (Table VII). The reef thickness was increased slightly to 1.5 cm and the waste decreased to 5.5 cm, and this resulted in a reef-to-waste ratio of 21.43%. The simulated chip sample model was updated with this new information (reef and waste changes) and a new expected grade was calculated. The same incomplete extraction was simulated and resulted in an extraction error of 28.33% compared to the perfect sample, or base case for the simulated chip sample model. This process of increasing the reef width was repeated for 'extraction error 1' until it reached total homogeneity or 100% reef. The same was done for the remaining under- and over-extraction errors, and the results are shown in Table VIII and Table IX.
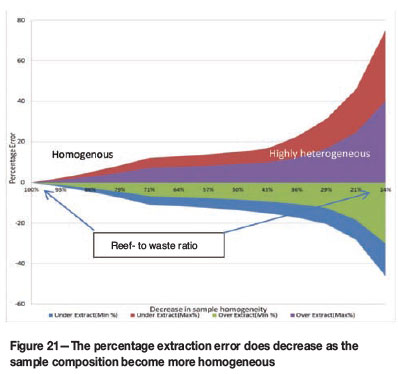
This exercise confirms the possibility that the percentage extraction error decreases as the sample becomes more homogeneous, reaching only about 10% when the reef-to-waste ratio for under-extraction' is more than 78% (Table VIII) and for the 'over-extraction' at around 42% (Table IX). This may well explain why shafts mining the more homogenous reefs i.e. VCR, A, and Elsburgs can maintain mine call factors close to 100% even though they use the same sampling technique. Although they probably incur the same extraction errors as other shafts, the inherent nature of their reefs means that the effects of heterogeneity are not as severe as those experienced on the mines exploiting thin carbon reef types.
The maximum percentage extraction error is always higher than the lowest percentage error and may indicate an inherent bias due to this specific reef composition of thin reef surrounded by waste. This exercise also seems to confirm the suggestion made by Lerm (1994) that oversampling or increased sample mass are prone to lowering the percentage extraction error on average, which is also evident in Figure 21.
Conclusion
Experimental work, not only ours, but that of others in the past, has shown that the chip sample method that has been used in South African gold mines since their inception is flawed in its ability to extract a perfect sample. The 'simulated chip sample model' provides a theoretical example of the perfectly extracted chip sample. The model was used to demonstrate that the tools of sampling, namely hammer and chisel, are inadequate to perform acceptable extraction and constitute the source of virtually all error.
The heterogeneity experiment confirmed that the error and bias associated with poor extraction are more severe when a sample composition is highly heterogeneous, and become almost negligible when the sample composition becomes homogeneous. This is an indication that the chip sample method can be used on certain reefs like the Elsburgs and VCR with great success, but it signals a warning that chip sampling is not the recommended method for sampling thin carboniferous reefs and the results should be treated with caution.
There is a presumption that the error generated from chip sampling method will cancel itself due to the large number of samples collected. This can be true only if there is no bias introduced during the sampling stage. Picking of reef and discarding of waste from the sample after sampling will introduce enormous biases to the assay results. This exercise indicates that the error incurred with the under-extraction of certain units of a sample may be more severe than that found with the over-extraction of the same units.
Other methods for sample extraction have been considered and were also found to be inadequate.
However, we must also accept that the hammer and chisel is the only method that allows us to collect samples in a very difficult environment and until now there has been no alternative method. If we accept this, then the only solution is to understand the limitations of the method and try to deal with it on a case-by-case basis and try to minimize the errors.
In conclusion, the following important lessons were learnt during this experiment when sampling thin carboniferous reefs:
a. It is essential to minimize waste in the sample
b. It is essential that the entire reef marked out is included in the sample, i.e. that the IEE is minimized c. Samplers and chippers should be periodically retrained on quality standards and sampling
d. The chipped area should be re-measured if possible
e. Discarding of waste portions should be stopped because it may introduce bias
f. Actual chipped mass should be compared to theoretical mass
g. For this specific reef type it is better to oversample rather than under-sample;
h. Supervisors should perform regular Planned Task Observations (PTOs) on samplers.
References
Cawood, F.T. 2003. Underground face sampling on narrow gold reefs. Sampling practice and its impact on the Mine Call Factor on Witwatersrand gold mines: Lessons learned. Journal of the Institute of Mine Surveyors of South Africa, vol. XXXI, no. 7. pp. 202-216. [ Links ]
De Jager, E.J. 1997. The analysis of the mine call factor in gold mining, with specific reference to Western Holdings Mine. PhD (Eng.) thesis, University of the Witwatersrand, Johannesburg. [ Links ]
Harmony Gold Mining Company Limited. 2006. Code of Practice: Harmony Gold Mining Company Limited, Policy no A1.2, Development Sampling Standard Procedure, 2006. pp. 3. [ Links ]
Lerm, C. 1994. Evaluation of chip sampling vs the gold analyzer. Journal of the Institute of Mine Surveyors of South Africa, vol. XXVII, no. 5. pp. 77-87. [ Links ]
Magri, E.J. and Mckenna, P. 1986. A geostatistical study of diamond-saw sampling versus chip sampling. Journal of the South African Institute of Mining and Metallurgy, vol. 86, no. 8. pp. 335-347 [ Links ]
Minnitt, R.C.A. 2007. Sampling: the impact on costs and decision making. Journal of the Southern African Institute of Mining and Metallurgy, vol. 107, no. 7. pp. 451-462. [ Links ]
Pitard, F. 2009.Pierre Gy's Theory of Sampling and C.O. Ingamells' Poisson Process Approach-pathways to representative sampling and appropriate industrial standards. Doctoral thesis, Aalborg University. [ Links ]
Smith, P.L. 2001. A Primer for Sampling Solids, Liquids, and Gases Based on the Theory of Pierre Gy. The Society for Industrial and Applied Mathematics, Philadelphia. [ Links ]
Storrar, C.D. 1981. South African Mine Valuation: Chapters 3, 4, and 5. Chamber of Mines of South Africa, Johannesburg. pp. 24-81. [ Links ]

