


Servicios Personalizados
Articulo
 Inglés (pdf)
 Articulo en XML
 Referencias del artículo
Indicadores

Links relacionados
-
 Citado por Google
 -
 Similares en Google
Compartir

 Permalink
Journal of the Southern African Institute of Mining and Metallurgy
versión On-line ISSN 2411-9717
versión impresa ISSN 2225-6253
J. S. Afr. Inst. Min. Metall. vol.114 no.1 Johannesburg ene. 2014
SAMPLING AND ANALYSIS PAPERS
Sample support size and spacing determination for resource development of a marine placer gold deposit
P. SaravanakumarI, II; G.J. BrownII; G. van EckI
IAuruMar (Pty) Ltd, Cape Town, South Africa
IIMineral Resource Consultants, Cape Town, South Africa
SYNOPSIS
Successful resource development for a marine placer gold deposit requires continuous sampling throughout the life of mine. The cost of sampling marine placer gold deposits is exponentially more expensive than for terrestrial placer and non-placer gold deposits and thus warrants a comprehensive cost-effective sampling strategy. The optimum sample support size depends on expected gold grade, desired confidence limit, and shape and size of the gold grains. The optimum sample spacing depends on the continuity of the deposit, required confidence limit, and cost-benefit analysis of a sampling programme. The current study combines sample support size and spacing determination for resource development of a marine placer gold deposit. The study used two methods to calculate the sample support size - modified Gy's formula and the approach pioneered by Clifton et al. (1969). Using historical drillhole data, a geostatistical simulation of a representative geological/mineralization domain was created on an extremely dense grid. The simulation realizations were validated using statistical, spatial, and graphical methods. Additional sample support sizes were then created by combining adjacent simulation nodes to form double, quadruple, and octuplet multiples of drill diameter sizes. The simulations were sampled at three different spacings: 100 m x 100 m; 50 m x 50 m; and 25 m x 25 m and then each sample set estimated into 50 m x 50 m blocks with ordinary kriging. A comparison between the actual and estimated block results was then carried out and the confidence of each sampling pattern (sample spacing and sample support size) determined. A cost-benefit analysis was then used to determine the optimum sampling strategy for the marine placer gold deposit.
Keywords: sampling, support size, spacing, marine placer gold.
Introduction
A placer deposit is a naturally occurring phenomenon in which detrital or residual material containing valuable minerals is accumulated through weathering of the source rocks and mechanically deposition either on land or in large water bodies such as lakes or oceans. Primary mineral elements such as gold, silver, and diamonds are examples of placer materials. Cronan (1980) classifies placer minerals into two broad groups: namely, heavy mineral placers and light heavy mineral placers, based on the specific gravity of the minerals. Minerals such as cassiterite, platinum, and gold are high specific gravity minerals with specific gravities ranging from 6.8 to 21. The light heavy minerals are rutile, ilmenite, zircon, monazite, and diamond, with specific gravities ranging from 3.5 to 5.3. In general, there are five requirements needed to form placer deposits.
►Source rocks containing valuable minerals (light heavy and heavy minerals)
►Weathering of the source rocks to release the valuable minerals
►Transportation of the valuable minerals released by the weathering process and subsequent redistribution by natural processes
►Concentration of transported material on the basis of size, shape, and density either on the land or in large water bodies such as lakes or the sea
►Preservation of concentrated material and protection from natural redistribution or re-transportation through the ambient environment.
Cronan (1980) identified the important economic near-shore marine placer deposits known at that time. The significant marine/beach placer deposits are diamonds found along the west coast of South Africa and Namibia; gold and cassiterite deposits in Egypt; ilmenite, rutile, and zircon deposits in southern India and Sri Lanka; cassiterite deposits along the coasts of Indonesia, Malaysia, and Thailand; rutile, zircon, and cassiterite deposits along the Tasmanian coast; gold, ilmenite, and rutile deposits along the South Island coast of New Zealand; and gold deposits along the Alaskan coast.
Successful resource development of a marine placer gold deposit requires continuous sampling throughout the life of mine. The cost of sampling marine placer gold deposits is exponentially more expensive than for terrestrial placer or non-placer gold deposits and thus requires a comprehensive cost-effective sampling strategy. The gold in a placer environment is in the form of discrete particles and consequently the representivity of samples depends on the grain size and shape, as well as the quantity or density of gold grains. The spatial relationship between samples is dependent on the representivity of the samples and the continuity of the mineralization. Thus the optimization of a sampling campaign includes both sample support size and sample pattern. The optimum sample support size depends on expected gold grade, desired confidence limit, and shape, size, and coarseness of the gold grains. The optimum sample spacing depends on the continuity of the deposit, required confidence limit, and cost-benefit analysis of a sampling programme. The objective of this study is to optimize the design for planned future sampling campaigns.
Nome - marine placer gold deposits
The city of Nome is situated at 64°30'N latitude and 165°30'W longitude in the state of Alaska, USA. Nome is 100 km south of the Arctic Circle on the southern coast of the Seaward Peninsula where Norton Sound becomes part of the Bering Sea. According to Garnett (2000), the west-northwest - east-southeast trending coastline on which Nome is sited forms the southern boundary of a 6 km wide coastal plain at the foot of glaciated hills. A unique marine gold deposit is situated immediately offshore and displays all the important features of offshore placer gold deposits. This deposit was successfully mined by Western Gold Exploration and Mining Company Limited Partnership (WestGold) from 1987 to 1990, using a large bucket ladder dredge - the BIMA The vast extent of the Nome gold deposit has been documented for over 100 years by numerous authors, most notably Metcalf and Tuck (1942), Nelson and Hopkins (1972), Tagg and Greene (1973), Rusanowski (1989, 1991), Bronston (1989, 1992), Kaufman and Hopkins (1988), Howkins (1992), and Garnett (2000). Most of the authors studied the gold distribution and the sedimentary processes occurring along the Nome coastline. However, the unified geological model was developed by the geologists employed by WestGold.
Weathering of a complex suite of metasedimentary, sedimentary, and volcanic source rocks from the Kigluaik Mountains in the Seaward Peninsula, primarily along fault zones, liberated particulate gold, which was eroded, transported, and deposited by glaciers. The till and moraines left by the glaciers on the coastal plain and on the sea floor were subjected to reworking by wave action when the shoreline transgressed and regressed over the coastal plain in the past and by the present day influence of longshore currents and storms. This resulted in the formation of relict lag gravels that overlie the glacial deposits in the offshore environment (Nelson and Hopkins 1972). The basement hosting the offshore sediments dips in a south-easterly direction and is thus shallow in the western inshore part of the area, where a thin auriferous gravel lag sits directly on the bedrock.
Current understanding of the offshore geology at Nome is drawn largely from the work done by WestGold. The area has been divided into a number of broad geological zones (Figure 1). The Central Core and West Flank are interpreted as the terminal moraine of the Nome River glaciation period (the last glaciation to cross the coast), which consists predominantly of till and has been eroded to form a gravel lag on its surface. Seaward of the Central Core, the Marine Fringe is a complex sequence of reworked material overlying marine muds. High-energy sand and gravel facies form an apron of clastic sediments overlapping the edges of the Central Core and West Flank. The Thrust Zone is a mound of marine sediments sub-parallel to the Central Core which resulted from muds being pushed and sheared ahead of the advancing ice mass. lt is draped with sediments deposited either by a floating ice sheet containing erratics or as pro-glacial outwash eroded and transported from the Central Core. The Transition Zone is an extensive area of mature gravel and sand interbedded with mud. This zone marks the transition from the diamict of the Central Core (north and east), the open marine environment (south), and the coarse clastic sediments of the West Flank. Sediments infilling the concave structure are interpreted to be of marine origin. The East Flank Zone is situated east of the Central Core and consists of high-energy shallow marine deposits.
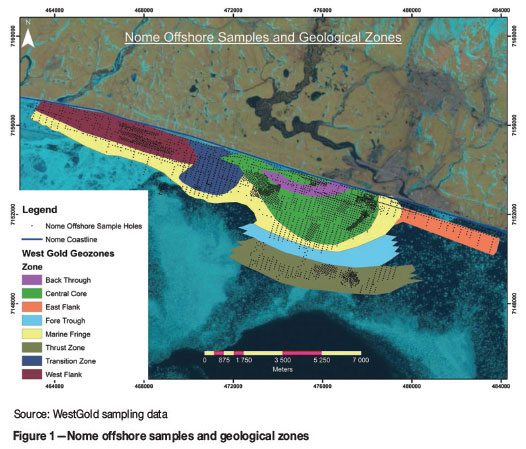
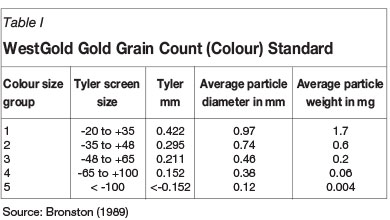
WestGold and its predecessors conducted numerous offshore sampling campaigns over the years. The existing sample data-set of 3503 boreholes (Figure 1) was made available in Excel spreadsheet format by the Department of Natural Resources (DNR), Alaska. Reverse circulation (RC) drilling, using a Becker drill, was conducted by Shell in the 1960s, followed by Asarco in the early 1970s. WestGold (initially known as lnspiration Gold) conducted its first drilling through the ice in 1987, and over the next couple of years then conducted successive winter drilling programmes off the ice and summer drilling programmes off a vessel. All these programmes utilized a Becker RC drill. A double-walled, hollow 5.5 inch outer diameter and 3.25 inch internal diameter drill pipe, with an eight-tooth crowd-in bit was used in each of the drilling programmes (Bronston, 1989). Each hole was drilled in 1 m increments. After each metre of penetration, the drill pipe was flushed with water and air, forcing the sediments inside the pipe to the surface. The sediment-water slurry was passed through a cyclone and laundered to reduce its velocity prior to collection. The sediment from each 1 m interval was collected and stored in individually labelled, clean sealed 20-litre buckets. After panning the sample, the visible gold was manually picked and grouped into five separate size fractions (Table I) as defined in the gold key devised by Bronston (1989), using gold obtained during the BIMA's 1986 production test season. The number of gold grains in each of the size fractions was counted and recorded. The gold grade was calculated per sample using the weight of the gold grains picked after panning and the volume of the sample. The gold grains from each hole were combined and assayed and redistributed to respective samples based on the gold grain count and weight. Based upon the WestGold geological model and data, sample support size and sample pattern studies were undertaken to optimize future sampling.
Sample size determination
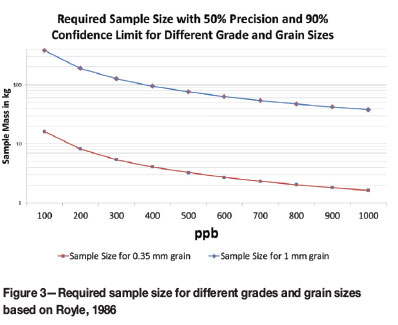
Two approaches were considered to determine the appropriate sample support volume for the Nome offshore gold deposit. Firstly, an approach using the modified Gy's formula by Royle (1986) is used to calculate the required sample volume.
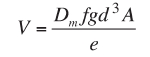
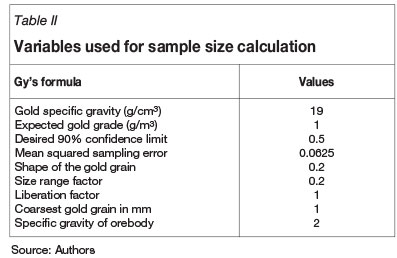
where V is the volume required, D is specific gravity of gold, f and g are size and shape factors, d is the coarsest 90% percentile gold grain diameter, A is expected grade, and e is the sampling error. The values used to calculate the sample volume are shown in Table II. The expected gold grade is assumed to be 1 g/m3 based on previous production history. All of the gold grains are assumed to be free gold (liberation factor of 1) and flaky (shape factor of 0.2). The size range factor (g) is the ratio of the sieve aperture that retains 5% oversize to the aperture that passes the 5% undersize material, and is assumed to be 0.2. The coarsest gold grain is assumed to be 1 mm in size.
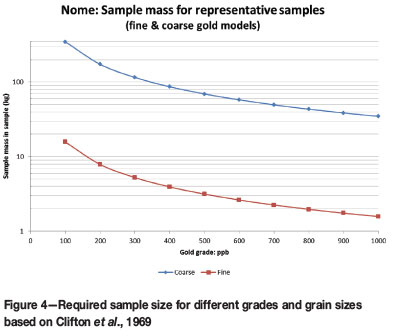
Secondly, an approach pioneered by Clifton et al. (1969) was undertaken. Reproducible gold analysis from placer deposits is likely to be affected by the presence of gold nuggets, resulting in what is termed the 'nugget effect'. Making assumptions about the gold particle distribution, the 'effective grain size' of nuggets can be determined (where 'nuggets' refers to gravimetric recoverable particles) for the deposit type. Then, the relationship between sample size (or mass) and gold grade can be determined to achieve representative samples (50% accuracy, 90% of the time) based upon a simple 'equant grain model' and Poisson statistical assumptions.
As the gold particle size distribution for the Nome offshore placer deposit is unknown, two gold particle models were assumed from the available information:
i. A fine distribution based on a modal gold size of between 300 µm and 425 µm (Garnett, 2000) and a nugget diameter of 357 µm
ii. A coarse distribution based on a nugget diameter of 1 000 µm (Nelson and Hopkins, 1972).
For both models, a flatness index of 30% and gold fineness of 90% (Garnett, 2000) were assumed. Based on the two gold particle assumptions, relationships between sample size and gold grade were calculated to obtain representative samples.
Sample spacing determination
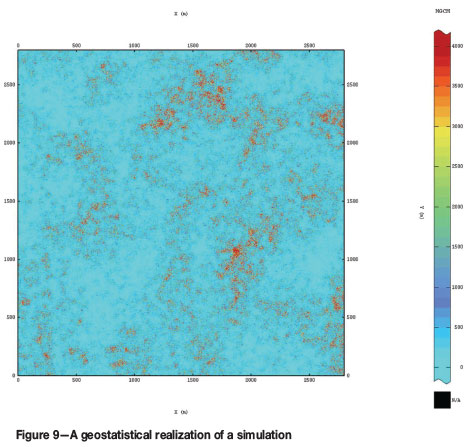
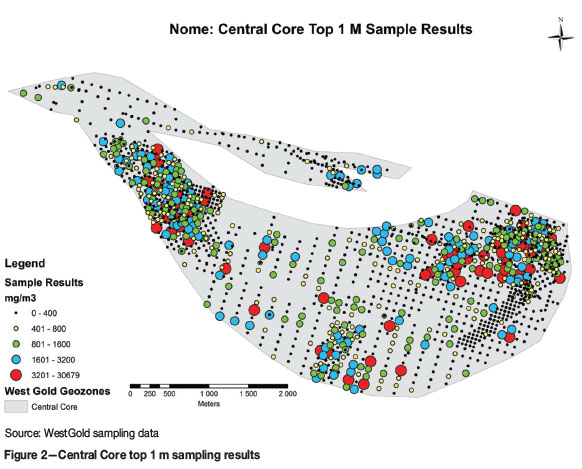
Considering only the upper 1 m drill composite, a two-dimensional geostatistical simulation of the Central Core zone of the Nome offshore deposit was created on an extremely dense grid. Drill-holes from the Central Core (Figure 2) were selected to parameterize the simulation. The de-clustered raw gold results (mg/m3) were transformed into gaussian values using Hermite Polynomials. A variogram was modelled using the de-clustered gold results. One hundred non-conditional realizations using Turning Bands were created for a 1.96 km2 domain (the planned annual production area). The realizations were validated using statistical, spatial, and graphical methods recommended by Leuangthong et al. (2004). Additional sample support sizes were then created from the dense simulation grid nodes by combining adjacent nodes into double, quadruple, and octuplet sets to create a range of sample sizes (1.56 inch radius Becker drill; 3.11 inch radius drill sample; 6.2 inch and 12.4 inch radius drill samples). The simulations were sampled at three different spacings (100 m x 100 m, 50 m x 50 m, and 25 m x 25 m) and then each sample set (4 sample sizes x3 sample spacings) estimated into 50 m x 50 m blocks with ordinary kriging. A comparison between the actual and estimated block results was carried out and the confidence of each sampling pattern (sample spacing and sample support size) determined. The relationship between the distribution of the 100 realizations of the actual and estimated blocks could then be used to assess the merit of each sampling pattern.
Cost-benefit analysis
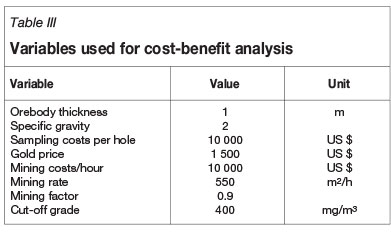
A cut-off grade of 400 mg/m3 is assumed for the cost-benefit analysis. The variables used for the cost-benefit analysis are tabulated in Table III. Sampling costs per hole and mining costs per hour were both assumed to be US$10 000. A gold price of US$1500 and mining rate of 550 m2/h were also assumed. The overall cost-benefit analysis determined the optimum sampling strategy to be used for the marine placer gold deposit. The rate of return and NPV are calculated excluding the initial capital investments.
Results and discussion
The volume required for a representative sample for an expected average grade of 1 g/m3 with 50% precision and 90% confidence limit is 0.03366 m3. Assuming a specific gravity of 2.0 t/m3, then the required sample mass is 67 kg. Figures 3 and 4 shows the required sample sizes depending on the expected gold grade, for a fine and coarse gold particle distribution. The required sample size increases when the gold grain size increases and/or the gold grade decreases. Conversely, the sample size decreases when the gold grain size decreases and/or the gold grade increases.
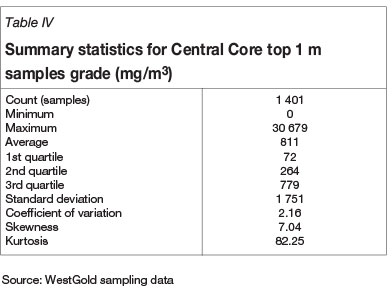
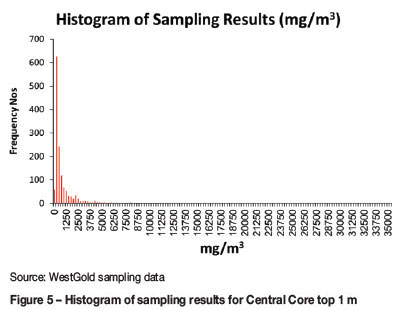
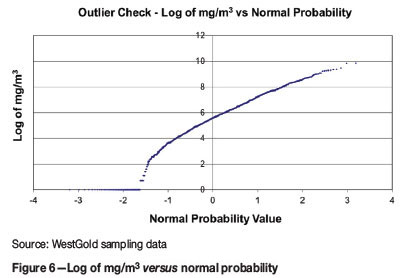
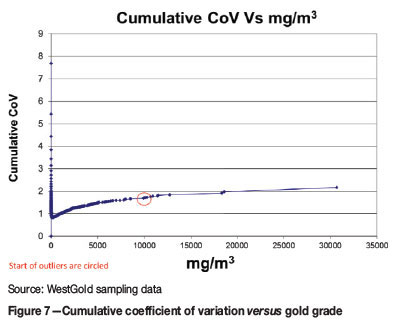
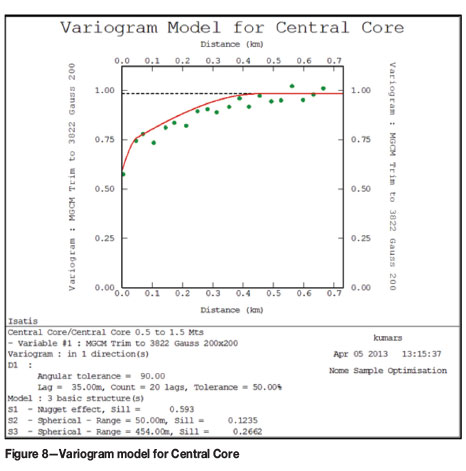
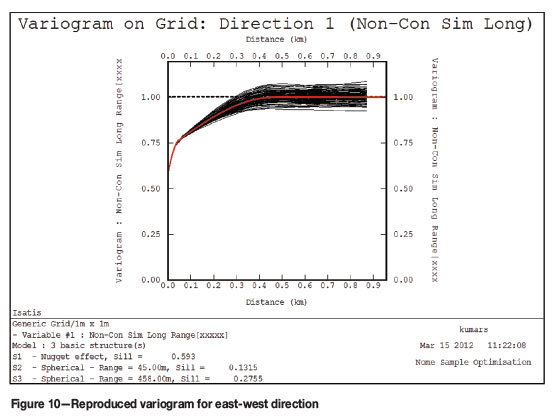
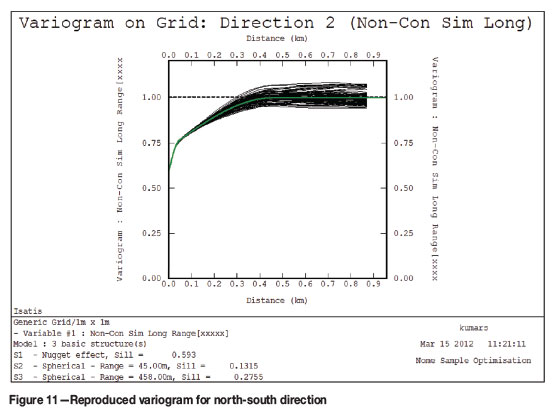
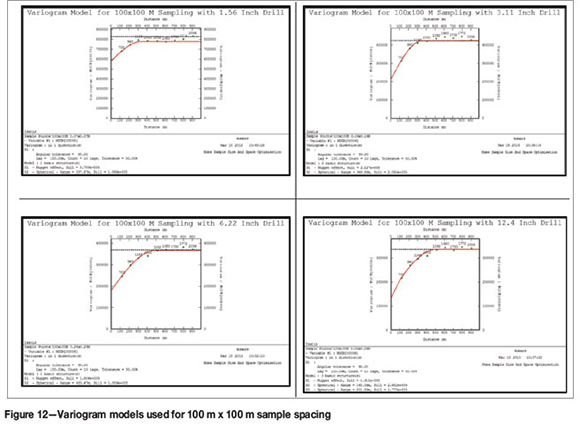
The mean grade of the samples from the Central Core is 811 mg/m3 with a standard deviation of 1751 mg/m3. The grade distribution is highly skewed (skewness 7.04) and coefficient of variation of 2.16 (Table IV and Figure 5). Outliers were identified using Parker's (1991) distribution approach and visual identification (Figures 6 and 7). A total of 10 samples were considered as outliers. The variogram fitted in gaussian space has a nugget (60%) and two spherical structures with a 454 m range (Figure 8). A realization of the spatial simulation is shown in Figure 9, and the spatially replication of the input variogram is shown in Figures 10 and 11. Instead of calculating and modelling variograms for each sample realization, a single realization was chosen and a standard variogram model defined per sample campaign. By adopting this approach the subjectivity of variogram modelling between realizations is excluded from the kriged estimates. Variograms for 100 m x 100 m for different support sizes are shown in Figure 12. As expected, the nugget effect decreases when the sample size increases, as well as with the improvement in the structure of the variogram.
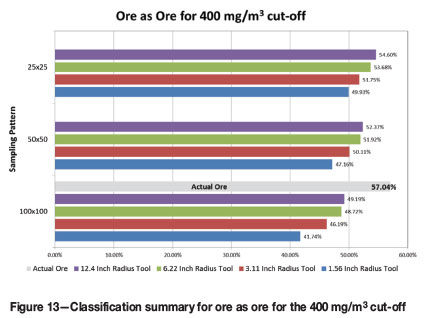
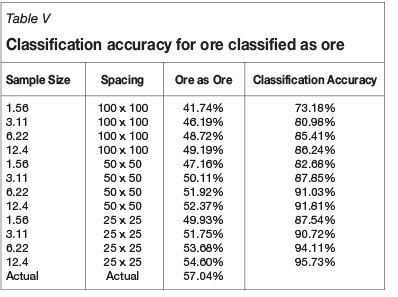
Using a cut-off grade of 400 mg/m3, the domain can be classified into ore (where the estimates are above the cutoff), or waste (where the estimates are below the cut-off). The percentage of estimated ore can then be compared to the actual amount of ore from the simulation. In Figure 13 the percentage of ore estimated from the different sample sizes and patterns is compared to the actual simulation ore proportion of 57%. The percentage classified as ore increases with the increase in sample size and spacing. However, the increases are marginal when sampling density is increased from 50 m x 50 m to 25 m x 25 m spacing. The 100 m x 100 m sampling pattern can achieve an ore classification proportion of only between 42% and 49% for all sample sizes. The 25 m x 25 m sampling pattern for all sample sizes achieves 50% to 54% classified as ore. The classification accuracy for ore as ore (estimates are above the cut-off) is tabulated in Table V.
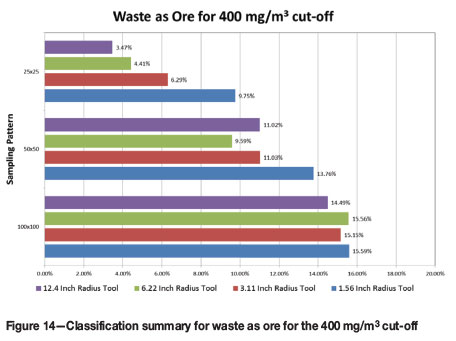
Some of the waste (actual simulated value less than 400 mg/m3 but estimated value greater than 400 mg/m3) is also misclassified as ore during the classification process due to the estimation error. As expected, the percentage of waste classified as ore is reduced as the sample size and spacing increases. The 100 m x 100 m spacing for all sample sizes misclassifies 15% of the waste as ore (Figure 14). The percentage of misclassification reduces only for 25 m x 25 m with 3.11, 6.22, and 12.4 inch radius drill sampling.
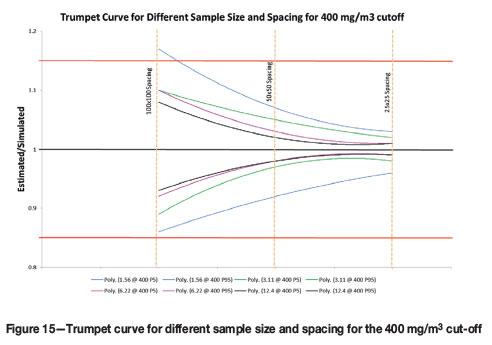
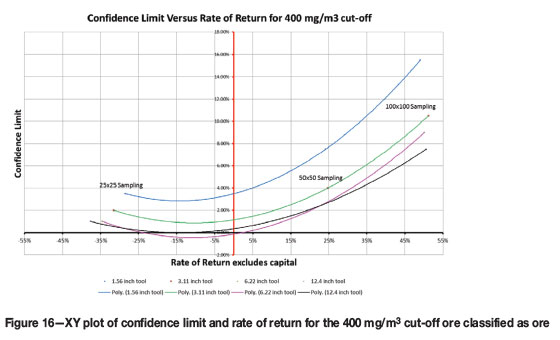
The trumpet curve for the ratios (estimated value/ simulated value) for the planned annual mining area of 1.96 km2for different sample size and spacing is shown in Figure 15. A sample spacing of 100 m x 100 m with 3.11, 6.22, and 12.4 inch radius drills is considered good enough to generate the Parker (1998) estimation confidence of Indicated Resource to ±15% accuracy for annual production. 100 m x 100 m sampling with a 1.56 inch drill would fall outside this criterion.
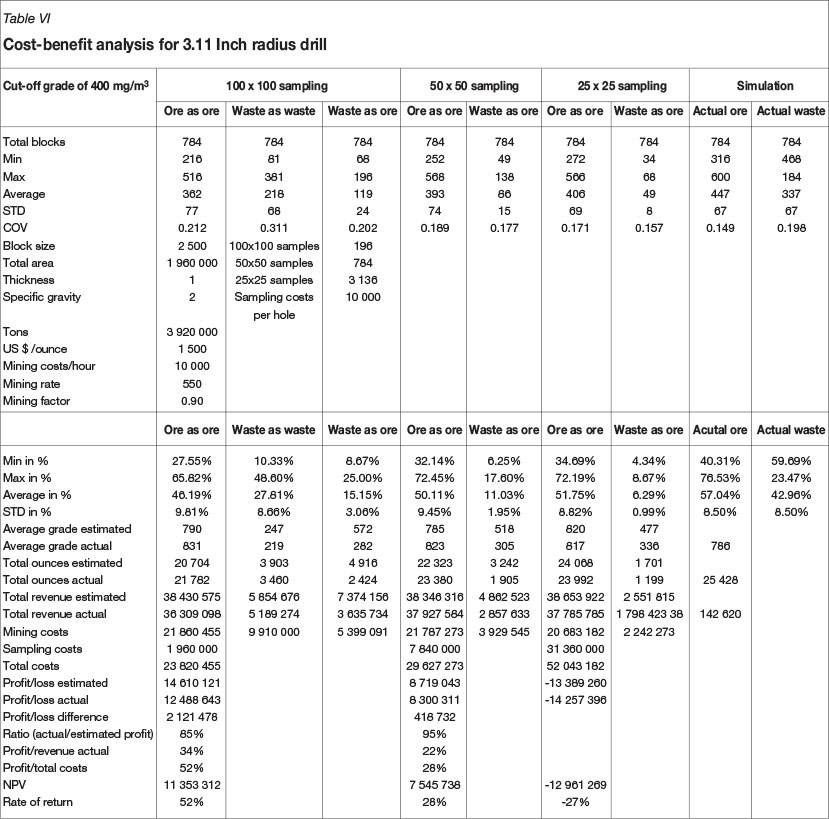
The cost-benefit analysis is used to select the optimum sample size and spacing for the Nome marine placer gold deposit. Table VI shows the average grade, total ounces, total revenue, and total costs for estimated and simulated (treated as actual) for a cut-off grade of 400 mg/m3 using a 3.11 inch radius drill and different sampling patterns as an example. Using the area to be mined based on the classification accuracy (ore as ore, waste as ore), sampling and mining costs, and gold price, the total estimated revenue can be calculated for each sampling pattern. Profit/loss, various ratios (actual/estimated profit, profit/revenue actual, profit/total costs), NPV, and rate of return can be calculated. The total revenue estimated ranges from US$38.6 million (2 5 m x 25 m sampling pattern) to US$38.4 million (50 m x 50 m sampling pattern). The mining costs range from US$20.6 million (25 m x 25 m sampling pattern) to US$21.8 million 100 m x 100 m sampling pattern). However, the sampling costs range widely, from US$31.3 million (25 m x 25 m sampling pattern) to US$1.9 million (100 m x 100 m sampling pattern). The ratio of actual profit and estimated profit calculated for 100 m x 100 m sampling pattern is 85%, with a rate of return of 52%. Even though the ratio of actual profit and estimated profit for the 50 m x 50 m sampling pattern is higher (95%) than for the 100 m x 100 m sampling pattern, the rate of return is well below that of the 100 m x 100 m sampling pattern (28%). The 25 m x 25 m sampling pattern results in a loss, hence no ratios were calculated.
The trumpet curve (Figure 15) and cost-benefit results (Figure 16) show that a 100 m x 100 m sampling pattern with any of the 3.11, 6.22, and 12.4 inch radius drills yields the required Parker (1998) estimation confidence of Indicated Resource and higher rate of returns. The 25 m x 25 m sampling patterns for all sample sizes yield a negative return. The 50m x 50m sampling spacing reduces the rate of return by 50% but increases the confidence by approximately 50% when compared against the 100 m x 100 m sampling pattern. In summary, a 100 m x 100 m sampling pattern with any sample size above 1.56 inch radius drill is considered accurate enough to produce the Parker (1998) estimation confidence for an Indicated Resource.
Summary
This study used 'Gy's formula modified by Royle' to calculate the sample size required for a marine placer gold deposit with an average grade of 1 g/m3 for a 1 m thick orebody on the seafloor where the coarsest gold grain is expected to be 1 mm in diameter, and concludes that the minimum sample size should be 0.03366 m3 (67 kg). This minimum sample size was also confirmed by the Clifton et al. (1969) approach. A two-dimensional Turning Band non-conditional geostatistical simulation for 1.96 km2 test area was created for the Central Core geological zone. The simulation was sampled at 100 m x 100 m, 50 m x 50 m, and 25 m x 25 m spacing with 1.56, 3.11, 6.22, and 12.44 inch radius drills and estimated into a 50 m x 50 m grid. The comparison between simulated (treated as actual) and estimated grades reveals that 100 m x 100 m sampling with 3.11 inch, 6.22 inch, and 12.4 inch radius drills is sufficient to generate an estimation confidence of an Indicated Resource using the Parker (1998) guidelines. The cost-benefit analysis showed that a 100 m x 100 m sampling pattern with 3.11, 6.22, and 12.4 inch radius drills yields positive rates of return.
Acknowledgements
We thank Vaughan Chamberlain of AngloGold Ashanti and Malcolm Thurston of De Beers Group for their input, encouragement, and support during the study. We also thank the reviewers for their critical review, which improved the content.
References
Bronston, M.A. 1989. Offshore placer drilling technology - a case study from Nome, Alaska. Mining Engineering, vol. 42, no. 1. pp. 26-31. [ Links ]
Bronston, C.A. 1992. Ore reserve calculation procedures. Nova Natural Resources, Unpublished report. [ Links ]
Clifton, H.E., Hunter, R.E., Swanson, F.J., and Phillips, R.L. 1969. Sample size and meaningful gold analysis. US Geological Survey, Professional Paper 625-C. 17 pp. [ Links ]
Cronan, D.S. 1980. Underwater Minerals. Academic Press,Toronto. [ Links ]
Garnett, R. 2000. Marine placer gold with particular reference to Nome, Alaska. Handbook of Marine Mineral Deposits. Cronan. D.S. (ed.). CRC Press, Boca Raton, FL. pp. 67-101. [ Links ]
Howkins, C.A. 1992. A model for shallow marine placer deposition: based on the marine gold placers at Nome, Alaska. MSc thesis, University of Toronto. 195 pp. [ Links ]
Kaufman, D. and Hopkins, D.M. 1988. Late Cenzoic geological controls on placer gold distribution in the Nome nearshore area. Geological studies on Alaska. US Geological Survey. pp. 27-45. [ Links ]
Leuangthong, O., McLennan, A.J., and Deutsch, C. 2004. Minimum acceptance criteria for geostatistical realisations. Natural Resources Research, vol. 13, no. 3. pp. 131-141. [ Links ]
Metcalf, J.B. and Tuck, R. 1942. Placer gold deposits of the Nome Gold District, Alaska. Unpublished Report. US Smelting, Refining and Mining Co. [ Links ]
Nelson, C.H. and Hopkins, D.M. 1972. Sedimentary processes and distribution of particulate gold in the northern Bering Sea. US Geological Survey, Professional Paper 689. 27 pp. [ Links ]
Parker, H.M. 1991. Statistical treatment of outlier data in epithermal gold deposit reserve estimation. Mathematical Geology, vol. 23, no. 2. pp. 175-199. [ Links ]
Parker, H.M. 1998. Comment on confidence limits used in resource and reserve classification and review of published papers on confidence limits. Unpublished MRDI report excerpt. 5 pp. [ Links ]
Royle, A.G. 1986. Alluvial sampling formula and recent advances in alluvial deposit evaluation. Extractive Industry Geology. pp. 179-182 [ Links ]
Rusanowski, P.C. 1989. Nome offshore placer project; issues and answers; a three-year perspective. Placer Mining in Today's World. Proceedings of the 11th Annual Conference on Placer Mining, Fairbanks, Alaska, 29 March-2 April 1989. pp. 4-10. [ Links ]
Rusanowski, P.C. 1991. Nome offshore placer project - a model for resource extraction projects in Alaska. Alluvial Mining, Proceedings of the Conference on Alluvial Mining. Institution of Mining and Metallurgy, London, UK, 11-13 November 1991. Elsevier Applied Science. pp. 587-601. [ Links ]
Tagg, A.R. and Greene, H.G. 1973. High-resolution seismic survey of an offshore area near Nome, Alaska. US Geological Survey Professional Paper 795-A. pp. A1-A23. [ Links ]

