


Serviços Personalizados
Artigo
 Inglês (pdf)
 Artigo em XML
 Referências do artigo
Indicadores

Links relacionados
-
 Citado por Google
 -
 Similares em Google
Compartilhar

 Permalink
Journal of the Southern African Institute of Mining and Metallurgy
versão On-line ISSN 2411-9717
versão impressa ISSN 2225-6253
J. S. Afr. Inst. Min. Metall. vol.113 no.12 Johannesburg Jan. 2013
GENERAL PAPERS
Optimizing shaft pressure losses through computational fluid dynamics modelling
W.J. KempsonI; R.C.W. Webber-YoungmanI; J.P. MeyerII
IDepartment of Mining Engineering, University of Pretoria
IIDepartment of Mechanical and Aeronautical Engineering, University of Pretoria
SYNOPSIS
As a result of the rising electrical energy costs in South Africa, a method was sought to reduce the overall electrical consumption of typical shaft systems. A typical shaft configuration was analysed and the primary energy consumers were identified. The ventilation fans for this system were found to consume 15% of the total energy of the shaft system. It was calculated that more than 50% of this energy is consumed by the shaft itself, more specifically, by the pressure losses that occur in the shaft as the ventilation air passes through it. In order to ensure that the theory being used for the evaluation of these shaft systems is accurate, a total of five shafts were instrumented and the actual pressure losses over the shafts plotted against time. These shafts were then analysed from a theoretical perspective. Finally, in order to ensure a thorough understanding of the behaviour of the ventilation air in shaft systems, the systems were simulated using computational fluid dynamics (CFD) techniques. There were significant discrepancies between the theoretical analysis and the CFD simulation during the initial comparisons. This discrepancy lessened as the complexity of the CFD models increased, until when the complete shaft was modelled using the full bunton sets, the pipes, and the flanges, the difference between the theoretical evaluation and the CFD simulation was small. This result demonstrates that the theory is insufficient and that the interrelated effect of the buntons and fittings has not been fully appreciated by current theory. The final phase of the work presented here was to evaluate the cost-effectiveness of using different bunton shapes and shaft configurations. It is shown that the increase in the pressure losses and therefore the direct operating costs of the shaft can vary by as much as 80%, depending on the bunton configuration chosen. The placement of the piping in the shaft can increase the pressure losses, and therefore the direct operating costs of the shaft, by as much as 12%, depending on the placement of the piping in the shaft; this effect includes the use of flanges. The use of fairings on a large cage can reduce the resistance that the cage offers to the ventilation flow by as much as 30%. This, however, does not translate into a direct saving because as the cage moves through the shaft, the overall effect is transitory. These savings can be significant when the items highlighted in this work are applied correctly.
Keywords: shaft design, ventilation, energy consumption, modelling, CFD.
Introduction
The mining industry in South Africa faces particular challenges at present, primarily in the area of electrical energy consumption. During 2007, South Africans faced increasingly stringent load-shedding of the electrical supply. In January 2008 Eskom took the unprecedented step of informing its key industry consumers that it could no longer guarantee its supply to them. This announcement resulted in the temporary closure of all the deep-level mines associated with the large mining houses (i.e. Anglo American, Gold Fields, etc.) as a result of safety concerns if the power did indeed fail. This event occurred as South Africa's electrical generating capacity had, for a number of years, remained constant while the country's economy grew. This now required the building of additional generating capacity, which required significant capital investment.
This situation has resulted in significant increases in the cost of electrical energy at rates that are well above the inflation rate of South Africa. As a result, a method was sought to reduce the overall electrical consumption of typical shaft systems. In order to achieve this, a typical shaft configuration was analysed and the primary energy consumers were identified.
The ventilation fans for this system were found to consume 15% of the total energy of the shaft system. It was calculated that more than 50% of this energy is consumed by the shaft itself, more specifically, by the pressure losses that occur in the shaft as the ventilation air passes through it.
The object of the work presented in this paper is to review the design of these shaft systems in order to evaluate the current theory that is used for shaft design, and to find ways to design these shafts such that less energy is required to transfer ventilation air through them.
To this end, a three-pronged approach was undertaken.
► Measurement of the pressure losses associated with a shaft system
► Evaluation of the shaft systems using the current theory
► Evaluation of the shaft systems using computational fluid dynamics (CFD) to try to gain a more fundamental understanding of the pressure losses within a shaft system.
Once the above had been accomplished, the results were evaluated, and the conclusions are presented in this paper.
Evaluation of the resistance offered by current shaft configurations
Shaft measurement
With the permission of Impala Platinum, comprehensive tests were carried out on five of their shafts: Impala Number 14 Shaft, Impala Number 11 Shaft, Impala Number 1 Shaft, Impala Number 11C Shaft, and Impala Number 12 N Shaft.
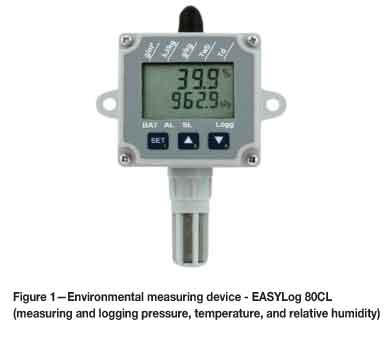
In order to measure the pressure losses in a shaft, an innovative testing methodology was required that allowed the remote testing of the shaft. This is primarily born out of the need to be able to measure various parameters in the shaft during normal operation. Measurement of the following parameters was undertaken:
► Dry-bulb temperature (TDB) (°C)
► Wet-bulb temperature (TWB) (°C) (or relative humidity, %)
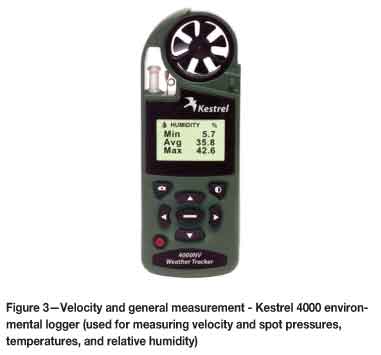
► Velocity of air in shaft (m/s)
► Barometric pressure (PBar)
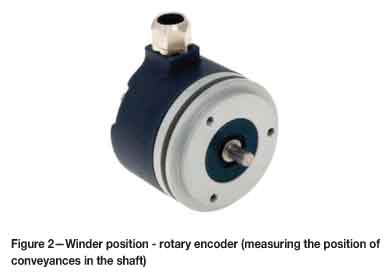
► Position and speed of all the conveyances in the shaft.
All these measurements were required as a function of time so that a meaningful analysis could be completed. This consists of a calculation of the actual pressure losses with respect to time and the overall effect of the movement of the conveyances.
The instrumentation was placed in positions and the various conveyances were allowed to move individually in the shaft so that the specific parameters for each of these were measured. The data from the individual instruments was then collated on a single computer to enable real-time comparisons. The instrumentation used for this work is illustrated in Figures 1-3.
Data collations
The general procedure for the collection of data involved firstly the preparation of the instrumentation. This required confirmation of the battery life of the instrumentation, clearing of the logged data, and synchronization of all the instrumentation to a single computer. This was a specific requirement because the various loggers were not connected and the single reference time point was therefore the only point that would allow the various measurements to be compared.
The environmental loggers were placed in positions that were determined in consultation with the mine ventilation officer. They were placed during the weekly shaft inspection. During this inspection the shaft ventilation free air velocity was confirmed and the general condition and layout of the shaft was evaluated.
Once this had been completed, the loggers for the winders were put in place and the logging started.
All the instruments logged data for one week, at the end of which they were removed during the next scheduled shaft inspection.
Once the data from the various loggers had been collected, it was all downloaded into a personal computer. To allow the data to be collected over a full week, the environmental loggers were set to record every 10 seconds and the winder loggers to record every second.
Environmental loggers
The data from these loggers required some manipulation before it could be used for a meaningful comparison. The following steps had to be taken:
1 Calculate the wet-bulb temperature
2 Ensure timing compatibility
3 Calculate the measured pressure drop
4 Calculate the theoretical pressure drop.
The calculation of the wet-bulb temperature does pose a challenge. The usual calculation method requires an iterative evaluation. However, the large amount of data requiring collation meant that this could not be effectively achieved. An Excel Add-In package available from kW Engineering was therefore used. This calculates the wet-bulb temperature based on data published in the 1997 ASHRAE Handbook of Fundamentals.
Winders
The data for the winders was collated against time. This allowed the position of the conveyance in the shaft to be calculated and this data to be synchronized with that of the other data loggers. To do this the specific diameter of each of the winder drums under consideration must be known. This information is then used to calculate the speed and position of the conveyances against time. Once this is completed, 10-second snapshots of the winder movements are taken to allow comparison against the environmental data.
As was discussed above, all the instruments logged data for one week at a minimum time interval of 10 seconds. This resulted in a significant quantity of data. This data was sorted into two-hourly periods for the duration of all the tests and presented graphically. A typical graph showing the results of the analysis is shown in Figure 4 (more detail is available in Kempson, 2012).
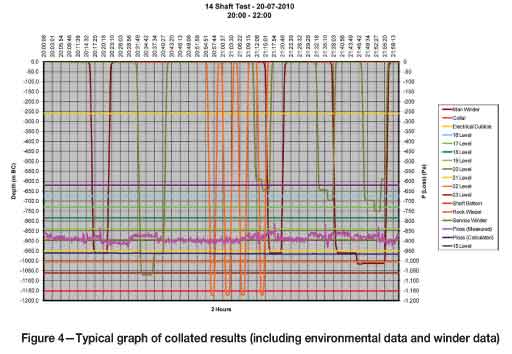
These graphs show the pressure losses of the shaft as a function of time and of movement of each of the shaft conveyances. This allows for a meaningful comparison to be made once the pressure losses associated with the shaft are calculated.
Evaluation of the shaft systems using current theory
To calculate the expected pressure drop in a shaft, standard analysis techniques are used. Two different methods were used for the calculation of shaft friction resistances. Both of these methods are similar and are based to an extent on the same data produced by Stevenson (1956). This work was formalized and extrapolated by Bromilov (1960) and McPherson (1987).
The methods referred to are:
► Classic fluid dynamics theory using the Chezy-Darcy friction factors and the Darcy-Weisbach approach
► General mine ventilation approach using the Atkinson equation and friction calculations.
Each of these methods is discussed in turn in the following sections.
Chezy-Darcy friction factor
The resistance that ducts offer to the flow of fluid through them is calculated using the Chezy-Darcy friction factor (f). This factor is used to calculate the pressure drop over a length of duct. It is valid for duct flows of any cross-section, as well as for laminar and turbulent flow. The manner in which this pressure loss is calculated is:
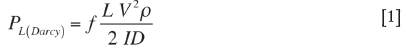
where
f = Chezy-Darcy friction factor (dimensionless)
L = Length of duct (pipe) (m)
ID = Internal diameter (m)
V = Velocity of fluid in duct (pipe) (m/s)
ρ = Density of fluid (kg/m3)
PL (Darcy) = Pressure drop experienced over length of duct (calculated using the Darcy-Weisbach formula) (Pa).
This formula, however, requires the value for f in order to be used. This is obtained by the use of the Moody chart for pipe friction. This chart is accurate to ±15% for design calculations. The Moody chart is unfortunately cumbersome to use for repeated calculation. White showed accuracy to within 2% across the range shown in the Moody chart and is (White, 1986):
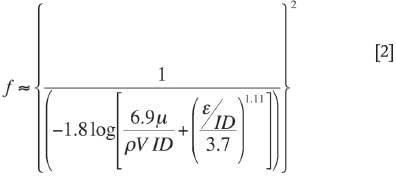
where
f = Chezy-Darcy friction factor (dimensionless)
µ = Coefficient of viscosity (kg/ms)
ρ = Density (kg/m3)
V = Velocity (m/s) (free air velocity in shafts)
ID = Internal diameter (of shaft) (m)
ε = Surface asperities (m).
It should be noted here that some texts use a value of f that is four times that defined by others. Care must therefore be taken to ensure that the correct values are used.
Atkinson calculations
The Atkinson calculation (Chasteau, 1989) was formulated for fully developed turbulent flow in an airway and is therefore applicable to flows whose Reynolds numbers exceed 4 000 (Re>4 000). This is usually the case for airflow in ventilation ducts. The Atkinson equation is:
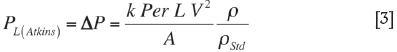
where
k = Atkinson friction factor (NS2/m4)
L = Length of airway (m)
Per = Perimeter of airway (m)
A = Cross-sectional area of airway (m2)
V = Velocity of fluid in airway (m/s)
ρ = Density of fluid (kg/m3)
ρStd = Standard density of fluid (kg/m3) (usually 1.2 kg/m3)
PL(Atkinson) = Pressure drop experienced over length of duct (calculated using Atkinson equation) (Pa).
The values of k (the Atkinson friction factor) are taken from tables of measurements that have been compiled in the past. These values are readily available from any mine ventilation text.
This form of the calculation has the advantage of being widely used in mine ventilation circles. However, it has two shortcomings:
1 The values of k are measured at different fluid densities and therefore the data must always be correct for the current circumstances before it can be used. This also implies that the data is not a geometrical measure of airway resistance as it depends on this air density
2 The exact circumstances surrounding the measurement of the data points are not known, and inaccuracies can therefore develop if there are significant differences.
Shaft friction resistance
The current theory for the calculation of this resistance assumes that the resistance value for each of the resistance sources listed below is independent of the others. This assumption is not strictly true, but is required for the calculation to be completed.
The shaft friction resistance is calculated with respect to three criteria:
1 Friction resistance (standard fluid theory based on the Moody chart)
2 Resistance offered by the shaft fittings (buntons, guides, pipes, etc.)
3 Resistance offered by the movement of the conveyances in the shaft.
Thus the overall Chezy-Darcy friction factor for the shafts is calculated by summing the individual Chezy-Darcy friction factors for each of the resistant components in the shaft:

where
fTotal = Combined Chezy-Darcy friction factor of complete shaft (dimensionless)
fShaft = Chezy-Darcy friction factor for shaft wall (dimensionless)
fBuntons = Chezy-Darcy friction factor for shaft buntons (dimensionless)
fGuides = Chezy-Darcy friction factor for shaft guides (dimensionless)
fFittings = Chezy-Darcy friction factor for shaft fittings (dimensionless)
fCages = Chezy-Darcy friction factor for cages (dimensionless).
Each of these is described briefly below
Shaft walls
The resistance of the shaft wall is calculated using factors available for standard pipe theory for the skin friction of the shaft wall or the duct wall. These friction factors allow the calculation of the resistance of this item based on its size, the expected roughness of the wall, and the flow of air through the shaft. The limitation of this theory is that it can give conservative results when very rough walls are included in the calculation.
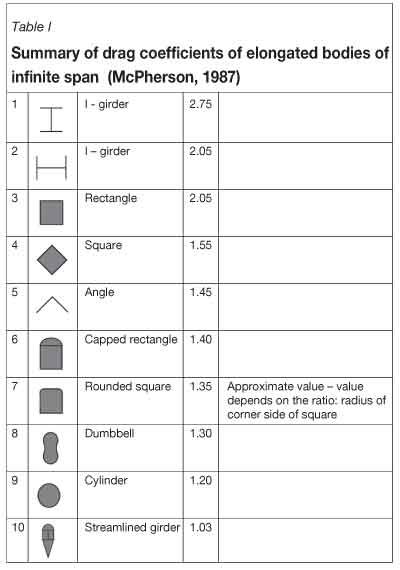
Buntons
The calculation of the resistance that the buntons offer the airstream is based on the drag that the buntons would experience. This drag is defined as follows (McPherson, 1987): 'A body placed in an airstream is acted on by forces due to the movement of the air past it. The force on the body that is parallel to the airstream is known as the drag and is proportional to the approach velocity to that body and of the air and frontal area of the body presented to the airflow'. Table I summarizes the drag coefficients of common bunton profiles.
The assumption that the airflow past a set of buntons is not affected by the presence of the buntons upstream limits the application of this theory. To estimate this effect, the calculation includes the use of an interference factor. This factor provides a formula which is based on measurement to estimate total effect subsequent buntons have on the overall resistance that a shaft offers to the ventilation flow through it.
Guides, pipes, and cables
It was noted that fittings such as these may actually reduce the resistance in a shaft. Nevertheless, the resistance they offer is estimated by subtracting the area of these fittings from the area of the shaft to obtain an increased air velocity. To calculate the resistance offered by fittings such as flanges, the free area used for the calculation of the increased velocity is reduced by the amount that the flanges reduce the overall area available.
It should be noted that no attempt was made to quantify the potential decrease in the shaft resistance as a result of the inclusion of these items or to quantify the additional turbulence that would occur as a result of the inclusion of discontinuities such as the flanges. It was, however, postulated that the reduction in resistance noted by Stevenson (1956) is based on the reduction of the swirl in the shaft.
Cages and skips
The calculation of these factors is based on work by Stevenson (1956). Stevenson used a horizontal duct of circular cross-section in which he placed cages of various configurations and sizes, and measured the response of the airstream to these. The resistance that these offer to the airstream has been included in Bromilov's calculation by the use of various factors applied to the cage based on its shape, size, and length.
McPherson (1987) built on this work. McPherson simplified and metricated the calculation of shaft resistances. The theory used in McPherson's paper was consistent with that proposed by Bromilov. He also evaluated the results from Stevenson's tests and included these in the evaluation of the resistances offered by conveyances in the shaft.
Computational fluid dynamics
Although CFD has many advantages, it does not eliminate the need for experimental results, which are still needed to validate numerical solutions. Meyer and Marx (1993) used CFD to evaluate the design of a fan drift-mine shaft intersection. A number of options were evaluated with respect to the geometry of this intersection. The results of the analysis demonstrated that savings could be achieved by adhering to certain ratios when defining the fan drift geometry. The economics of the potential reduction in pressure losses was also evaluated, and at the time this calculation showed that the cost of CFD analyses was difficult to justify.
This work was found to be one of the earliest works using CFD to resolve engineering issues on mines. Although little information is available on the use of CFD in the evaluation of shaft systems, the evaluations that have been completed indicate that this tool is worth investigating for the evaluation of shaft resistances.
The package used for the CFD analysis is STAR-CCM+ from CD ADAPCO, supplied by Aerotherm in South Africa. This package allows the 3D modelling of the shaft section under consideration by solving the continuity and momentum equations inside discrete cells. The various shaft geometries were modelled in the software using the 3D-CAD module supplied. This module allows the complete model to be developed in readiness for the mesh generation. The grid and boundary conditions used are discussed in Kempson (2012).
Summary of and conclusions from the shaft test results
Accuracy of the data
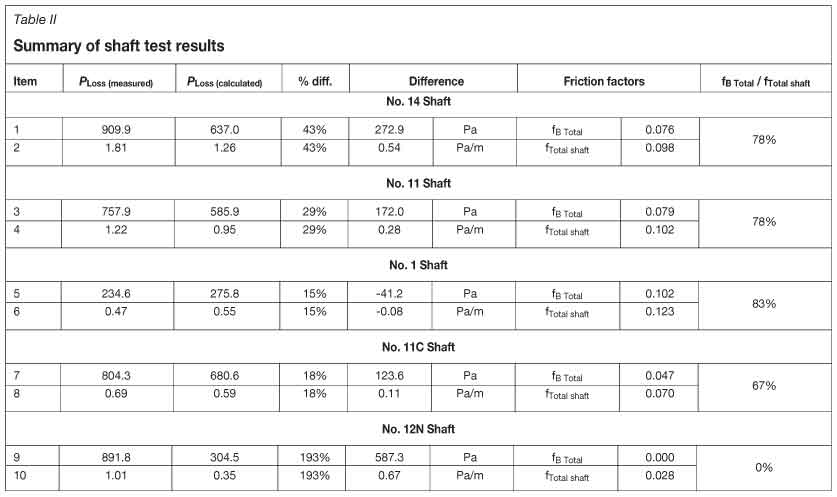
The results of the tests completed on the shafts show varying agreement with the values calculated from the current theory. The most significant difference is noted for the results of the tests for No. 12N Shaft. These showed very little agreement with the theory. No.12N Shaft is a rope-guided shaft and it was difficult to find a point to attach the pressure measuring device in the main ventilation portion of the shaft. It was therefore necessary to place the pressure-measuring instrument in the steelwork associated with the shaft bottom. It is assumed that the additional losses resulting from this steelwork resulted in a significant pressure differences in these readings. Unfortunately, this also means that the results of this test are of little use in the context of this work. As summary of the various findings can be found in Table II.
The four remaining shafts show differences varying from an average of 42% in the case of No. 14 Shaft to 15% in the case of No. 1 Shaft. To try and understand the reasons for these differences, the shaft configurations need to be considered.
The two shafts that show the least agreement are No. 14 Shaft and No. 11 Shaft. These two shafts both use the airflow buntons, each of which contributed 78% of the calculated friction factors for these shafts. These shafts are of similar configuration to No. 1 Shaft, which showed 15% difference between the measured results and the calculated results. The shaft asperities in the calculation were all equal at 10 mm and the ventilation flow rates for the shafts did not vary significantly (7.7 m/s for No. 1 Shaft, 10 m/s for No. 11 Shaft, and 9.4 m/s for No. 14 Shaft). This leaves two variables that could account for the differences, namely the drag coefficient used and the number and placement of pipes in the shafts.
The values used for the drag coefficient for the evaluation were taken from the tables supplied by McPherson (1987). In this instance, the shape closest to the airflow bunton was that of a dumbbell. This drag coefficient was calculated from the data presented by Martinson (1957). The same table was used to obtain the drag coefficient for the triangular bunton used in No. 1 Shaft. This coefficient was also obtained from measured data.
The drag coefficient highlights the potential pitfalls in calculations of this nature. The bunton friction factors supply a large portion of the resistance within the shaft and thus the effect of assumptions in the quantification of these data can be significant.
The additional resistance that a shaft offers to ventilation air flowing through it as a result of the pipes in the shaft is difficult to quantify. The theory indicates that this should be accommodated by reducing the free area of the shaft by the area of the pipe and adjusting the rubbing surface of the shaft in the calculation accordingly. This approach results in a friction factor for the pipes of less than 1% of the overall friction factor. This is not sufficient to account for the differences noted above. However, the contribution of the piping to the overall friction factor was more fully investigated during the CFD evaluation.
Finally, the accuracy of the instrumentation and its effect on the calculation also needs to be considered. The most significant of these is the potential contribution of the pressure measurements. The accuracy of these measurements can have the effect of increasing the calculated pressure losses by 12% or decreasing them by 29%. This relative accuracy must be borne in mind when evaluation the final results.
Conveyances moving in the shaft
The results of this analysis show that the effects of a cage moving in the shaft can be largely ignored. This conclusion is, however, valid only for shafts of similar cross-section to those considered here.
Results of CFD analysis
It should be noted in the presentation of these results that the overall pressure differences are given for the shafts being considered. These pressure differences are calculated for the particular shaft length and are, therefore, difficult to compare with each other. Thus a value of pressure loss per metre of shaft is also included to allow for this comparison. More detail is available in Kempson (2012).
A number of CFD simulations were run. These simulations consisted of building up the shaft cross-section incrementally. This was done so that the individual effects of the various items in the shaft, like the buntons, the guides. and the pipes could be quantified separately.
The CFD simulation results for the various shafts containing only the buntons or the pipes show little correlation to the theoretical analysis. The inclusion of pipes in the shaft resulted in a small decrease in the overall pressure drop in the shaft. This decrease was apparent only in the shafts that had comparatively fewer pipes. The expected decrease in the pressure drop seems to apply only when the total number of pipes is below a certain limit.
The small pressure drops as a result of pipes being included in the shaft are not apparent when the pipes are assumed to be flanged. In this instance, there is an increase in the overall pressure drop.
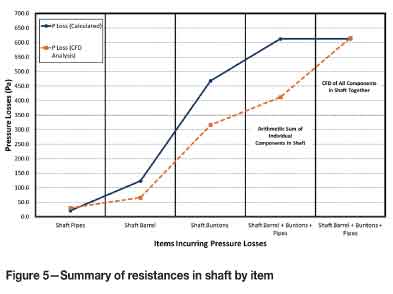
As the shaft was built up and the buntons and pipes were added, there was little correlation between the theoretical pressure losses and those predicted by the CFD analysis. This continued until a point was reached, as the piping was being added in its various configurations, when the resistance predicted by the CFD analysis equalled that of the theoretical analysis. The conclusion that was reached was that the interrelated nature of the equipment in the shaft increased the total resistance of the shaft by some 30%. This finding has two specific outcomes:
► The theoretical approach to the evaluation of shaft resistances, which consists of arithmetic adding of the Chezy-Darcy friction factors for the various items in the shaft and then using the total Chezy-Darcy friction factor to calculate the shaft resistance, is incorrect. Although the final values for the theory and the CFD analysis agree to within 5-15%, the actual make-up of the shaft resistance is not as the theory predicts
► The inter-related effect of the fittings in the shaft is stronger than was initially anticipated.
This effect is shown schematically in Figure 5.
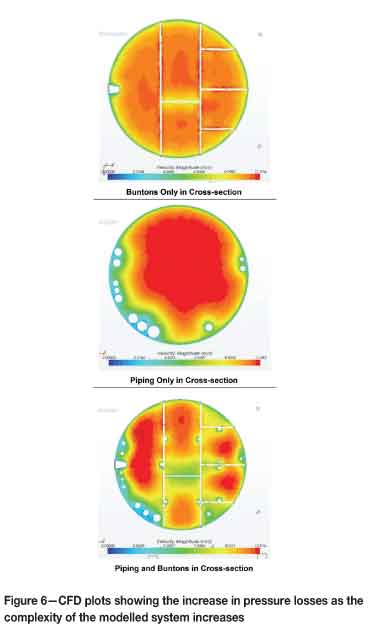
A schematic showing the shaft cross-section with different velocities is show in Figure 6.
Conclusions and recommendation
Specific conclusions
1) The current theory does not provide sufficient accuracy to be used in the design of new shafts that differ from the current shaft configurations. The reason for this is that, as noted above, the theory does not provide sufficient emphasis on the inter-related nature of the buntons, fitting, pipes, and guides. Therefore any modification to the shaft systems, specifically to increase the efficiency of the shaft, could have unanticipated and not necessarily beneficial results
2) The placement of the piping should be undertaken with care and the use of flanges to connect pipes in the shaft should be avoided as far as it is practically possible
3) The shape of the buntons used in the shaft has a significant effect on the overall pressure losses in the shaft. As the theory dictates, the more streamlined these are, the better
4) If the cage size is kept below approximately 30% of the total area of the shaft, it should not have a significant effect on the overall pressure losses in the shaft.
One of the more unfortunate finding of this analysis is that, in order to increase the efficiency of the shaft system, it is necessary to increase the complexity of the analysis. Thus it is recommended that if a shaft is to be designed efficiently and is to accrue the benefits described here, it should be subjected to a comprehensive CFD analysis.
As a final point, it should be noted that the calculated Atkinson friction factors are broadly in agreement with those supplied in the reference work 'Environmental Engineering in South African Mines' (Burrows, 1982).
Economic evaluation of shaft configurations
To ensure that the recommendations made in this work are valid, a number of additional options were evaluated using the CFD technique described above. The following specific scenarios were evaluated on a typical shaft configuration.
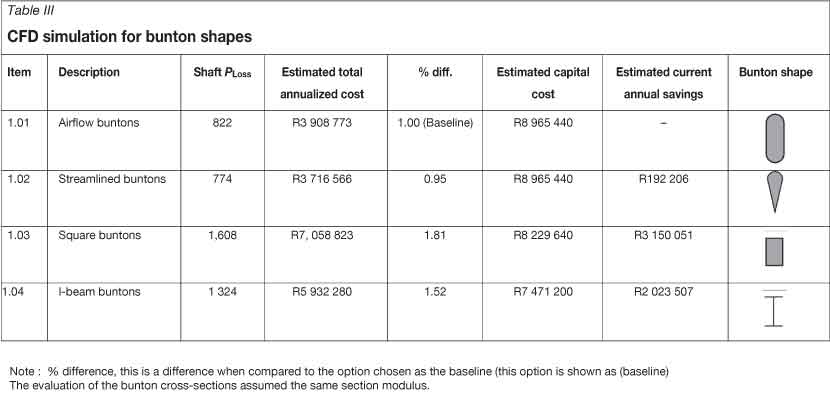
Economic evaluation of bunton shapes
Bunton arrangements (Table III):
► Shaft bunton arrangement with airflow buntons
► Shaft bunton arrangement with streamlined buntons
► Shaft bunton arrangement with square buntons
► Shaft bunton arrangement with I-beam buntons.
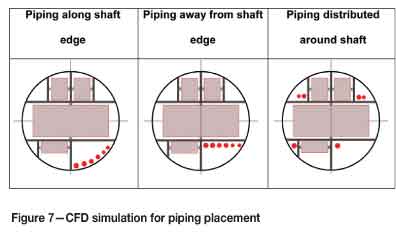
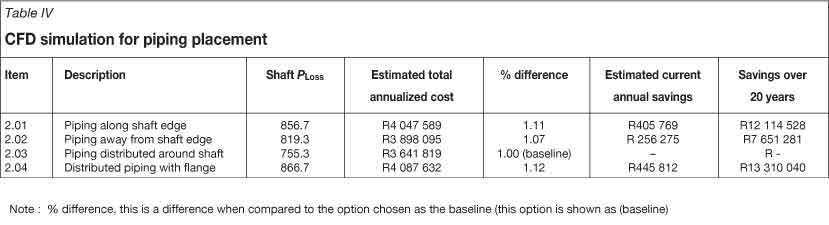
Economic evaluation of pipe placement
Piping placement (Table IV, Figure 7) (this option will be completed with airflow buntons.)
► Piping placed in same place along edge of shaft
► Piping placed near centre of shaft
► Piping distributed around shaft
► Option with the least resistance, including flanges.
Acknowledgements
James Janse van Rensburg - Group Ventilation Officer -Impala Platinum
Lister Sinclair - Business Unit Manager - Hatch
Karel Rossouw - Engineering Manager - Hatch
World Mining Congress 2013 - Portions of this paper were presented at this event.
References
Bromilov, J.G. 1960. The estimation and the reduction of the aerodynamic resistance of mine shafts. Transactions of the Institution of Mining Engineers, vol. 119, no. 8. [ Links ]
Burrows, J. 1982. Environmental Engineering in South African Mines. Mine Ventilation Society of South Africa, Johannesburg. 987 pp. [ Links ]
Craig, K. 2001. Report on CFD analysis of bunton sections. Report prepared for Anglo Operation Limited. November. [ Links ]
Chasteau, V.A.L. 1989. The Mine Ventilation Society of South Africa. Chapter 1. Environmental Engineering in South African Mines. CTP Printers Cape Town. [ Links ]
Deen, B.D. 1991. Field verification of shaft resistance equation. Proceedings of the 5th Mine Ventilation Symposium, West Virginia University, Morgantown, WV, 3-5 June. [ Links ]
Kempson, W.J. 2012. Optimising shaft pressure losses through computational fluid dynamics modelling. PhD thesis, University of Pretoria. [ Links ]
Martinson M.J. 1957. Determining the friction factors of Nos 2 and 3 Shafts, Harmony Gold Mining Co, by means of scale models. Journal of the Mine Ventilation Society of South Africa, March. [ Links ]
Marx, W.M., Von Glehn, F.H., and Wilson, R.W. 2008. Design of energy efficient mine ventilation and cooling systems. Proceedings of the Mine Ventilation Society Annual Conference, Pretoria, May. [ Links ]
McPherson, M.J. 1987. The resistance to airflow of mine shafts. Proceedings of the 3rd Mine Ventilation Symposium, Pennsylvania State University, University Park, Pennsylvania,12-14 October. [ Links ]
McPherson, M.J. 1993. Subsurface Ventilation and Environmental Engineering 2nd edn., MVS Engineering, Clovis, CA. pp 9-23. [ Links ]
Meyer, J.P. and Marx, W.M. 1993. The minimising of pressure losses in a fan drift-mine shaft intersection, using computational fluid dynamics. R&D Journal, vol. 9, no. 3. [ Links ]
Stevenson, A. 1956. Mine ventilation investigation. Shaft pressure losses due to cages. Unpublished thesis, Royal College of Science and Technology, Glasgow. [Also as: The estimation and the reduction of the aerodynamic resistance of mine shafts. Transactions of the Institution of Mining Engineers, Glasgow]. [ Links ]
Wallace, K.G. and Rogers, G.K. 1987. Airflow in ventilation and hoisting shafts. Proceedings of the 3rd Mine Ventilation Symposium, Pennsylvania State University, University Park, Pennsylvania,12-14 October. [ Links ]
White, F.M. 1986. Fluid Mechanics, 2nd edn. McGraw-Hill, New York. pp. 308-314. [ Links ]
Paper received Jul. 2012
Revised paper received Aug. 2013
© The Southern African Institute of Mining and Metallurgy, 2013. ISSN 2225-6253.

