


Serviços Personalizados
Artigo
 Inglês (pdf)
 Artigo em XML
 Referências do artigo
Indicadores

Links relacionados
-
 Citado por Google
 -
 Similares em Google
Compartilhar

 Permalink
Journal of the Southern African Institute of Mining and Metallurgy
versão On-line ISSN 2411-9717
versão impressa ISSN 2225-6253
J. S. Afr. Inst. Min. Metall. vol.113 no.12 Johannesburg Jan. 2013
GENERAL PAPERS
Application of ecosystem function analysis (EFA) in assessing mine tailings rehabilitation: an example from the Mhangura Copper Mine tailings, Zimbabwe
G.M. DowoI; S. KativuI; D.J. TongwayII
ITropical Resource Ecology Programme, Department of Biological Science, University of Zimbabwe, Mount Pleasant, Harare, Zimbabwe
IICoppin Place, Weetangara, Australia
SYNOPSIS
The widespread environmental damage caused by slimes dam construction requires rehabilitation as one of the key management strategies towards land restoration. From the time when Mhangura Copper Mine in Zimbabwe was shut down in 2000 due to viability problems, no follow-up studies were carried out on the slimes dams to assess their development with respect to ecosystem function and long-term recovery. The ecosystem function analysis (EFA) method was thus employed to achieve this end. EFA is a monitoring procedure that establishes how well an ecosystem functions as a biophysical system through the use of rapidly assessed field indicators. The field procedure makes use of simple visual indicators that are related to various soil surface processes. Conventional sampling methods are used to collect the vegetation data. The data was first analysed using landscape function analysis (LFA) software packages and then with various multivariate statistical techniques. In total 27 species were recorded from 14 families; 21 of them occurring in the acacia woodland and only 8 on the slimes dams. Hyparrhenia sp. was the dominant grass on Dam 5 and Imperata cylindrica dominated Dam 6. Acacia saligna was the most abundant tree species on the dams. The tree layer on the slimes dams was not as developed as the grass layer. The rehabilitated slimes dams converged with the natural woodland for the LFA indices of stability, nutrient cycling, and infiltration, which suggested a high level of functionality. The main factors affecting the sustainability of the rehabilitation are postulated to be fire, grazing, and tree harvesting. The study contributed to the importance of, and methods used for, assessing ecosystem function on rehabilitated slimes dams in Zimbabwe, which are often ignored as most efforts focus on the establishment of vegetation on the dams.
Keywords: ecosystem function analysis, EFA, mine tailings, rehabilitation, monitoring, Mhangura Copper Mine, ecosystem function.
Introduction
Until recently, assessments of rehabilitated tailings dams have been largely subjective and based on visual inspection (Randall, 2004). Rehabilitation progress has been judged mostly on the successful establishment of vegetation on tailings dams. Hence, much of the research so far carried out has focused on species trials and optimum conditions for plant growth on tailings (Hill, 1977, 1978; Northard and Figg, 1992; Nyakudya et al, 2011). Consequently, as noted by Ruiz-Jaen and Aide (2005), ecological processes have not been measured as much as vegetation structure and diversity in assessing rehabilitation success. Thompson and Thompson (2004) have also discussed the inadequacy of most current rehabilitation evaluation and monitoring methods that focus on a single species. The ecosystem function analysis (EFA) method addresses this shortfall by integrating ecosystem function with vegetation structure and complexity. The method is also diagnostic, as it specifically identifies vulnerable processes in an ecosystem, thus facilitating remedial action early in the rehabilitation process (Tongway and Hindley, 2004).
EFA is a monitoring procedure that establishes how well an ecosystem functions as a biophysical system through the use of visually assessed indicators (Tongway and Hindley, 2004). The notion of ecosystem function is based upon the observation that highly functional ecosystems strongly retain vital resources (water, soil, nutrients, and organic matter). However, as function deteriorates there is an increasing 'leakage' of these vital resources from the landscape.
Since Mhangura Copper Mine stopped operations in 2000 due to viability problems (Sango et al., 2006), no follow-up studies have been carried out on the rehabilitated slimes dams to assess their development with respect to ecosystem function and long-term recovery. It is a requirement of Zimbabwean law (Zimbabwe Environmental Management Act 13, 2002, Chapter 20: 27) that rehabilitation work should restore biota and ecological processes as far as possible. An approach involving the measurement of ecological processes was, therefore, necessary for such an evaluation to be undertaken. The EFA method was employed as a tool to achieve this end. The study aimed at ascertaining the success or otherwise of the rehabilitation of clad mine dams at Mhangura Copper Mine through an examination of ecosystem development. The approach centred on whether ecosystem processes on the dumps have developed to the extent that biotic and abiotic elements can begin to sustain their continued development without external intervention.
The specific objectives of the study were to compare specific ecosystem processes such as nutrient cycling, surface stability, and infiltration of the rehabilitated sites with the reference sites in order to determine the current status of rehabilitation with regards to long-term sustainability, to determine the key species acting as the drivers of the above processes, and to identify factors that influence slimes dump rehabilitation success and sustainability.
Materials and methods
Study area
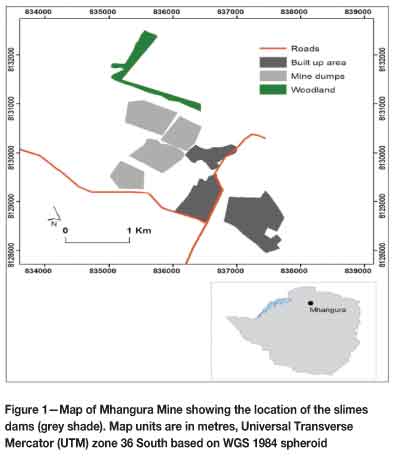
Mhangura Copper Mine lies approximately 186 km northwest of the city of Harare. It is located in the Mashonaland West Province of Zimbabwe, at approximately 16°53'S and 30°09'E (Figure 1). The mine area is surrounded by farmland that is used mainly for maize cultivation and, to a lesser extent, livestock grazing. Mhangura lies in Natural (Agro-climatic) Region II (Vincent and Thomas, 1960), which is characterized by high rainfall (750-1000 mm a-1) and intensive farming. This includes a dry, cool season from May to September when very little rain falls. The wet season is usually characterized by heavy rainfall from November to March. Geologically, Mhangura is one of the largest stratabound copper occurrences within the Proterozoic metasediments of the Lomagundi Basin (Mhangura Copper Mines, 1999). The mine's original resource was estimated to comprise some 60 Mt at 1.2% Cu, with 15-20 ppm silver and minor quantities of gold, platinum, and palladium (Mhangura Copper Mines, 1999).
Stratification
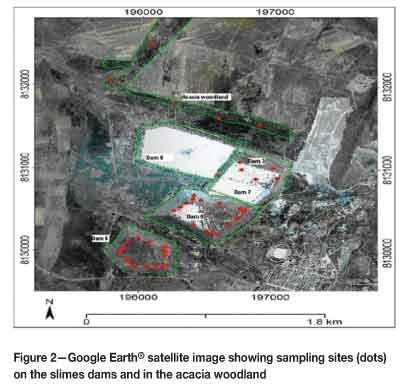
The study focused on rehabilitated slimes dams (Dams 4, 5, and 6) within the Miriam Shaft Complex. Although they were constructed separately, Dams 4 and 5 coalesce, such that they appear to be a single landform. Hence, for simplicity, in the present study Dams 4 and 5 are referred to as Dam 5. This particular slimes dam is older, having been constructed in the early 1970s, whereas Dam 6 was constructed in the early 1980s. The substrate on the dams is homogenous for all sites, although a cladding of organic matter in the form of domestic waste was also used. Sites were initially stratified according to dam number, which is related to dam age, thus resulting in a pseudo-chronosequence. If succession was taking place on the dams, it was assumed that different vegetation types would be observed based on the different ages of the dumps. Aspect provided a second criterion for stratification. Sampling sites were located on the north, south, east, and west sides of the dumps (Figure 2). Such stratification bore significance on the naming of the study sites. There was a delineation between sampling sites and units. The whole side of a dam was considered as a sampling unit in which several sites were delineated, e.g. D5N-01, D5N-02, and D5N-03 were different sampling sites within sampling unit D5N (i.e. northern slope of Dam 5). Stratified random sampling techniques were employed for the delineation with the aid of Google Earth® software. In each case, sampling sites were named in accordance with the slimes dam number first, followed by the aspect and the transect number. Thus, D5N-02 would be the second transect/site surveyed on the north side of Dam 5.
Reference sites
An acacia woodland lying to the north of and adjacent to Dam 8 was used as a reference site, representing a natural functional ecosystem (Figure 2). Reference sites are supposed to occur in similar biotic zones, in close proximity to the rehabilitated site, and exposed to similar natural disturbances (Society for Ecological Restoration International, 2004). Although the site was flat, and did not have similar topography to the slimes dams, it served in providing the biogeochemical potential for rehabilitation. It was also important to compare the rehabilitated sites with a site representing a dysfunctional ecosystem. For this purpose, the top of Dam 7 (also flat) was used (Figure 2). This dam was constructed in the late 1980s as an infill between Dams 3 and 5. The mine closed before Dam 7 was fully rehabilitated.
Randomization
Sampling points were randomly selected on each side of a dump and in the reference sites with the aid of Google Earth® satellite imagery software. The points demarcated positions of sampling sites. Coordinates of each point were recorded and then located in the field using a hand-held global positioning system (GPS).
Landscape function analysis (LFA)
The LFA fieldwork was carried out between October and December 2010. This period was chosen to coincide with the rainy season when plant production is high, as some of the LFA indicators are influenced by plant cover and biomass. The LFA was carried out according the guidelines in Tongway and Hindley (2004).
Statistical analyses
Preliminary analyses of the LFA data were carried out by means of the LFA software packages. The output consisted of various landscape function indices, for whole sites as well as for the different patches and interpatches. The landscape organization indices produced from the data are as follows: (a) number of patch zones per 10 metres, (b) total patch area, (c) patch area index, (d) average interpatch range, and (e) landscape organization index. The soil surface assessment calculations yielded three indices: (a) stability index, (b) infiltration index, and (c) nutrient cycling index. All LFA data was then log-transformed, and a Shapiro-Wilks normality test was carried out on the data using Paleontological Statistics Software Package (PAST). Since the data fitted a normal distribution, a one-way analysis of variance (ANOVA) was carried out to test for any significant differences among the sites by using STATISTICA. To further explore the relationships among sites in terms of functionality based on the LFA indices, principal component analysis (PCA) was carried out on the data using PAST.
Vegetation dynamics
Vegetation sampling was carried out between October and December 2010. This period coincided with the rain season when plant production is high and identification of plants, especially grasses, is easier as most of them are in flower at this time. The optimum number of transects per site was determined by sampling several transects in a pilot survey. A plot of number of transects against number of species encountered (an adapted species-area curve) resulted in a given number of transects for a particular site.
Hence, the number of transects differed from site to site. The more species-rich acacia woodland needed at least five transects, whereas for the slimes dams, at least three replicates per slope were deemed sufficient. The LFA transects were used as the reference transects. To obtain representative vegetation data, a separate measure was carried out for each of the life-forms, i.e. grasses, shrubs, and trees. The two methods used were the point-centred quarter method (PCQ) for grasses and the wandering quarter (WQ) for trees and shrubs (Mueller-Dombois and Ellenberg, 1974). Identification of the grasses in the field was aided by a grass manual (Lightfoot, 1975). Specimens that could not be easily identified in the field were pressed and identified later with the aid of type specimens housed in the Department of Biological Sciences Herbarium at the University of Zimbabwe. Trees and shrubs were identified in the field using field guides (Van Wyk and Van Wyk, 1997; Palgrave, 1989).
Statistical analyses
Preliminary analyses of the vegetation data were carried out by means of the EFA software package. The data was displayed as cover in square metres per hectare (x-axis) resolved into 0.5 m height classes (y-axis). Graphs were produced by the EFA software spreadsheet package to illustrate the functional role of the vegetation. The vegetation data was tested for normality using the Shapiro-Wilks normality test in PAST. Since the data was not normally distributed even after a log transformation, a non-parametric Kruskal-Wallis test was carried out to test for significant differences between sites on the basis of species composition (richness and abundance) using STATISTICA (version 5.0). To reveal the extent of these differences between the sites, on the basis of both species richness and abundance, a principal component analysis (PCA) of the vegetation data was carried out in PC-ORD.
Results
Vegetation dynamics
Species composition
The vegetation on the slimes tailings dumps consisted mainly of introduced species that were planted as a means of stabilizing the dumps and controlling dust.
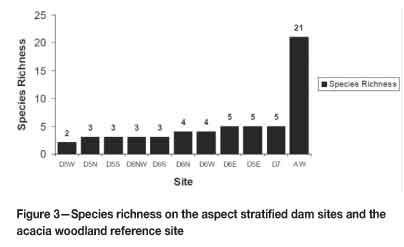
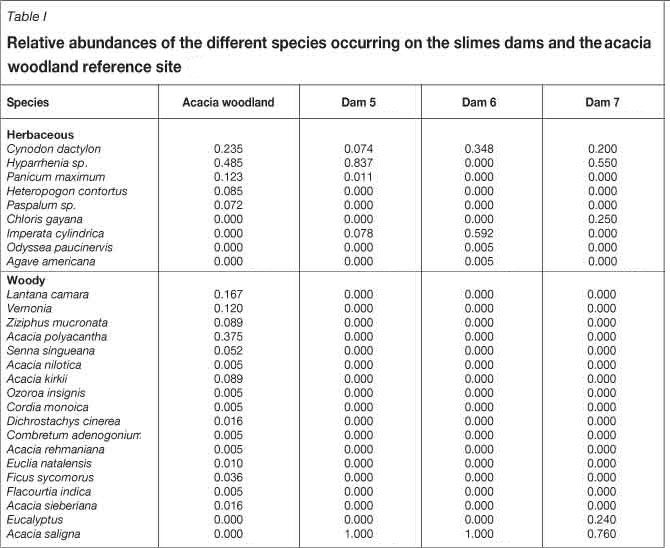
Grass species occurring on the dams were Cynodon dactylon, Chlorisgayana, Hyparrhenia sp., Odyssea paucinervis, and Imperata cylindrica. No shrubs occurred on the slimes dams. However, on the eastern slope of Dam 6, individuals of a succulent monocot, Agave americana, were recorded. There was only a single species occurring on the slopes of Dams 5 and 6, which is the Port Jackson Willow, Acacia saligna. The top of Dam 7, a reference site, also had the blue gum tree, Eucalyptus globulus, growing on it. More species were, however, recorded in the acacia woodland reference site. The acacia woodland had five species of grasses, including species unique to the woodland such as Paspalum sp. and Panicum maximum. The only grass species that overlapped between the dams and the acacia woodland were Cynodon dactylon, Hyparrhenia sp., and Panicum maximum. The shrubs recorded in the acacia woodland were Lantana camara, Vernonia colorata, Dichrostachys cinerea, Cordia monoica, and Euclia natalensis. Unlike the slimes dams, the acacia woodland contained a wide variety of indigenous acacias and other tree species as listed in Table I. There was no overlap in woody species between the slimes dams and the acacia woodland. Eucalyptus globulus was restricted to the top of Dam 7 only. Hyparrhenia sp. dominated the grass layer in all sites except Dam 6 (Table I). This dominance was most expressed on Dam 5, where Hyparrhenia covered almost the whole dam except for a few patches of Cynodon dactylon and Imperata cylindrica. On other sites, however, the relatively high abundance of Cynodon dactylon individuals reduced the relative dominance of Hyparrhenia sp. The dominant grass species on Dam 6 was Imperata cylindrica (Cogon grass). Other grass species that occurred in relatively small numbers in their respective sites were Heteropogon contortus and Panicum maximum in the acacia woodland; Panicum maximum and Imperata cylindrica on Dam 5; and Odyssea paucinervis on Dam 6. Dam 7 was dominated by Hyparrhenia sp., followed by a relatively even distribution of Cynodon dactylon and Chloris gayana. The exotic tree Acacia saligna was the most dominant woody species on the slimes dams, achieving relative abundance levels of 1.000 on Dams 5 and 6 and 0.760 on Dam 7, where Eucalyptus globulus was the only other species. The picture was different in the native acacia woodland, where there was greater species richness (Figure 3) and where even the most dominant species, Acacia polyacantha, had a relative abundance of 0.375. This was low compared to the relative abundance levels of Acacia saligna on the dam sites. Species that occurred at very low frequencies in the acacia woodland included Acacia nilotica, Ozoroa insignis, Cordia monoica, Combretum adenogonium, Acacia rehmaniana, and Flacourtia indica, all of which had a relative abundance of 0.005 (Table I).
Species richness
There was an evident difference in species richness between the dam sites and the acacia woodland reference site (Figure 3). For Dam 5, the lowest species richness occurred on the western aspect with only two species, whereas for Dam 6, it was on north-western and southern aspects, with three species each. On both of these dams, the highest species richness was on the eastern aspects with five species apiece. In total, 27 species were recorded from 14 families. Twenty-one of them occurred in the acacia woodland, and only eight occurred on the slimes dams. There was an overlap of three species between the slimes dams and the acacia woodland.
Functional role of vegetation
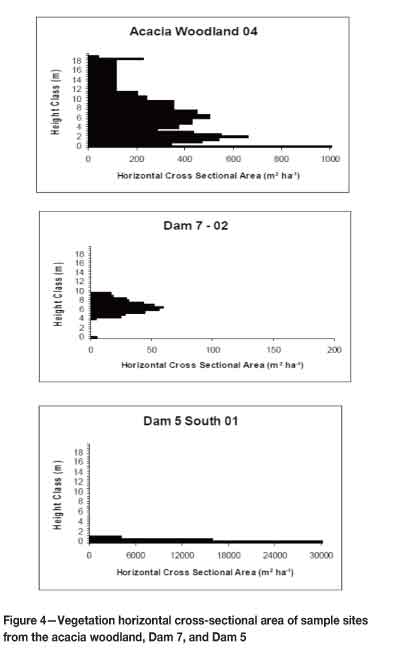
In the acacia woodland reference site, all life forms were represented, i.e. grasses, shrubs, and trees (Figure 4). There was good ground cover in the 0-0.5 m height class, with the layer attaining a cover of around 900 m2 ha-1. Woody species' canopy cover was most prominent in the 4-8 m height layer. In contrast, the Dam 7 reference site lacked a viable ground cover, with the grass layer covering less than 100 m2 ha-1. On Dam 7, there was also no shrub layer. Although present, the tree layer also had a canopy cover of less than 100 m2 ha-1 (Figure 4). The slimes dams, on the other hand, had considerable ground cover. Most extensive was the 0-0.5 m layer, which reached ground cover values of 30 000 m2 ha-1. There was also good ground cover in the height classes between 0.5-2 m on Dam 5 (Figure 4). Even though there was an extensive ground cover in the 0-0.5 m layer on Dam 6, there was not as much cover between 0.52 m as on Dam 5. Nevertheless, the ground cover was greater than that of the acacia woodland. The tree canopy cover on the slimes dams was very low when compared to the grass layer (Figure 4). Tree cover on slimes dams was also much lower than that of the acacia woodland
Statistical analyses
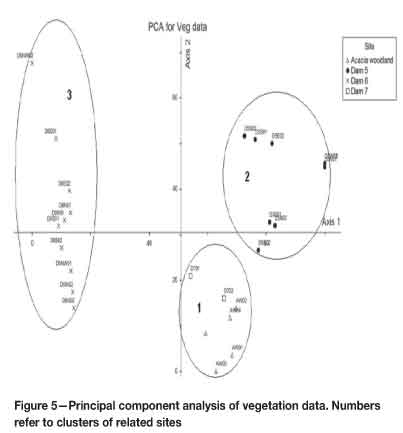
The vegetation data was tested for normality using the Shapiro-Wilks normality test. The data was not normally distributed according to the test (p < 0.05), and was thus log-transformed then re-tested for normality, but again failed the test (p < 0.05). To test for significant differences between sites on the basis of species composition (richness and abundance), a non-parametric Kruskal-Wallis test was therefore carried out. There were significant differences (p < 0.05) between the sites in terms of species abundance (p = 0.0107). A similar result of significant differences between the sites (p = 0.0018) was obtained for species richness (p < 0.05). These differences were also illustrated in principal component analysis (PCA). With an eigenvalue of 1390.44, Component 1 explained about 71.19% of the variance, whereas Component 2 (with an eigenvalue of 329.007) explained 16.85% of the variance. The PCA produced three separate groups (Figure 5). The first group consisted of Dam 7 (reference sites) together with all sites from the acacia woodland. The second group consisted of all sites from Dam 5, and the third group was made up of sites from Dam 6.
Landscape function analysis (LFA)
LFA indices
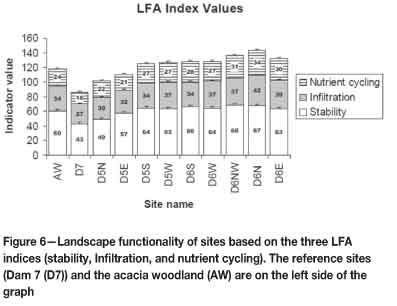
The values of the three main LFA indices (nutrient cycling, stability, and infiltration) were combined in order to graphically illustrate the difference in functionality between sites on the basis of all three indices. The sites were grouped on the basis of aspect for the slimes dams, and each reference site was made into a single group. The Dam 7 reference site is the least functional of all sites (Figure 6). The most functional site is D6N (Dam 6 northern aspect). On the slimes dams (excluding the reference dam) the least functional site was D5N (Dam 5, northern aspect). The stability index contributed the most to functionality on all sites.
Statistical analyses
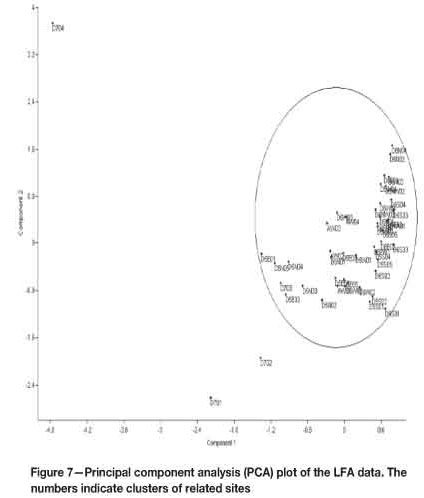
All LFA data was first log-transformed, and a Shapiro-Wilks normality test was carried out on the data. The data was normally distributed (p >0.05). Thus, a one-way analysis of variance (ANOVA) was carried out to test for any significant differences among the sites. There were significant differences among sites (p < 0.05). To further explore the relationships among the sites in terms of functionality based on the LFA indices, a principal component analysis (PCA) was carried out on the data. With an eigenvalue of 0.0884, Component 1 explained 90.96% of the variation and Component 2, with an eigenvalue of 0.0069, explained 7.07% of the variation. These two components were used to illustrate the relationships between the sites. The PCA showed close relationships in functionality between slimes dams and the acacia woodland reference site (Figure 7). However, three sites from Dam 7 reference site clustered further from the other sites. Site D704 (Dam 7, LFA transect 4) was the most deviant.
Discussion
Vegetation dynamics
Species composition and richness
A number of factors are responsible for the evidently low species richness observed on the slimes dams. Most of the species are introduced taxa that were planted after a careful selection process. Thus, only those species especially adapted to the geochemical environment provided by the tailings could become established (Northard and Figg, 1992). The chemical composition of the Mhangura slimes tailings includes high levels of copper and low levels of nitrogen, phosphorus, and potassium (Hill, 1977). Efforts to increase the diversity of tree species and shrubs were reportedly futile (Northard and Figg, 1992). Acacia saligna and Cynodon dactylon are some of the most tolerant species to metal toxicity, pH variation, substrate texture, and low nutrient availability (Hill, 1977, 1978). These two species were systematically planted on the Mhangura slimes dams (Hill, 1977; Northard and Figg, 1992). Therefore, it was expected that they would be the most dominant on the slimes dams. As expected, A. saligna is the most dominant woody species, thus confirming that other tree species are still failing to thrive on the tailings. However, C. dactylon is not the dominant grass as expected. Dam 5 is dominated by a species of Hyparrhenia and Dam 6 by Imperata cylindrica. The 'takeover' of Dam 5 (the oldest dam) by Hyparrhenia sp., a native grass, may point to a change in the chemical nature of the substrate that has created conditions more favourable to this species. Also, there is no evidence, either from published literature or from mine records, of any extensive planting of I. cylindrica on the slimes dams. It is possible that I. cylindrica could have invaded the tailings dams from surrounding vlei areas. However, its wide distribution and dominance on Dam 6 indicate an invasion of sites previously dominated by C. dactylon. Frequent fires favour the uniformity of an I. cylindrica monospecific sward, which usually occurs as a fire disclimax (Chadokar, 1977). This is attributed to its highly inflammable leaves and rapid regeneration from rhizomes (Chadokar, op. cit.). Since mine operations ceased in 2000, recurrent fires have been a continual feature of the slimes dams, and this must have favoured the establishment of I. cylindrica. I. cylindrica is of poor forage value (Wild, Biegel, and Mavi, 1972), a characteristic that also gives it an advantage since Dam 6 is regularly grazed by cattle and donkeys from nearby homesteads below the dam.
The low species richness for the western aspect of Dam 5 and north-western aspect of Dam 6 can be attributed to the effects of drought, which are most profound on these aspects as they receive the highest irradiance and, therefore, represent the hottest spots on the dams (Northard and Figg, 1992). This has resulted in the death of plant species on these sites, which have had to be replanted. Generally, exotic species are still the most dominant on the slimes dams.
Functional role of vegetation
In order to be properly functional, an ecosystem must have a wide diversity of plant forms, i.e. tall trees, short trees, tall shrubs, short shrubs, perennial grasses, annual grasses, and forbs (Kearns and Barnett, 1999). In such a case, species richness is of less importance (Tongway and Hindley, 2003). The native acacia woodland has this diversity of life forms, with a good grass cover, tall and short shrubs, as well as trees of varying heights. On the contrary, the top of Dam 7 (a dysfunctional reference) lacks an adequate ground and shrub cover, and is dominated by sparsely distributed trees. The rehabilitated slimes dams are between these two structural arrangements. They have an extensive ground cover, mostly dominated by the grass layer. The woody vegetation accounts for little of the cover on the slimes dams. Thus, the slimes dams still resemble an early successional community. The trajectory for a successful rehabilitation has 'a high initial ground cover spread, followed by a vertical extension of canopy as shrubs or trees developed, heading towards values exhibited by the analogue site.' (Tongway and Hindley, 2003). However, the fact that most life forms take decades to develop (Tongway and Hindley, op. cit.) means that rehabilitation success cannot be judged solely on this basis. The fact that the dams sites are still on the 'high initial ground cover' stage, without a significant 'vertical extension of canopy' after two decades of rehabilitation, shows that there could be some constraints influencing their rehabilitation trajectory. These may include wood harvesting, recurrent fires, and an unfavourable geochemical environment.
The fact that the grass layer is more developed on the slimes dams than in the natural woodland can be explained by the observation that grazing by cattle is more intensive in the acacia woodland. Even though the slimes dams are also subjected to grazing, this is on a lesser scale than in the woodland, perhaps due to the steep slopes on the slimes dams.
Landscape function analysis
Dam 6 sites are the most functional among all the sites sampled. This is due to their high values for the landscape organization index (LOI), stability, infiltration, and nutrient cycling indices (Figure 6). The LOI is related to the number and size of patches. This essentially means that Dam 6 sites have the greatest patch area. This may be attributed to the grass species Imperata cylindrica, which occurs mostly in uniform swards over the dam due to its rhizomatous habit. Therefore, this indicates a high retention capacity with respect to these sites. On the other hand, Dam 5 sites (most of which have a higher functionality than those from the acacia woodland) have a poorer landscape organization compared to Dam 6 sites. Hyparrhenia sp. is the dominant grass on Dam 5. It is a tussock grass that does not form uniform swards as does I. cylindrica. The grass layer in the acacia woodland is not as effective in retaining resources as on the slimes dams, due mainly to the reasons discussed above. The poorest landscape organization is that of Dam 7. There is virtually no grass layer, and the only protection is from sparsely distributed trees. Therefore, most resources are lost via wind and water, resulting in the creation of rills and gullies.
The high functionality of Dam 6 sites is also evidenced by their high stability index values (Figure 6). This indicates that there is good soil and litter cover on these sites. Cryptogamic vegetation that functions in stabilizing soil is well developed on Dam 6 sites. The surface has an intact crust, thus there are no loose soil particles available for erosion. The surface is resistant to disturbances, thus indicating the difficulty of releasing soil in an erosion event. High stability also means that the soil maintains its cohesion even when wet, thus preventing erosion. On the contrary, Dam 7 sites with the lowest stability values have poor cover. They are also characterized by an absence of cryptogams. The sites have severe rills and gullies, which indicates that there has been much soil loss. Acacia woodland sites have a lower stability, possibly due to the reduced grass cover and the trampling effect of grazing cattle. Dam 5 sites have lower stability values than those of Dam 6 due to their lack of cryptogam cover and lesser efficiency in erosion prevention by the tussock grass Hyparrhenia sp.
The infiltration index accounts for much of the observed high functionality of the Dam 6 sites. The high values for this index underscore the role played by the perennial grass cover on these sites. Such cover prevents runoff, thus increasing the infiltration capacity. The presence of litter and the rugged surface on Dam 6 also increase the infiltration capacity of the soil. The tailings are stable and have a significant incorporation of organic matter that improves their texture. On the contrary, poorly performing sites, such as those from Dam 7, lack perennial vegetation cover. They also have smooth surfaces that lack organic matter. These factors increase rates of runoff, and reduce the infiltration index values.
Nutrient cycling on Dam 6 sites is favoured by the widespread perennial vegetation cover that contributes much of the litter. The rough, intact surface of Dam 6 has a considerable presence of cryptogam that contributes to the nutrient-cycling. On Dam 7, nutrient cycling is obstructed by the lack of perennial vegetation cover, litter, and cryptogam. Dam 5 sites also lack cryptogam cover. In the acacia woodland, periodic fires prevent the accumulation of litter. The establishment of cryptogam is also hindered by cattle trampling.
The statistical analyses for the LFA, however, show a high similarity in functionality over the dam sites and the acacia woodland. Even though Dam 6 proves to be the most functional, its level of functionality is not very different from those of Dam 5 and the acacia woodland. This is unlike the case with Dam 7 sites, which are clearly dysfunctional. Therefore, the fact that the rehabilitated sites exhibit functional levels similar to or even greater than the natural woodland indicates a positive outcome of the rehabilitation work.
Conclusions
The sites are different in terms of the key species that drive the various ecosystem processes. On Dam 6, I. cylindrica proves to be the major ecosystem driver, whereas on Dam 5 and the acacia woodland, Hyparrhenia sp. is the key species. Unlike on the slimes dams, there is a multiple-layer contribution to functionality in the acacia woodland provided by the various indigenous trees and shrubs. This increases the woodland's resilience to disturbance because some species may substitute any that may be affected by perturbations. The fact that functionality of the dams relies on at most two key species, therefore, leaves the dams in precarious state in the presence of threats to these species
In terms of landscape function as determined by the LFA indices, there is an indication of convergence in functionality between the dams and the acacia woodland. Given that the acacia woodland is self-sustaining, it may be assumed that the slimes dams are also moving towards self-sustenance. Thus, the rehabilitation work carried out on the slimes dams is effective in arresting the net outflow of resources such as soil (tailings), propagules, water, and organic matter.
Recommendations for further studies
► The chemical composition of the slimes tailings dams need to be assessed. Since the dams are of different ages, comparisons need to be made to ascertain whether there is any relationship between age of site and its substrate chemistry. This should lead to an investigation of whether there are any changes in the substrate chemistry over time. This data could then be combined with the vegetation species composition data and LFA variables to determine any functional relationships
► The utilization of the slimes dams as habitats by different fauna could also be studied. During the present study (although not documented), it was observed that various fauna (birds, monkeys, duikers, hares, and reptiles such as snakes and chameleons were utilizing the dams as a habitat. These faunal assemblages could be studied, focusing on their different roles in creating a functional ecosystem, as well as how they respond to disturbances, such as fire and drought
► The role of microbial organisms on copper tailings has not been given much attention in Zimbabwe. The identification of micro-organisms (e.g. bacteria, lichens, and mycorrhizal fungi) associated with plants that have established successfully on the tailings might be helpful in the selection of potential plant species that could be used in rehabilitation.
References
Chadokar, P.A. 1977. Establishment of stylo (Stylosanthes guianensis) in Kunai (Imperata cylindrica) pastures, and its effect on dry matter yield and animal production in the Markham Valley, Papua New Guinea. Tropical Grasslands, vol. 11. pp. 263-272. [ Links ]
Hill, J.R.C. 1978. Mine dump reclamation. Chamber of Mines Journal, vol. 20, no. 7. pp. 30-33. [ Links ]
Hill, J.R.C. 1977. Establishment of vegetation on copper-, gold- and nickelmining wastes in Rhodesia. Transactions of the Institute of Mining and Metallurgy (Section A), vol. 86. pp. A135-A145. [ Links ]
Kearns, A. and Barnett, G. 1999. Use of Ecosystem Function Analysis in the mining industry. Proceedings of the Workshop on Indicators of Ecosystem Rehabilitation Success, Melbourne. Asher, C.J. and Bell, L.C. (eds.). Australian Centre for Mining Environmental Research, Canberra. [ Links ]
Lightfoot, C. 1975. Common veld grasses of Rhodesia. Natural Resources Board, Salisbury. [ Links ]
Mhangura Copper Mines (MCM). 1999. Mine Closure Plan. Unpublished report. [ Links ]
Mueller-Dombois, D. and Ellenberg, H. 1974. Aims and Methods of Vegetation Ecology. John Wiley and Sons, New York. [ Links ]
Northard, W.P. and Figg, I.1992. Slimes dam stabilisation and rehabilitation as practised at Mhangura Mine. Chamber of Mines Journal, vol. 34, no. 10. pp. 11-15. [ Links ]
Nyakudya, I.W., Jimu, L., Katsvanga, C.A.T. and Dafana, M. 2011. Comparative analysis of the early growth performance of indigenous Acacia species in revegetating Trojan Mine tailings in Bindura, Zimbabwe. African Journal of Environmental Science and Technology, vol. 5, no. 3. pp. 218-227. [ Links ]
Palgrave, M.C. 1989. A Guide to the Trees and Shrubs of Mukuvisi Woodlands. IUCN, Harare. [ Links ]
Randall, J. 2004. Ecosystem Function Analysis (EFA) - a tool for monitoring mine site rehabilitation success. MESA Journal, vol. 35. pp. 24-27. [ Links ]
Ruiz-Jaen, M.C. and Aide, T.M. 2005. Restoration success: How is it being measured? Restoration Ecology, vol. 13, no. 3. pp. 569-577. [ Links ]
Sango, I., Taru, P., Mudzingwa, M.N., and Kuvarega, A.T. 2006. Social and biophysical impacts of Mhangura Copper Mine closure. Journal of Sustainable Development, vol. 8, no. 3. pp. 186-204. [ Links ]
Society for Ecological Restoration International (SER). 2004. The SER Primer on Restoration Ecology. Science and Policy Working Group. Society for Ecological Restoration International. www.ser.org [ Links ]
Thompson, S.A. and Thompson, G.G. 2004. Adequacy of rehabilitation monitoring practices in the Western Australian mining industry. Ecological Management & Restoration, vol. 5, no. 1. pp. 30-33. [ Links ]
Tongway, D.J. and Hindley, N.L. 2003. Indicators of Ecosystem Rehabilitation Success. Stage Two - Verification of Indicators, Final Report. CSIRO Sustainable Ecosystems, Queensland. [ Links ]
Tongway, D.J. and Hindley, N.L. 2004. Landscape Function Analysis: Procedures for monitoring landscapes with special reference to minesites and rangelands. Canberra: CSIRO Sustainable Ecosystems, [ Links ]
Vincent, V. and Thomas, R.G. 1960. An agricultural survey of Southern Rhodesia: Part I Agro-ecological survey. Government printer, Salisbury. [ Links ].
Van Wyk, B. and Van Wyk, P. 1997. Field Guide to Trees of Southern Africa. Struik, Cape Town. [ Links ]
Wild, H., Biegel, H.M., and Mavi, S. 1972. A Rhodesian Botanical Dictionary of African and Plant Names. 2nd edn. Government Printer, Salisbury. [ Links ]
Zimbabwe Environmental Management Act 13. 2002. Section 114. Minister may make order for protection of environment. www.law.org.zw [Accessed 21 May 2010]. [ Links ]
Paper received Jun. 2011
Revised paper received May 2013
© The Southern African Institute of Mining and Metallurgy, 2013. ISSN 2225-6253.

