


Services on Demand
Article
 English (pdf)
 Article in xml format
 Article references
Indicators

Related links
-
 Cited by Google
 -
 Similars in Google
Share

 Permalink
Journal of the Southern African Institute of Mining and Metallurgy
On-line version ISSN 2411-9717
Print version ISSN 2225-6253
J. S. Afr. Inst. Min. Metall. vol.113 n.11 Johannesburg Nov. 2013
Petrological characterization of coal: an evolving science
J.M. Richards; G. Naude; S.J. Theron; M. McCullum
Mineral Processing, Metallurgy Research and Development, Exxaro Resources Ltd., Pretoria, South Africa
ABSTRACT
For most of the 20th century optical petrography has been the primary petrological and mineralogical tool used to characterize coal. The development of quantitative SEM-based techniques, e.g. QEMSCAN®, for coal began only about a decade ago. The application of these techniques for coal lagged behind other commodities, but they are currently being developed with the aim to provide 'one complete analysis' for coal. Quantitative SEM-based techniques are supplemented by quantitative X-ray diffraction (XRD).
Recent indications are that these more modern techniques cannot replace the 'standard' petrographic and chemical evaluations, but rather complement them where and when required. The great advantage of quantitative SEM-based techniques is that they are very rapid, with the result that large volumes of samples can be processed on a routine basis. This is ideal for coal type identification, since the results can be used in the creation of 'intelligent' composites. This can lead to the more speedy evaluation of coal deposits by reducing the number of samples on which detailed metallurgical and characterization test work is required, without an increase in the overall statistical error of the resource model.
Coal petrography, however, remains important for the prediction of the coking characteristics of certain coals and coal products. As a consequence it is therefore important that any coal laboratory be able to produce data with confidence. This requires strict quality control and assurance protocols that adhere to international standards.
Keywords: coal petrography, coking strength, scanning electron microscopy, QEMSCAN®.
Introduction
Coal petrography, which includes both the microscopic identification of the different constituents of coal and the determination of coal rank by measurement of vitrinite reflectance, is a very important tool in the characterization of coal deposits and coal products (Stach, et al., 1982; Suárez-Ruiz, 2012). The characterization and classification of coal for coke-making is important in that it allows for selection of coals of a specified quality for particular coking operations, or for prediction of the quality of the coke that will be produced under given conditions. Most of the methods of sampling, preparation, and- analysis for coal petrography are the subject of standard methods elaborated by a working group within ISO (International Organization for Standardization) Technical Committee TC 27 for Solid Mineral Fuels, whose purpose it is to develop test methods that are used for international trade, but which can also be adapted as national standards by any country.
In the coke-making industry, the strength of metallurgical coke is one of its most important properties, and perhaps one of the most important uses of applied coal petrography is the ability to predict coke strength (ASTM stability) from single coals and coal blends (Crelling, 2008; Ward and Suárez-Ruiz, 2008). The rank and maceral composition of a coal affects the strength of the coke produced as well as its expansion/contraction characteristics, which ultimately may impact on wall pressure in a slot-type coke oven (Clendenin, 1969). For coke stability prediction, the ratio of reactive to inert macerals is of particular importance. Reactive macerals comprise vitrinite, liptinite and, particularly in southern hemisphere coals, so-called reactive semi-fusinite (RSF). The latter is a term strictly used for South African coals to describe a low-reflecting form of inertinite considered to be reactive and which can contribute to the reactivity of a coal during carbonization (Snyman, 1989). Thus, according to Steyn and Smith (1977), the evaluation of South African coals for their coking properties requires the separate assessment of the amount of reactive semi-fusinite present.
The inert components generally include micrinite, macrinite, fusinite, the remaining semi-fusinite, and mineral matter (Crelling, 2008). In coke-making, for each rank of coal, an optimum amount of inerts is required to achieve the highest coke strength. This relationship is quantified in the composition balance index (CBI) as the ratio between the measured percentage of inerts and the percentage of inerts necessary to produce a coke of optimum strength. For instance, a CBI value of less than 1.0 indicates a deficiency of inerts, while a CBI greater than 1.0 indicates that the inert content is too high and the reactive content too low. In addition, the rank index (RoR, the mean maximum reflectance of the reactives at λ 546 nm) is used as a measure of the relative strength of the reactive macerals in a coal: the higher the rank of the reactives, the greater the resulting coke strength. Calculation of the RoR and CBI from the maceral composition and rank of a coal allows the petrographer to predict coke stability by using the coke strength correlation curve. This technique is particularly appropriate for the prediction of Micum 10 values (M10). Therefore coal petrographic analysis is an extremely useful tool for the identification of suitable coking coals. As a consequence it then becomes particularly important that maceral content and rank are determined correctly and objectively, since the amount of total reactives and total inerts can affect calculation of RoR and CBI and thus the prediction of coke stability. Unfortunately there are a number of circumstances that may arise which can affect the repeatability of results. These can include:
- Subjectivity of the coal petrographer/laboratory
- Quality and/or lack of training of the coal petrographer
- Aging and deterioration of instrumentation/equipment
- Technological advances in instrumentation/equipment
- Evolving of large databases over a considerable time period
- The availability of new techniques, such as quantitative SEM-based techniques and quantitative XRD, which can provide additional information.
Stratagems that can be put in place to minimize any adverse effects on the integrity of petrographic data are therefore essential.
The fundamental technique of choice still remains oil immersion petrography, although techniques based on the scanning electron microscope (SEM) such as QEMSCAN® are fast making an impact on modern-day techniques. These SEM-based techniques have in many respects replaced optical microscopy as the dominant mineralogical characterization tool in several commodities, such as base and precious metals.
The development of quantitative SEM-based techniques for coal began only about eight to ten years ago. The application of these techniques for coal has lagged behind other commodities, but there are currently attempts to develop these technologies to provide 'one complete analysis' for coal.
An attempt will be made to show that validation and integration of petrographic, chemical and SEM data is crucial to the development of a viable database in coal mining.
Data collection
Sampling and sample preparation
For quantitative petrographic analysis, it is important that coal samples should be representative of the parent material,- whether individual seams of coal or mined, crushed, and beneficiated coal products. Sampling techniques are described by specific ISO standards, as well as national standards such as ASTM, SANS, etc.
In addition, the preparation of coal for petrographic (microscopic) examination follows an International Standard, namely ISO 7404-2. It involves crushing the sample to pass a 1 mm sieve and then riffling to obtain a 15 g representative sample, which should be as representative as the samples used for proximate analyses.
Errors in sampling can result in a bias or non-representative sample and therefore the analyses of such a sample will contain errors or anomalies in the resultant petrographic database, for example.
Subjectivity
Competent coal microscopy is highly dependent on the correct training of the analyst. The knowledge and experience of the petrographer is the ultimate solution to eliminating subjectivity in the identification of macerals, especially in coals that are not vitrinite-rich. In recognizing that subjectivity in identification of macerals resulted in discrepancy of results when compared between petrographers, the International Committee for Coal and Organic Petrology (ICCP), implemented some 20 years ago an International Accreditation Programme. This, together with the development of international standards as set out in several ISO documents, not only for the preparation of coal polished blocks, but also for coal and maceral characterization, has resulted in increasing reproducibility of analyses, and greater confidence in the results obtained, between different petrographers ( International Committee for Coal and Organic Petrology, 2001; ISO 7404-1: 1994; ISO 11760: 2007; ISO 7404-2: 1994; ISO 7404-3: 1994 and ISO 7404-5: 1994). The accreditation programme is carried out every two years, and tests the ability of an applicant to correctly identify the principal maceral groups (vitrinite, liptinite, and inertinite as well as mineral matter) and determine the rank of the coal in a number of unidentified samples. Specific coal sections are sent to applicants from all round the world, together with prescribed procedures as to the re-polishing of the section and recording of reflectance and maceral counts. The ICCP collates the responses from all applicants, and calculates the results and standard deviation before awarding accreditations, which are valid for the two years, after which the accreditation requires renewal. This is the single coal blend accreditation programme (SCAP); the ICCP runs several other petrographic accreditation programmes. It is, perhaps, worth noting here that it is the petrographer that receives the accreditation, and not the laboratory that employs the petrog-rapher.
Training and quality control
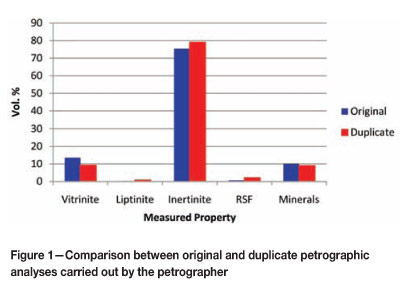
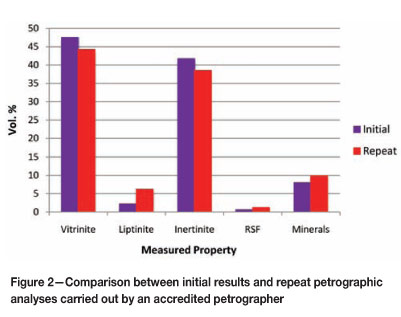
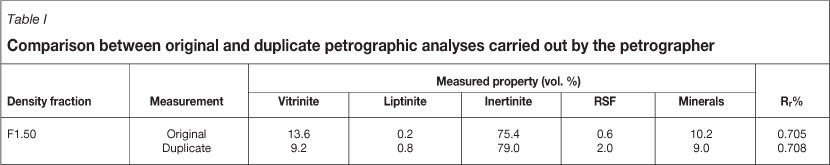
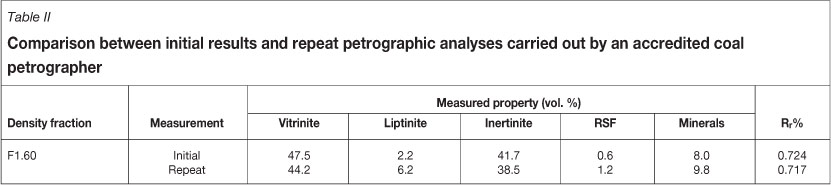
Training and quality control are an essential part of the responsibilities of a coal laboratory. While it may not be necessary that all petrographers be accredited, it is important that quality control on the output of the laboratory be conducted routinely by an accredited petrographer using random samples. Should this procedure not be adhered to, then there is always the possibility that misidentification and bad practices can become part of standard procedure in that particular laboratory. Quality control can be instituted by setting in place a system of internal cross-checking whereby for every tenth sample, a duplicate block is produced and duplicate petrographic analyses of both maceral composition and rank determination are carried out by the petrographer (Table I, Figure 1). Furthermore, every twentieth polished section is recounted by a supervisor, who should be an internationally accredited coal petrographer, and compared to the original data produced (Table II, Figure 2). In the case of duplicate analyses, differences of up to 3 per cent in the same component are acceptable (Falcon and Snyman, 1986). The ISO 7404-3: 1994 specifications indicate that the repeata-bility1 limit should vary between 2.8 and 6.3 per cent, depending on the concentration of the coal components, and the reproducibility2 limit should vary between approximately 4 per cent and 13 per cent, depending on the rank and heterogeneity of the coal. The continuous application of these control measures inspires a high degree of confidence in the results produced by the laboratory.
Ongoing training and development programmess need to be established by the laboratory. The training of new petrog-raphers is usually carried out 'in house' and should preferably be overseen by an accredited petrographer. Any training programme should include the repeat analysis of samples already counted by an experienced petrographer and which have already passed a quality control test. Once there is an acceptable convergence of results, then the trainee can be regarded as competent within the laboratory, but this does not negate the need for ongoing quality control measures.
As an example of what can go wrong with respect to inadequate development programmes and lack of reliable quality control, Exxaro has in the past encountered a problem-
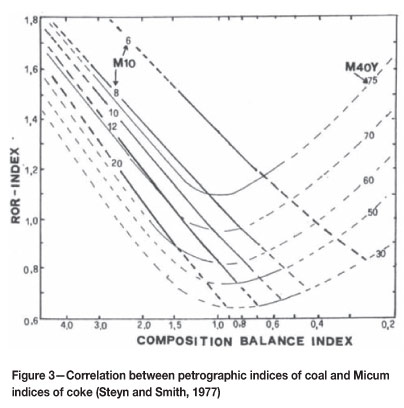
==1 Same petrographer, same block, same apparatus, and same number of points with the misidentification of reactive semi-fusinite (RSF) - a form of the inertinite group that is regarded as one of the constituents of the reactive group in coals, but which can easily be confused with fine-grained inertodetrinite. While both inertodetrinite and RSF belong to the inertinite group of macerals, RSF has been found to also contribute to the reactive group of macerals, whereas inertodetrinite does not. This then impacts on the calculation of various indices and eventually the prediction of coke quality (Figure 3) (Jordan, 2006; Schapiro and Gray, 1964). Problems such as these can readily be overcome by implementation of a reliable quality control programme and the use of independent accredited and competent consultants.
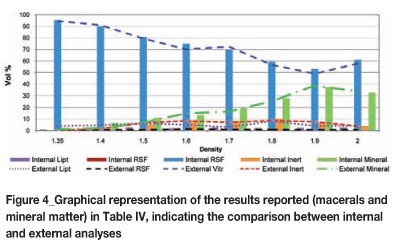
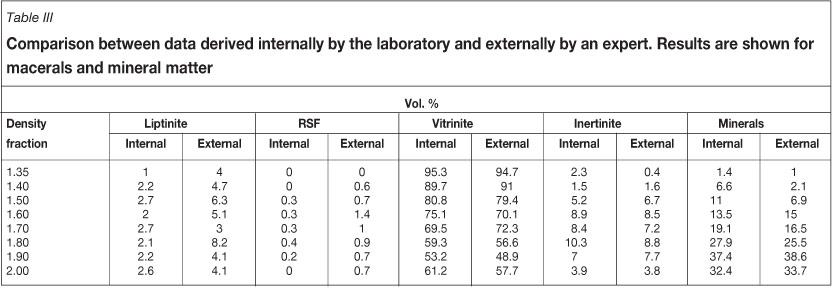
Training and quality control practices in a laboratory can be supplemented by round robin exercises between laboratories or by the use of national and international experts and consultants who can carry out a number of routine analyses of a small number of randomly selected samples for comparison purposes. Results should also be validated regularly by submitting samples for recounting by an independent consultant who also has international accreditation (Table III, Figure 4).
Advances in instrumentation
An example of the extent to which instrumentation can affect petrographic results was encountered by Exxaro when new microscopy equipment was purchased. The new equipment is used for reflectance measurements and petrographic composition, and also has fluorescence capabilities to verify the presence of liptinite in coal. Past equipment was substantially older, with less powerful illumination and less advanced optics and no fluorescence capabilities. The first and most noticeable difference in using the new microscopes was in the ability of the petrographer to recognize liptinite in the coal. For example, in bituminous coals (with a rank of about Rr 0.7%) liptinite tends to be fairly dark in appearance, particularly the alginites, and these often merge in white light with the background resin, with the result that liptinite can be easily overlooked or regarded as mineral matter, which can also be of dark appearance. Consequently, with use of the new equipment, there was suddenly a marked increase in the amount of liptinite identified in the coal samples. Such issues can be resolved by statistical analysis, which is dealt with later. Evidently the ability to correctly identify liptinite has increased the confidence of the petrographer, and improved results.
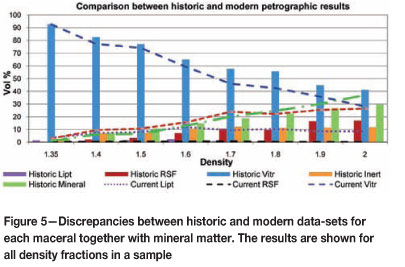
Database evolution
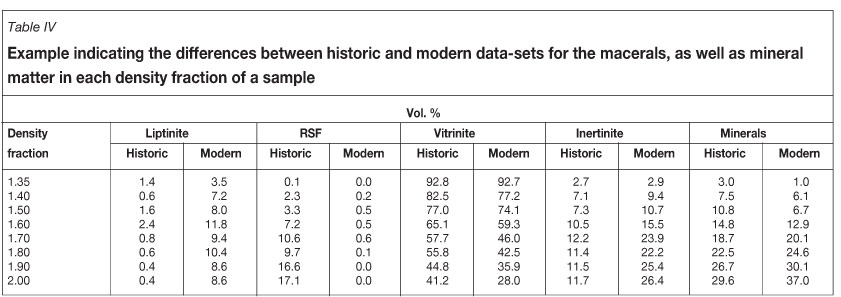
It should now be obvious that data can change with time for a number of unrelated reasons (Table IV, Figure 5). It then becomes important that whenever significant changes take place in the collection of data, checks and balances are put in place so that comparison of data across the complete database remains valid. Should there be significant changes in the data that have been verified by repeat analysis of a statistically valid number of samples, then the database needs to be interrogated and a conversion factor or factors established to maintain integrity of the entire database.
Statistical analysis and the establishment of conversion factors
When Exxaro started to incorporate data produced with improved instrumentation into the database for a particular mine, it soon became apparent that there was a step jump in the quality of the data being produced. To ensure that comparisons across the entire database remained valid, a statistical exercise was undertaken to establish whether it was possible to construct a conversion factor or factors that could be used to relate the different parts of the database. This statistical analysis was carried out by the Statistics Department of the University of Pretoria.
The data that was used for this exercise included all seams from two complete boreholes with samples from each seam subdivided into eight different density fractions. Complete maceral identifications using the old instrumentation as well as the new microscopes were carried out, with vitrinite, liptinite, inertinite, RSF, and mineral matter being recognized and counted. This data was then analysed statistically in order to build a regression model or models from which correction factors could be determined that could be applied across the historic parts of the database. The goodness of fit of a model may be judged in terms of the squared multiple correlation coefficient R2, which represents the proportion of the variability in the response variable explained by the regression equation, e.g. if R2 = 0.9, then the regression explains 90 per cent of the variability, which- means that the unexplained variability is reduced by 90 per cent.
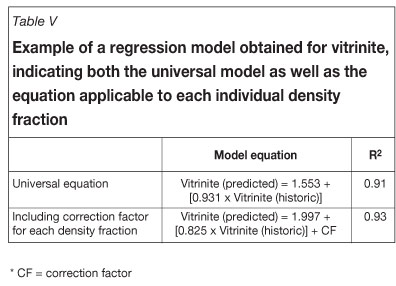
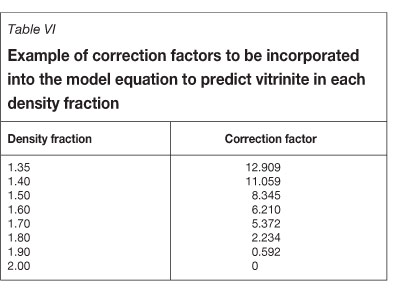
The differences in the liptinite and RSF contents of the two Exxaro boreholes were sufficient to the extent that they impacted on the determination of inertinite and mineral matter, and also, to a lesser extent, of vitrinite. As a result, a regression model for each maceral (vitrinite, liptinite, inertinite, and RSF) and mineral matter was built that predicts the internal (new microscopy results) measurement percentage for each component based on the external (or older microscopic results) measurements and densities. For each pair of results, a model equation was built that could be applied to the coal component in question throughout the entire data set, as well as a model equation that incorporates a correction factor for each density fraction (those used varied between 1.35 and 2.00 g/cm3). Thus by adding a correction factor, the model equation can be adjusted to calculate the predicted value of the maceral in each individual density fraction in every sample.
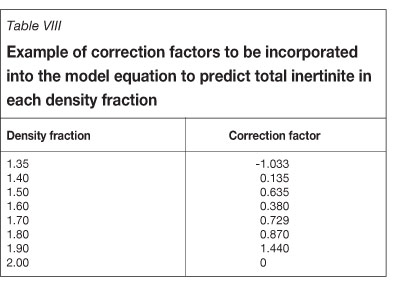
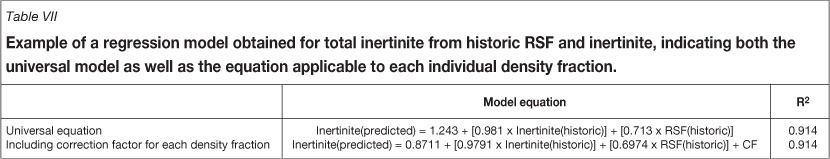
The results obtained from this approach were somewhat mixed; good regression models could be established for vitrinite, inertinite, and mineral matter (Table V, Table VI), but models for liptinite and RSF were initially more problematic. However, by combining the RSF and inertinite content of historic samples, a relatively accurate picture of the total inertinite content could be gained because it appeared that the wrongly identified RSF should have been identified as inertinite, and RSF belongs to the inertinite group anyway. As a result, additional statistical analyses were carried out to obtain a regression model for combined RSF and inertinite in order to calculate the true inertinite present by determining a single correction factor that could be applied to historic inertinite and RSF data (Table VII, Table VIII).
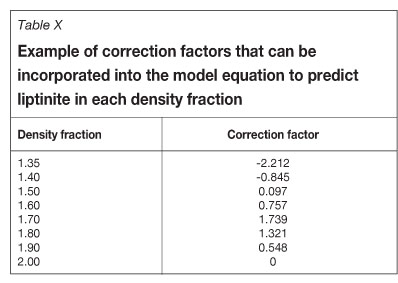
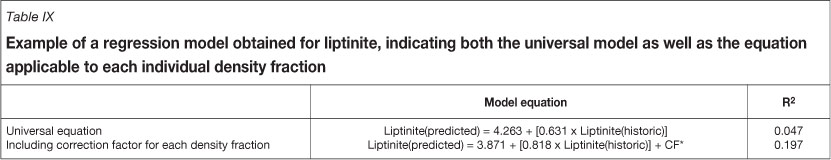
In the case of liptinite, it was found that large and nonuniform discrepancies existed between the historic and new- maceral analyses, which made it impossible, with the amount of data available, to produce a good regression model and hence a correction factor that could be applied to liptinite (Table IX, Table X). Fortunately, the amount of liptinite present in most samples from these particular boreholes was small so that the impact on the calculation of total reactives in any one sample was not particularly significant. Also, because the use of more modern equipment resulted in larger percentages of liptinite being recognized, any total reactive data used from the historic database can be regarded as a conservative estimate of total reactives, as the liptinites were generally under-reported.
The integration of new technologies
Quantitative SEM-based technologies, such as QEMSCAN®3, have contributed immensely to the mineralogical evaluation of ores during the past two to three decades (Pirrie et al., 2004; Coetzee et al., 2011). These techniques have in many respects replaced optical microscopy as the dominant mineralogical characterization tool in several commodities, e.g. base (Cu, Zn, Ni, Pb, Co etc.) and precious (Au-Ag and PGEs) metals, and as well as some industrial minerals (Ti-and Zr-sands etc.).
The QEMSCAN differs from a normal SEM in that, in addition to a SEM and attached energy dispersive spectrometers (EDS), it includes highly advanced image analyses software. This enables the QEMSCAN to be calibrated for different phases, including coal macerals, using the backscatter electron (BSE) signal and EDS spectra collected. Two-dimensional (2D) spatial resolutions can vary from 100 µm to 0.08 µm.
The development of quantitative SEM-based techniques for coal began only about eight to ten years ago (Van Alphen, 2007; Matjie et al., 2011). The development of these techniques for coal lagged behind other commodities, even other bulk commodities such as iron ore and bauxite, for several reasons.
Production of bulk commodities, including coal, often involves relatively minimal processing, with large portions of the ore being sold as coarse to very coarse products (>6 mm, up to 45 mm). This is in stark contrast to base and precious metals, which in most cases require fine grinding (<150 µm) and extensive additional processing (e.g. multi-stage flotation, leaching, smelting etc.). Quantitative SEM-based techniques have been developed specifically for the latter, as very small, homogenized, representative sub-samples of these ores and subsequent products can be easily prepared and analysed with high degrees of accuracy and repeatability. A wide range of quantitative information can be gathered on both the minerals and particles, including:
- Bulk modal mineralogy
- Liberation or exposure of selected minerals
- Mineral association of selected minerals
- Grain size distribution of selected minerals
- Particle size distribution of selected particles
- Bulk mineralogical calculated chemistry of the sample or selected portions thereof (theoretical process evaluations)
- Selected elemental deportment/distribution across minerals or selected particles.
These quantitative SEM-based techniques on coal are still constrained by the particle size of coal products and sample preparation techniques, including mounting media. Epoxy resins are usually used for all other commodities, as the bulk atomic density is well below that of most of the common rock-forming minerals. However, pure coal macerals exhibit bulk atomic densities lower than that of epoxy resin. An alternative mounting medium thus had to be found. Carnauba wax is currently the most common mounting medium for coal, but due to its inherent characteristics, also presents some challenges.
QEMSCAN® development
As with other commodities, the first step in the quantitative evaluation of coal by SEM-based techniques is the creation of a mineral/phase calibration file. In QEMSCAN® terminology, this is known as a species identification protocol or SIP file. SIP files are built using two data sets produced by the SEM with attached EDS, technology on which the QEMSCAN® is based, namely:
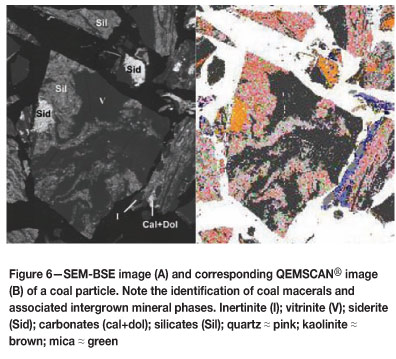
- The back-scatter electron (BSE) signal, which is based on the atomic density of the phases observed, where a phase made up of heavy elements such as gold (Au) will be bright (BSE counts approximately 232), while a phase made up of lighter elements such as quartz (SiO2) will be dark (BSE counts approximately 42) (Figure 6). Vitrinite, consisting mainly carbon and other light elements such as H, N, O, and S, exhibits a much lower BSE signal (BSE counts approximately 18-19)
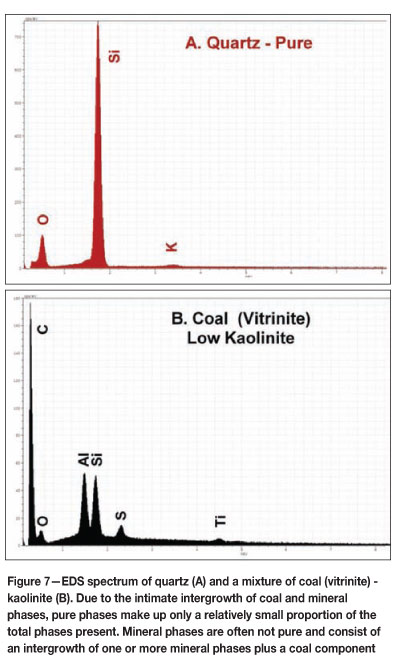
- The energy dispersive spectrum (EDS) chemical signal, which is based on the counts per element or element channel. For example, depending on the count rate required and the kV excitation energy used, the EDS counts for quartz (SiO2) are approximately 740 in the Si channel and 100 in the O channel, with a background of <20 counts. Vitrinite, for example, is characterised by EDS counts of approximately 180 in the C channel, 10 in the O channel, and 15 in the S channel, with a background varying between 2 and 5 counts (Figure 7). Coal often contains inorganic elements, usually clay, with the result that counts in the Al and Si channels >50 are quite common for most coal phases.
Although the QEMSCAN® operates in the same manner regardless of the phases or material identified, the inherent variability of coal adds to the complexity of the SIP file that has to be developed. Although pure mineral and maceral phases are present in coal, the overwhelming majority of the material is characterized by intergrowths. These intergrowths can be between inorganic mineral phases themselves, for example quartz and kaolinite, and also between inorganic mineral phases and the organic coal macerals. This continuum of association between mineral and coal maceral, with the pure end-members on the side, as well as a continuum of association between certain mineral phases, for example quartz-kaolinite-mica, with pure end-members in a ternary domain, results in a multi-dimensional domain of BSE signals and EDS chemical signals that require identification and characterization (density and chemical composition).
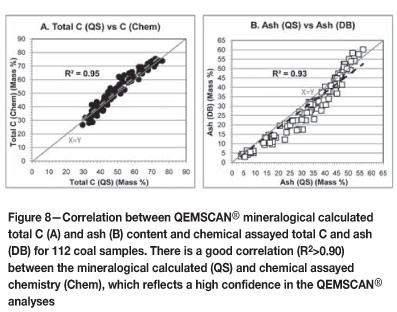
The solution is extensive use of the SEM-BSE signal as well as EDS element ratios to resolve the intergrowth of coal macerals with the various inorganic mineral components. Due to these intimate intergrowths and associations between organic and inorganic phases, it is not possible to compare QEMSCAN®-determined mineral phases with those calculated from ash content and ash chemistry. In common with other commodities, quality control on the QEMSCAN® data is therefore achieved by comparison of the mineralogical calculated chemistry, including ash content, with the assayed chemistry and ash content (Figure 8).
QEMSCAN® analysis of coal
Currently, the QEMSCAN® can distinguish between the different inorganic mineral phases as well as the organic coal maceral phases, thereby enabling quantification of these phases and the related chemical composition of the coal. The QEMSCAN® can only partially distinguish between the different organic coal maceral phases, because of the inherent variability of coal and the inherent limitations of the SEMEDS technology. These have been briefly explained in the previous section.
Theoretically the QEMSCAN® technology has the potential to be 'one complete' coal analysis, which is fast and therefore results in a high sample throughput and a rapid flow of basic- chemical and mineralogical information. However, currently these techniques are not adequate to replace the 'standard' petrographic and chemical evaluations, but rather complement these techniques.
The QEMSCAN® can routinely provide the following data on coal samples:
- Total C (mass %)
- Fixed C (calculated) (mass %)
- Volatiles (calculated) (mass %)
- Total ash (mass %)
- Ash chemistry (mass %)
- Total S (mass %)
- Sulphur species/forms of sulphur (mass %)
- Mineralogy
- Inorganics - 'quantitative'
- Organics (macerals) - indicative only.
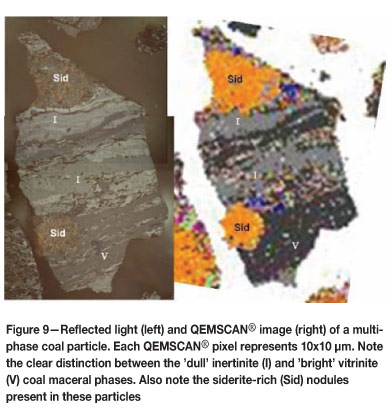
The QEMSCAN® can easily distinguish between pure vitrinite ('bright' coal) and inertinite ± liptinite ('dull coal) macerals based on their EDS chemical signal ratios (Figure 9). However, when these coal macerals are intimately associated with inorganic mineral phases, which is often the case, the heavier elements of the inorganics flood the EDS spectra, making it very difficult to distinguish between the associated coal macerals. Inertinite is commonly more closely associated with inorganic minerals, due to its origin, and therefore there is often virtually no correlation between the 'dull' coal content determined by QEMSCAN® and the 'dull' coal content determined by optical petrography. However, due to the frequent relatively pure nature of vitrinite, there is some correlation between the 'bright' coal content determined by QEMSCAN® and the 'bright' coal content determined by optical petrography.
There is, however, often a very good correlation between the 'bright' coal:'dull' coal ratio from the QEMSCAN® and by optical petrography. This indicates that the QEMSCAN® technology can be used to map and rank coal deposits into different 'lithozones' based on the ratio of 'bright' to 'dull' coal.
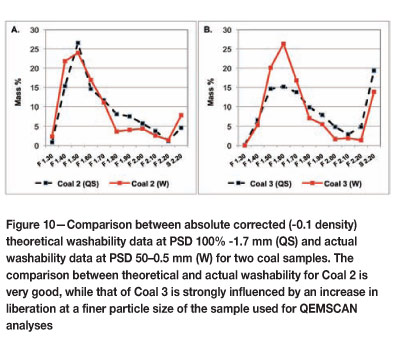
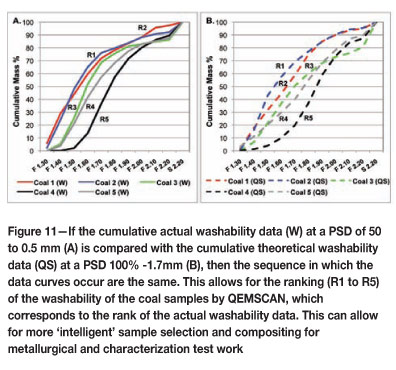
The ability of the QEMSCAN® to accurately map individual particles and assign relatively accurate calculated densities to each of these particles allows for the creation of theoretical washability curves. Often there is a relatively good correlation between QEMSCAN® theoretical and actual washability curves, and this can be improved by correcting the theoretical washability data for the misplacement of near-density particles that occurs during the actual washability tests (Figure 10). The cumulative theoretical washability curves can also be used to rank the washability potential of the coal samples (Figure 11). This has a direct applicability in the geometallurgical modelling of coal deposits as it can allow for more intelligent sample selection and compositing of samples for metallurgical and characterization test work.
X-ray diffraction (XRD) analysis of coal
X-ray diffraction (XRD) analysis of coals plays an integral part in the quality control of the QEMSCAN® identification and quantification of inorganic mineral phases. This is very similar to any other commodity.
However, XRD can effectively identify and 'quantify' only the crystalline inorganic mineral phases in the coal. XRD cannot identify the amorphous organic coal or amorphous inorganic phases, and usually underestimates the poorly crystalline inorganic mineral phases.
The greatest limitation of quantitative XRD analysis on coal or coal products (density/washed fractions) is the proportion of minerals present in the material analysed. For example, in the F1.35 RD fraction, the mineral component often makes up <5.5 mass %. This increases to approximately 22 to 28 mass % ash in the F1.50 RD fractions. The amorphous organic coal component thus acts as a diluent, which affects the accuracy of the quantitative XRD data as the 'counting statistics' for the crystalline inorganic mineral phases are significantly reduced.
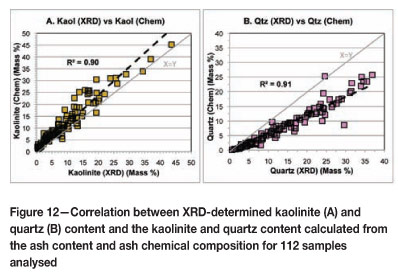
However, very good correlations of >80% (R2>0.80) between the XRD-determined mineral phase content and the mineral phase content calculated from ash content and ash chemical composition are achievable (Figure 12). Although there is a very good correlation between the XRD-determined quartz and the quartz calculated from ash content and ash chemistry, XRD consistently overestimates the quartz content, probably because of the highly crystalline nature of quartz compared to the other constituents in the coal.
Conclusions
Coal petrographic analysis is one of the most useful tools in the coking industry for the characterization of coals, since most of the important properties of a coal can be directly correlated with the petrographic constituents. One of the major successes of applied coal petrography is its ability to predict coke strength from single coals and coal blends. Mines that have been in operation for a large number of years therefore rely on databases, which often include petrographic data, to monitor production of coking coals for the market. One aspect of the marketability of a specific coal is its coking strength, which can be tested for or predicted using calculations derived from maceral analysis and reflectance determinations. It is therefore important that any coal laboratory should be able to guarantee that the quality of data conforms to international standards. This can be achieved by implementing a quality control programme based on routine repetition of analyses as well as the preparation and analysis of additional sample blocks, and repeat analyses performed by an external accredited and competent consultant or laboratory. It is also advisable that at least the supervisor of a laboratory has received international accreditation to perform petrographic analyses and rank determinations from the ICCP. In this way it should be possible to minimize changes in the database that can be ascribed to subjectivity, poor training or training deficiencies, and improvements in microscope technologies.
In the event of significant changes occurring within a database, particularly if it has been in operation for a great many years, it may be possible to overcome discrepancies by statistical analysis. Historic and newer data should be analysed statistically with a view to building a regression model from which a correction factor can be derived. Exxaro has proved this to be possible for most macerals and mineral matter in one particular case, but for other macerals it has proved problematic, these difficulties being based on the presence of large, non-uniform discrepancies between old and new datasets.
It is important to emphasize that coal petrography analyses, the data of which are often an integral part of large databases, need to be governed by strict quality control and assurance protocols according to international standards. This will ensure consistent high-quality data, and thus a high level of confidence in the database.
In addition to classical coal petrography and diagnostic chemical analyses, including both proximate and ultimate analyses, QEMSCAN® and XRD analyses can contribute significantly to the characterization of run-of-mine (ROM) coal and coal products. These techniques are not intended to replace the 'standard' petrographic and chemical evaluations, but rather to complement these techniques where and when required. The great advantage of both XRD and QEMSCAN® analyses is that these can be very rapid, thus large sample throughputs can be processed on a routine basis. This makes these techniques ideal for applications where large numbers of samples need to be analysed rapidly. The way in which the available technology mix is applied may, however, vary from case to case.
These new technologies allow for the more intelligent selection and compositing of samples for metallurgical and characterization test work, which should reduce the technical and therefore the financial risks associated with a particular coal project or deposit considerably. This can lead to the more speedy evaluation of coal deposits by reducing the number of samples on which detailed metallurgical and characterization- test work is required, without an increase in the overall statistical error of the resource model.
Acronyms
ASTM American Society for Testing and Materials
BSE Backscattered electron
CBI Composition balance index
CF Correction factor
EDS Energy dispersive spectroscopy
ICCP International Committee for Coal and Organic Petrology
ISO International Standards Organisation
MLA® Mineral Liberation Analyser
M10 Micum 10 index
M40 Micum 40 index
QEMSCAN® Quanititative Evaluation of Minerals/Materials by Scanning Electron Microscopy
Rr Random reflectance
RI Rank index
ROM Run of mine
RoR Optimum ratio of reactives
RSF Reactive semi-fusinite
SEM Scanning electron microscope
SIP file Species identification protocol file
XRD X-ray diffraction
References
Clendenin, J.D. 1969. Coal and coke. Blast Furnace: Theory and Practice. Strassburger, J.H., Brown, D.C., and Stephenson R.L., (eds.). Gordon and Breach Science Publishers, USA., vol. 1. pp. 325-436. [ Links ]
Coetzee, L.L., Theron, S.J., Martin, G.J., Van der Merwe, J., and Stanek, T. 2011, Modern gold deportments and its application to industry. Minerals Engineering, vol. 24, no. 6. pp. 565-575. [ Links ]
Crelling, J.C. 2008. Applied Coal Petrology: The Role of Petrology in Coal Utilization. Suárez-Ruiz, I. and Crelling, J.C. (eds.). Academic Press, USA. pp. 173-192. [ Links ]
Falcon, R.M.S. and Snyman, C.P. 1986. An Introduction to Coal Petrography: Atlas of Petrographic Constituents in the Bituminous Coals of Southern Africa. Geological Society of South Africa, Johannesburg. [ Links ]
International Committee for Coal and Organic Petrology (ICCP). 2001. The new vitrinite classification (ICCP Systems 1994). Fuel, vol. 80, pp. 459-471. [ Links ]
International Organization for Standardization (ISO). 1994. ISO 7404-1: Methods for the petrographic analysis of bituminous coal and anthracite. Part 1: vocabulary. Geneva, 3 pp. [ Links ]
International Organization for Standardization (ISO). 1994. ISO 7404-2: Methods for the petrographic analysis of bituminous coal and anthracite. Part 2: Method of preparing coal samples. Geneva, 8 pp. [ Links ]
International Organization for Standardization (ISO). 1994. ISO 7404-3: Methods for the petrographic analysis of bituminous coal and anthracite. Part 3: Method of determining maceral group composition. Geneva. 4 pp. [ Links ]
International Organization for Standardization (ISO). 1994. ISO 7404-5: Methods for the petrographic analysis of bituminous coal and anthracite. Part 5: Method of determining microscopically the reflectance of vitrinite. Geneva, 4 pp. [ Links ]
Jordan, P. 2006. Characterising coals for coke production and assessing coke -predicting coke quality based on coal petrography, rheology and coke petrography. MSc thesis, University of the Witwatersrand, Johannesburg. 111 pp. [ Links ]
Matjie, R. M,, French, D., Ward, C.R., Pretorius, P.C., and Li. Z. 2011. Behaviour of coal mineral matter in sintering and slagging of ash during the gasification process. Fuel Processing Technology, vol. 20, no. 8, pp. 1426-1433. [ Links ]
Pirrie, D., Butcher, A.R., Power, M.R. Gottlieb, P., and Miller, G.L. 2004. Rapid quantitative mineral and phase analysis using automated scanning electron microscopy (QemSCAN; potential applications in forensic geoscience. Special Publication 232. Geological Society, London. pp. 123-136. [ Links ]
Schapiro, N. and Gray, R.J. 1964. The use of coal petrography in coke making.
Journal of the Institute of Fuel, vol. 37. pp. 234-242.
Snyman, C.P. 1989. The role of coal petrography in understanding the properties of South African coal. International Journal of Coal Geology, vol. 14. pp. 83-101. [ Links ]
Stach, E., Mackowsky, M.T., Teichmuller, M., Taylor, G.H., Chandra, D. and Teichmuller, R. 1982. Stach's Textbook of Coal Petrology. Gebruder Borntraeger, Berlin. 535 pp. [ Links ]
Steyn, J.G.D. and Smith, W.H. 1977. Coal petrography in the evaluation of South African coals. Coal, Gold and Base Minerals, vol. 25, no. 9. pp. 107-117. [ Links ]
Suárez-Ruiz, I. 2012. Petrology - New perspectives and applications. Al-Juboury. A. (ed.). http//www.intechopen.com/books/petrology-new-perspectives-and-applications/organic-petrology-an-overview [Accessed 24 May 2013]. [ Links ]
Van Alphen, C. 2007. Automated mineralogical analysis of coal and ash products - challenges and requirements. Minerals Engineering, vol. 20. pp. 496-505. [ Links ]
Ward, C.R., and Suárez-Ruiz, I. 2008. Introduction to Applied Coal Petrology. Ápplied Coal Petrology: the Role of petrology in Coal Utilization. Suárez-Ruiz, I. and Crelling, J.C. (eds.). Academic Press, USA. pp.1-18. [ Links ] ♦
Paper received Sep. 2013
Revised paper received Oct. 2013.
© The Southern African Institute of Mining and Metallurgy, 2013. ISSN 2225-6253.
1 Same petrographer, same block, same apparatus, and same number of points
2 Different petrographer, different block, different apparatus, but same number of points
3 Quantitive evaluation of minerals/materials by scanning electron microscopy

