


Services on Demand
Article
 English (pdf)
 Article in xml format
 Article references
Indicators

Related links
-
 Cited by Google
 -
 Similars in Google
Share

 Permalink
Journal of the Southern African Institute of Mining and Metallurgy
On-line version ISSN 2411-9717
Print version ISSN 2225-6253
J. S. Afr. Inst. Min. Metall. vol.113 n.11 Johannesburg Nov. 2013
Probability of failure of South African coal pillars
J.N. van der MerweI; M. MalheyII
IUniversity of the Witwatersrand
IIUniversity of the Witwatersrand and RWTH Aachen University
ABSTRACT
Following the Coalbrook disaster in 1960, research into coal pillar strength resulted in the adoption of the concept of a safety factor in the design of stable pillars in South African coal mining. The safety factor on its own can be regarded as only a relative measure of stability. It stands to reason that a pillar with a higher safety factor will be 'more stable' than a pillar with lower safety factor, but how much more stable cannot be quantified.
Links between the safety factor and the probability of failure (PoF) were established for two new coal pillar strength formulae. The method behind the determination of the probability of failure was a comparison of the observed number of failures to a predicted number of stable cases for each safety factor in the entire population of pillars in South Africa. The prediction of the latter was made by fitting characteristic distribution curves (lognormal, Weibull, and gamma density distributions) to the samples of stable cases in the database and extrapolating the responding frequency distributions by a constant factor.
The resulting PoF per safety factor is significantly less than previously assumed. A more accurate approach to the solution for the link between safety factor and the probability of failure would be to determine regional or seam-specific probabilities of failure. However, this would require more statistical evidence for the separate regions or seams to improve the meaningfulness and reliability of the predictions. The amount of data available at present is not considered sufficient for this purpose.
It is shown that the pillar strength formula derived by means of the maximum likelihood function results in larger pillars than with the formula derived by means of the overlap reduction technique for the same safety factor, but that the PoF of the larger pillars is less than that for the smaller pillars obtained with the alternative formula. Compared on the basis of the same pillar sizes, the PoF derived for the two different formulae are in close agreement. This conclusion confirms that basing design on PoF as opposed to a safety factor is much more satisfactory, and it also removes the ambiguity arising out of using different strength formulae.
It is concluded that a PoF of 1% for general bord and pillar workings could be obtained with a safety factor of 1.3 by using the maximum likelihood formula, and 1.4 by using the minimum overlap formula.
Significant benefits in extraction can be expected from the use of either of the new formulae, basing the design on a PoF of 1% for general underground workings..
Keywords: coal pillar failure, probability of failure of coal pillars, probability of failure.
Introduction
Following the Coalbrook disaster in 1960, research into coal pillar strength resulted in the adoption of the concept of a safety factor in the design of stable pillars in South African coal mining.
The safety factor on its own can be regarded as only a relative measure of stability. It stands to reason that a pillar with higher safety factor will be 'more stable' than a pillar with lower safety factor, but how much more stable cannot be quantified.
The concept of probability of failure (PoF) is much more meaningful. Although Salamon and Munro (1967) included a 'probability of having a stable layout' in their work, this is not the same as the PoF. In reality, being based on the distribution of failed pillar cases only, without considering the database of stable cases, it is no more than a description of the characteristics of the database of failed pillars. This has been widely misinterpreted over the years to be the same as the PoF.
Another complexity in empirical studies of this nature has to be borne in mind. The only data that is available refers to the as-mined dimensions of the pillars. Over time, it is known that pillars scale and thus decease in size. In the vast majority of cases, pillar failure occurrs only after the passage of several years, sometimes decades, meaning that the pillar size at the time of failure was in most cases less than the dimensions at the time of mining.
Two statistical techniques were applied to derive an optimized pillar strength equation, namely the maximum likelihood method as used by Salamon and Munro (1967) and the overlap reduction technique as introduced by Van der Merwe in 2003(a). The two techniques, described in Van der Merwe and Mathey (2013a), resulted in different strength formulae.
Links between the safety factor and the PoF were established for both new strength formulae. The method behind the determination of the PoF was a comparison of the observed number of failures to a predicted number of stable cases for each safety factor in the entire population of pillars in South Africa. The prediction of the latter was made by fitting characteristic distribution curves (lognormal, Weibull, and gamma density distributions) to the samples of stable cases in the database and extrapolating the responding frequency distributions by a constant factor.
The resulting PoF per safety factor is significantly less than previously assumed. It should be noted that some simplifying assumptions had to be made throughout the calculations, and therefore the results presented within this report should be refined when more detailed information is available. A more accurate approach to the solution for the link between safety factor and the PoF would be to determine regional or seam-specific probabilities of failure. However, this would require more statistical evidence for the separate regions or seams to improve the meaningfulness and reliability of the predictions. The amount of data available at present is not considered sufficient for this purpose.
It is shown that the pillar strength formula derived by means of the maximum likelihood function resulted in larger pillars than with the formula derived by means of the overlap reduction technique for the same safety factor, but that the PoF of the larger pillars is less than that for the smaller pillars obtained with the alternative formula. Compared on the basis of the same pillar sizes, the PoFs derived for the two different formulae are in close agreement. This conclusion confirms that basing design on a PoF as opposed to a safety factor is much more satisfactory, and it also removes the ambiguity arising out of using different strength formulae.
It is concluded that the acceptable PoF of 1% for general bord and pillar workings could be obtained with a safety factor of 1.3 by using the maximum likelihood formula, and 1.4 by using the minimum overlap formula.
Significant benefits in extraction can be expected from the use of either of the new formulae, basing the design on a PoF of 1% for general underground workings.
Methodology
Currently, pillar design is based on the safety factor concept. As a guideline for both safe and economic mining, Salamon (1967) suggested a design safety factor of SF = 1.6, which was the mean value of a safety factor range (1.3-1.9) where 50% of stable cases in the original database were observed to be most densely concentrated. It was shown earlier that this design approach cannot guarantee the stability of the underground workings, since failure of pillars with safety factors around SF = 1.6 could be observed even in the so-called 'normal coal' areas. Furthermore, the safety factor concept is not capable of quantifying the risk that is involved with leaving large mined-out areas standing on coal pillars. This knowledge, however, would be useful for both active mining operations and management of abandoned mine sites.
It was therefore suggested by Salamon et al. (2005) that a risk-based design approach would be more practical and- agree better with recent trends in the industry. The authors established a statistical link between the safety factor and the PoF of coal pillars by utilizing the updated cumulative frequency distribution of failed safety factors only.
The shortcoming of this approach lies in the fact that it considers only the frequency distribution of safety factors of failed pillars, but ignores the experiences with safety factors of intact pillars.
In fact, it can be observed that for safety factors with a high failure frequency a certain number of stable cases exist as well. It is therefore argued that a more obvious link between the safety factor and the PoF of coal pillars can be established: namely the ratio of failed cases to stable cases with the same safety factor. This empirical solution has more practical relevance, as it will be based on real observations.
The difficulty involved with this method is that it requires a detailed knowledge of the safety factor frequency distribution of all collapsed and intact cases. While it can be reasonably assumed that nearly all cases of pillar collapse in South Africa are known (except perhaps a few cases from the early decades of coal mining), only limited information on the characteristics of stable cases is available from sample observations. Since an investigation into the safety factors of all pillars ever mined in South Africa is beyond the scope of the present investigation, the following sections will have to deal with an acceptable approximation of the same. The following approach was adopted.
It is assumed that the frequency distribution of safety factors of the intact pillar samples expresses the same behaviour (mean, standard deviation, type of statistical distribution) as the frequency distribution of safety factors of all intact pillars that were ever mined in South Africa. The latter distribution can then be determined by extrapolating the sampled database with a constant factor j.
The extrapolation factor j, in turn, can be derived from the ratio of the number of all panels ever mined in South Africa to the number of cases in the intact database.
The number of panels ever mined can be estimated from a combination of different statistical evidence. First of all, the total amount of coal mined in South Africa has to be determined. The average panel extraction ratio and pillar dimension, as found in the database of stable pillars, will then indicate the total amount of pillars that were left behind in the underground workings. Finally, the number of panels will be estimated from observations on the average number of pillars per panel in South Africa.
Estimation of number of pillars and panels mined in South Africa
It would be close to impossible to locate all the mine plans of every coal mine that ever existed in South Africa and perform a physical count. Instead, an estimate was developed based on the total amount of coal mined and the characteristic sizes of pillars and dimensions of panels.
Estimate of total coal mined
A database comprising the entire historical coal production characteristics in South Africa was compiled from three different sources. The first 90 years of coal mining (1880-1970) were covered by a statistical book that presents tables of the total annual coal production in metric tons (Mitchell, 2003). These decades were exclusively dominated by bord and pillar mining and it was therefore assumed that this technique accounted for 100% of the total registered coal output. For the time between 1970 and 1994, when other mining methods such as opencast mining, longwall mining, and total pillar extraction increased their influence, no accurate production data could be found. However, characteristic values for the different mining methods could be derived from a diagram published by Hardman (1990). Gaps were filled by linear interpolation. It should be noted that Hardman used sales tons in his diagram, which are believed to be less than the actual metric tonnage of coal mined underground. However, as no other source is available for the given time period, it was decided to use these numbers as a good approximation. For the time between 1994 and 2010, again detailed production characteristics for the different coal mining methods could be sourced from the DMR (Kohler, 2011).
Figure 1 shows the trend of the entire South African coal production for the time period between 1925 and 2010.
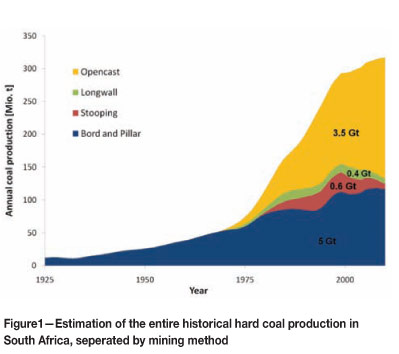
The investigation concluded that an approximate amount of 9.55 Gt of coal has been extracted from South African coal deposits so far. Regarding the different coal mining methods applied in this country it was found that the major contribution of 53% to the entire historical production comes from the widely applied bord and pillar mining technique, followed by opencast mining with 37%. Compared to these numbers, the other underground mining methods, i.e. total pillar extraction (stooping) and longwall mining, play a minor role with a share of 6% and 4% respectively.
Estimate of pillar and panel sizes
The total production from bord and pillar mining operations amounts to approximately textr = 5 Gt. The average percentage in panel extraction derived from both pillar and bord dimensions stored in the database of intact pillars is e = 60%. The tonnage of coal that was left behind in form of pillars (tΣpillars) can then be calculated from Equation [1]:
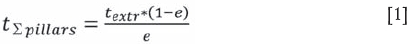
Consequently, an approximate amount of 3.333 Gt of coal was left in the form of pillars in the underground workings. The database of failed pillars was excluded from this analysis, as it is believed that the pillar dimensions herein cannot be considered as representative of the vast majority of pillars left in South Africa.
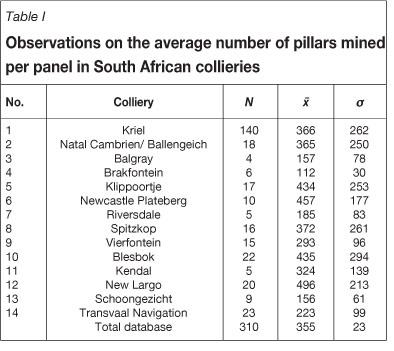
The average dimension of coal pillars in the intact database is about 10.5 m in square width and 3 m in height, which equals a volume of Vpillar = 330.75 m3 per pillar. Following the further assumption that the average unit weight of coal is ρ = 1.5 t/m3, the investigation comes to the conclusion that approximately 6.72 million pillars have been left in the life of South African coal mining (compare with Equation [2]).
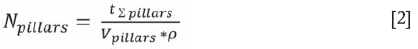
To finalize the investigation, it was then required to estimate an average number of pillars that were mined per panel, in order to estimate the total amount of panels ever mined in South Africa. For this purpose, 310 samples were taken from 14 different mine sites. The greatest share of data comes from Kriel colliery, where digital mine maps were available and the number of pillars per panel could be queried from the geographic information system. In all cases from other collieries, samples were taken by measuring the length and width of the relevant panels and the average pillar centre distance: the estimated number of pillars per panel could then be calculated from the ratio of the panel area to the square of the average pillar centre distance.
The results are summarized in Table I. A mean value x of pillars per panel was derived from the number of observations N for each colliery. The scatter of the observed number of pillars per panel around the arithmetic mean value is expressed as the standard deviation a of the observations. For the latter, relatively large values had to be expected, since the size of panels depends on a variety of unpredictable geological conditions (e.g. quality of coal, faults, dykes) and the designed span between safety pillars.
Furthermore, it could be observed that panels which were only mined for coal production were significantly smaller than those panels which also function as main developments, i.e. as links between different production zones and the shaft of a colliery. The average number of pillars per panel as derived from 310 observations from 14 collieries is ẍtotal = 355. The related standard deviation σtotal = 231 was derived by means of error propagation from the standard deviations of the samples from the different collieries. Based on this information, the number of panels ever mined in South Africa can be established and the PoF could be calculated in accordance with the methodology outlined in the introductory description to this section. It should be noted, however, that the standard deviation is very large compared to the mean of the samples and that the statistic is therefore strictly speaking not convincing.
Strictly speaking, the database of failed cases does not store failed panels, but a number of more or less large groups of failed pillars. Comparing the number of these failed pillar groups to the number of stable panels ever mined might be inadequate, since one can imagine that a single sufficiently large panel could possibly experience two separate failures.
In order to account for this problem it was thus decided to treat every large panel (i.e. the number of pillars in the relevant panel is significantly higher than average) in the sampled database as if it were two separate small panels. The cut-off criterion was chosen to be 600 pillars per panel.
The result of this measure is that the statistics in Table I change with the following trends. The number of observations increases slightly while the mean value for the total database decreases. The most significant and desirable impact can be observed for the standard deviation of the total data, which nearly halves its original value. A summary of the adjusted database is given in Table II.
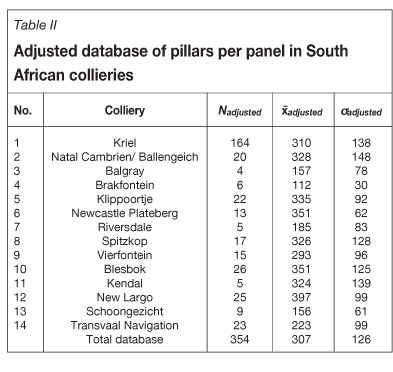
The adjusted mean value of pillars per panel is around ẍadjusted≈300 (see Table II). Bearing in mind that the estimated number of pillars left in South Africa is about 6.72 million, the investigation may conclude that the PoF should be determined based on the assumption that 22 400 stable cases exist in South Africa. Note that this includes a very small number of failed pillar cases, but the number is adjusted later to discount the failed cases in the database of stable pillars.
Pseudo probability of failure based on failed cases
The most illuminating way of demonstrating the difference between the PoF concept proposed by Salamon and Munro (1967) and the approach used in the present study is to compare the results for both methods. The following section therefore discusses the pseudo PoF based on the observations on failed cases only.
Fundamental for the Salamon and Munro (1967) approach is the fact that the frequency of occurrence of pillar failure related to a designed safety factor follows a lognormal distribution
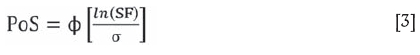
where ϕ is the cumulative normal distribution function. Furthermore the PoF is related to the probability of stability by the simple equation

Since the predicted PoF will be related to the designed safety factor of a pillar, it is obvious that the results will differ due to the choice of the pillar strength formula on which the calculations is based. Nevertheless, at least two similarities have to be expected. The first one is that a safety factor of zero will have a related PoF of 1 (100%). This is, of course, a purely theoretical consideration. The second similarity will be that a safety factor of unity has a related PoF of 0.5 (50%). This is due to the fact that the maximum likelihood technique assumed a lognormal frequency distribution of failures with zero mean, meaning that one half of the failed cases have safety factors smaller than unity and the other half greater than unity. For the overlap reduction technique this expectation will also be fulfilled, since the k-constant of the strength formula was explicitly adjusted such that 50% of the failures occurred at a safety factor of 1.0.
The PoF of safety factors according to both formulae is plotted in Figure 2. For the purpose of comparison the original Salamon and Munro (1967) curve was added. It can be seen that a slightly lower PoF is predicted for safety factors calculated with the minimum overlap strength formula in the interval of 0 < SF < 1. In the interval between 1 < SF < 2.5 this relationship is reversed and the PoF calculated by means of the maximum likelihood formula becomes smaller. For the latter, no significant difference from the original Salamon and Munro curve could be observed.
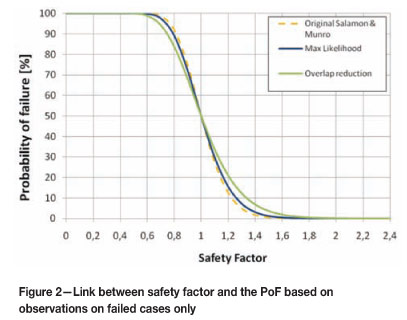
The issue of an acceptable PoF requires careful consideration over a broad spectrum of stakeholders. For the moment, the authors decided to rely on a remark by Salamon et al. (2005) that a PoF of 1% could be considered sufficient.
This will be achieved by the maximum likelihood formula with a safety factor of SF = 1.6 and by the minimum overlap formula with a safety factor of SF = 1.7, based on a consideration of the failed pillar database only.
However, this historical approach is fundametally flawed as it relies purely on the distribution of failed pillar cases without any reference to the population of stable cases. It is thus not a measure of the PoF, it is merely a description of the distribution of failed cases. The reality is that half of the failed cases had safety factors less than 1.0 and half greater than 1.0. Therefore, it may be said that the probability of finding cases with safety factors less than 1.0 in the population of failed cases is 50%, but this does not imply that the PoF of pillars with a safety factor of 1.0 is 50%.
A PoF can be determined only by comparing the number of failed cases to stable ones at the same safety factor.
Probability of failure based on a comparison of failed and stable cases
For a PoF that is based on real observations, the number of recorded collapsed cases needs to be compared to the entire number of intact cases with the same safety factor. Of course, the safety factor distribution of the entire population of intact pillars cannot be known in detail. However, it can be assumed that the frequency distribution of safety factors of the intact samples reflects the characteristic distribution of the population reasonably well. Therefore by applying an extrapolation factor to the observed frequencies of the samples, an estimation can be made of the frequency distribution of safety factors of the entire population of intact pillars.
It is further helpful to assume that the frequency distribution of safety factors of the population of stable pillars, as for the failed pillar cases, follows mathematical expectations. It cannot be expected that the limited number of intact samples resembles this mathematical distribution of the population to perfection, but that indications of the same can be found.
The following standard distributions were checked.
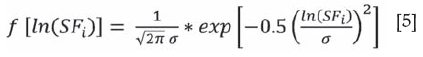
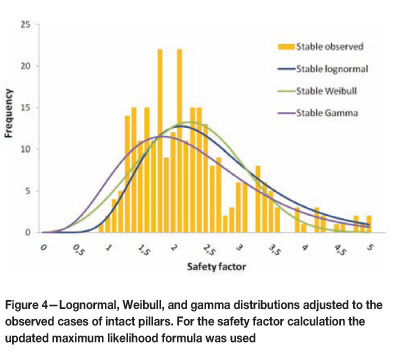
A lognormal distribution, as given in Equation [5]. The required mean value and standard deviation for the projection were derived from the samples of intact cases.
The second distribution is the Weibull distribution:
And finally the gamma distribution was checked for applicability:
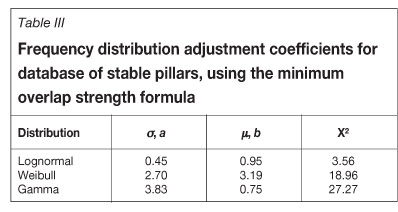
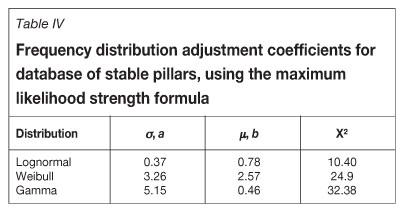
In both distributions a and b are adjustment coefficients that have to be optimized for a best-fitting curve. The adjustment of these standard functions on the observed safety factors in the database of stable pillars was conducted with the statistical software EasyFit5.5 Professional. The goodness of fit was checked with the chi-square test using the same software. The equation for the chi-square test is
where the parameters ti and τ are the observed and predicted number of stable cases in a set of n segments of the cumulative distribution curve. The smaller the result of the chi-square test is, the better the curve fits to the observed data.
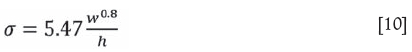
Van der Merwe and Mathey (2013b) derived two equations for coal pillar strength, respectively called the maximum likelihood and overlap reduction (or minimum overlap) formulae for the 'normal coal' areas in South Africa:
Maximum likelihood:
Overlap reduction:
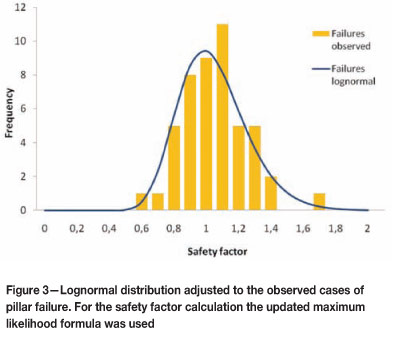
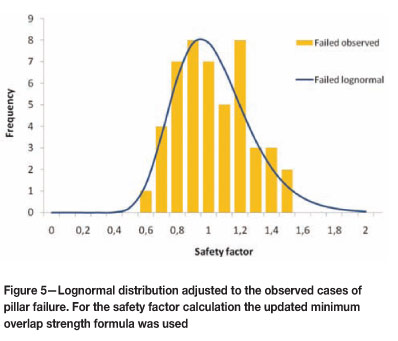
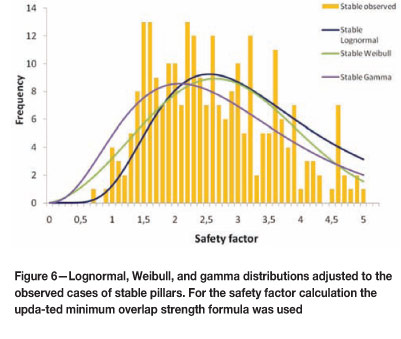
The curve fitting was conducted for the stable database by calculating the observed safety factors with both updated pillar strength formulae. The results of the curve fitting can be seen in Tables III and IV. The lognormal distribution achieves the best (even though not optimal) adjustment to the cases stored in the stable database. Figures 3-6 plot the best-fit distributions for the failed and intact cases from the databases. Note that only the lognormal distribution fits the failed and stable pillar cases reasonably well.
The PoF can now be calculated by comparing the ordinate values of the adjusted lognormal frequency curves for failed and stable cases for each safety factor interval. The corresponding equation is
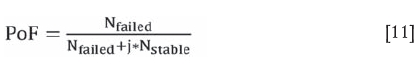
where Nfailed and Nstable are respectively the numbers of the actual failed and predicted stable cases per safety factor. The parameter j is the extrapolation factor for the database of stable cases, as mentioned earlier, and can be derived from the following consideration.
The estimation of the total number of stable pillar cases in South Africa resulted in a number of about 22 400 panels. The database of stable cases stores a total of 334 cases from all South African coalfields. Consequently, the extrapolation factor for the entire database would be about 67. However, since the considerations on the PoF can be made only for panels in the 'normal coal' areas, an estimation has to be made of how many panels were ever mined in the corresponding coalfields. As an indication, it was found that about 80% of panels in the stable database come from 'normal coal' areas. Therefore it may be approximated -without any further justification - that also about 80% of all panels ever mined in South Africa were mined in the 'normal coal' areas, i.e. 17 920 cases. The number of cases in the database of stable cases from normal coal areas is 276. The extrapolation factor therefore is about j = 65 (the ratio of 17 920 expected cases to 276 recorded cases).
Results for the link between the safety factor and the PoF are presented in Tables V and VI. It is noticeable that the highest PoF value corresponds to a safety factor of SF = 0.7. For higher safety factors the PoF trends towards zero, as expected. However, the calculated PoF for safety factors smaller than SF = 0.7 also trends towards zero. This observation contradicts expectations, since one can easily imagine that the lower the safety factor, the higher the PoF should be.
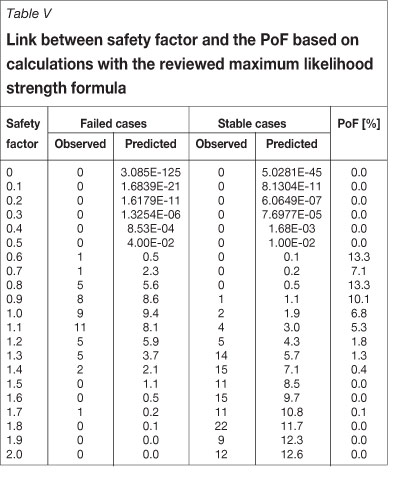
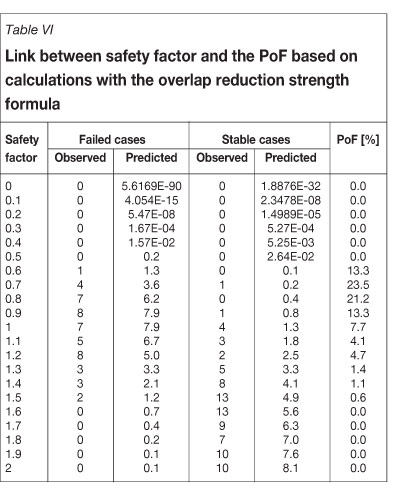
The reason for this might be found in the fact that for low safety factors, no observations exist on either failed or stable pillars. Here the lognormal distributions, which were fitted to both databases, make extrapolations that may not be reliable. A close comparison of the projected numbers of failed and intact cases supports this assumption: For safety factors less than SF = 0.6 the predicted numbers of failed and stable cases become practically zero. However, due to the higher standard deviation of the distribution of stable cases, the predicted values are insignificantly, but still higher than the ones predicted for the failed cases. The application of Equation [9] then results in a PoF of practically zero.
Nevertheless it can be concluded that the obtained PoF is plausible for safety factors equal to and larger than SF = 0.7. The following comparison can be made with the PoF obtained from consideration of the failed cases only
While it was previously assumed that a safety factor of unity would have a PoF of 50%, the practical comparison between failed and stable cases suggests that the PoF is in fact significantly lower, i.e. less than 10%.
This raises an issue that requires discussion. Logically, one would expect that a safety factor of 1.0 would result in a failure probability of 50%. However, it is important to realise that the FoS as calculated is based on the 'as-mined' dimensions. It is known that pillars scale over time, and consequently that the safety also decreases over time. Only in the rarest of cases do pillars fail immediately, and consequently the real safety factor at the time of failure is less than that calculated from the 'as-mined' dimensions.
It is also apparent that the two approaches to derive the pillar strength formula result in different probabilities of failure for any given safety factor. Equations [12] and [13], derived from the data in Tables V and VI, illustrate the relationship between the safety factors (SF) and PoFs, for the maximum likelihood and overlap reduction methods respectively.
For the maximum likelihood strength formula:

For the overlap reduction formula:

Figure 7 illustrates the difference between the probabilities of failure obtained with the two approaches. While it can be seen that the two approaches are similar in nature, it is clear that for that the same safety factor, the maximum likelihood approach results in lower probabilities of failure, especially in the safety factor range of 0.5 to 1.5. At higher safety factors, both methods indicate very low probabilities of failure.
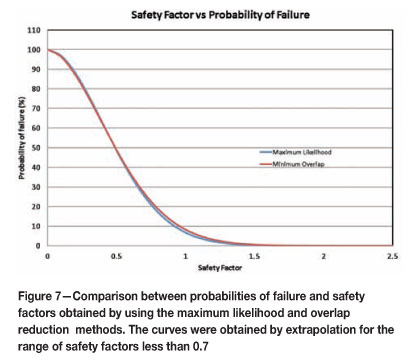
It is also intriguing to note that the safety factor coinciding with a PoF of 50% for both formulae is just less than 0.5. This is in line with the assumption made by Van der Merwe (2003b) that the actual safety factor at the time of failure is SF = 0.4.
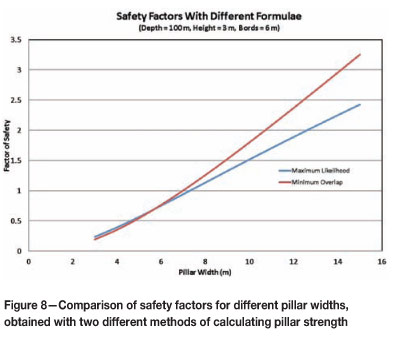
For pillar width-to-height ratios in excess of approximately 1.88, the overlap reduction strength formula results in higher safety factors for the same pillar sizes than the maximum likelihood method. There is thus a certain measure of compensation: for the same pillar size in a given situation-the minimum overlap formula results in a higher safety factor, but also a higher failure probability, than the maximum likelihood method.
The degree of compensation is best illustrated by a typical example.
Figure 8 compares the variation in safety factors for different pillar sizes for the situation where the mining depth is 100 m, mining height 3 m, and bord width 6 m. It is clear that the maximum likelihood method results in lower calculated safety factors for pillars wider than approximately 5.5 m.
However, when the failure probabilities for the different pillar sizes are compared (see Figure 9) the differences are too small to have any practical significance.
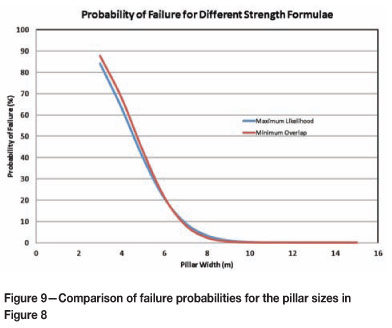
This example highlights a very important conclusion: while different safety factors are obtained by using the two methods of calculating pillar strength, the failure probabilities are virtually the same for the same pillar sizes. This emphasizes the importance of basing pillar design on PoF rather than safety factors. Which formula is used is not important: what is vital, is to base the design on a PoF.
Implications for the industry
A PoF equal to or less than 1% was achieved with the previous understanding of the link between safety factor and PoF with safety factors of SF = 1.6 (maximum likelihood formula) and SF = 1.7 (minimum overlap formula) respectively. The comparison of failed and stable cases, however, indicates that a PoF of 1% can already be achieved with smaller safety factors, namely SF = 1.3 and SF = 1.4 respectively. This conclusion may have great significance for economic pillar design.
Two new pillar strength formulae were previously suggested for application in areas of 'normal coal strength'. Both formulae were used to establish a link between the safety factor and the PoF of coal pillars. Unlike the former assumption that the PoF can be derived from failed cases exclusively, it is argued here that only a comparison of the observed number of failed pillars with the predicted number of stable cases for each safety factor can achieve a plausible result.
Finally, some thought should be given to the question what the possible implications of using the new strength formulae for the industry might be. Salamon et al. (2005) suggested that a more up-to-date pillar design criterion would be to design pillars for a PoF rather than for a certain safety factor. The authors of this report agree fully. The acceptable risk in pillar design was suggested as being PoF < 1% by Salamon et al. (2005). Note that this suggestion was based on opinion. This issue requires attention, but in the meanwhile the authors concur with the suggestion. In fact, the quantification of a tolerable PoF will be a management decision and possible impacts of a collapse on mining operations and surface structures will have to be considered.
Basing design on the PoF at least opens the door to design for different situations, such as the nature of use of the overlying surface, purpose of the excavation (i.e. main development, production panel, etc.) on an understandable, quantifiable parameter rather than a ratio between strength and load with unquantifiable stability consequence.
Equations [12] and [13] show that a PoF of 1% is achieved with a safety factor of SF = 1.3 by using the new maximum likelihood formula, or SF = 1.4 by using the new overlap reduction formula. The PoF hereby only quantifies the safety aspect in pillar design. The other relevant aspect is the economic efficiency.
How economic a pillar design will be can be expressed in terms of the underground extraction ratio, e, that can be achieved while assuring a defined degree of safety. The percentage of coal sterilized in the form of pillars relative to the coal available is obtained by
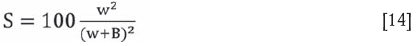
The bord width B can be taken as a fixed dimension in bord and pillar design. In the following estimation it is assumed to be B = 6 m. The mining height h is in most cases governed by the seam thickness and will be taken as h = 3 m. In order to achieve safety factors as given above the pillar width has to be adjusted according to the depth of mining. A solution can be found by solving the safety factor formula for w. The pillar width corresponding to safety factors of SF= 1.3 and SF = 1.4 respectively for mining depth ranges between 20 < H < 240 m are presented in Figure 10. For the purpose of comparison, results were also obtained for the original Salamon and Munro formula at a safety factor of 1.6.
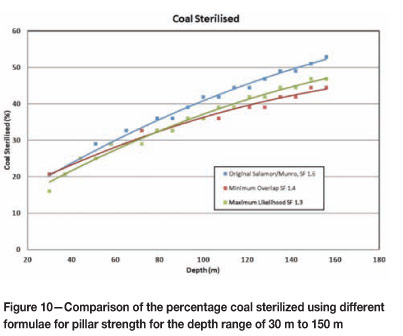
Figure 10 demonstrates that coal recovery can be significantly increased (i.e. less coal sterilized) by basing the design on a PoF of 1% by using either of the proposed new formulae for pillar strength.
Summary and conclusions
A link between the pillar safety factor and the probability of failure (PoF) was established for two new strength formulae. The method behind the determination of the PoF was a comparison of the observed number of failures to a predicted number of stable cases for each safety factor in the entire population of pillars in South Africa. The prediction of the latter was made by fitting characteristic distribution curves (lognormal, Weibull, and gamma density distributions) to the samples of stable cases in the database and extrapolating the corresponding frequency distributions by a constant factor.
The resulting PoF per safety factor is significantly less than previously assumed by other researchers. For instance, the former approach to derive the PoF based exclusively on the distribution of failed cases assumes a PoF of 50% for a safety factor of unity. Results from the present study, however, argue that the PoF for a safety factor of unity is in fact less than 10%. It should be noted that some simplistic assumptions had to be made throughout the calculations and therefore the results presented in this study should be refined when more detailed information is available. A more accurate approach to the solution for the link between safety factor and the PoF would also be to determine regional or seam-specific probabilities of failure. However, this would require more statistical evidence for the separate regions or seams to improve the meaningfulness and reliability of the predictions. The amount of data available at present is not considered sufficient for this purpose.
It has been shown that the pillar strength formula derived by means of the maximum likelihood function resulted in larger pillars than with the formula derived by means of the overlap reduction technique for the same safety factor, but that the PoF of the larger pillars is less than that for the smaller pillars obtained with the alternative formula.
Compared on the basis of the same pillar sizes, the probabilities of failure derived for the two different formulae are in close agreement.
It can be concluded that the acceptable PoF of 1% for general bord and pillar workings can be obtained with a safety factor of 1.3 by using the maximum likelihood formula, and 1.4 by using the overlap reduction formula.
Finally, the economic efficiency of the new pillar strength formulae was assessed, using a risk-based pillar design approach. For this purpose the pillar design criterion was chosen to be PoF = 1 %. The profitability of the strength formulae was quantified in terms of underground extraction that can be achieved in various mining depth horizons while assuring the defined degree of safety.
For comparative purposes, extraction ratios were also calculated for the original Salamon and Munro equation, which - despite the more recent refinements achieved by other authors - still appears to be the most widely applied pillar strength formula in South Africa.
It is concluded that significant changes in extraction can be expected from the use of either of the new formulae, basing the design on a PoF of 1% for general underground workings.
Acknowledgements
The Coaltech Research Association is gratefully acknowledged for partial financial support of the research described in the paper.
References
Hardman, D.R. 1990. The consequences from leaving vast mined-out areas standing on coal pillars. Journal of the South African Institute of Mining and Metallurgy, vol. 90, no. 12. pp. 333-338. [ Links ]
Harr, M. 1997. Reliability-based Design in Civil Engineering. Dover Publications, New York, February 1997. [ Links ]
Kohler, M. 2011. Deputy Director of Statistics, Department of Mineral Resources, Pretoria. Personal communication. [ Links ]
Mitchell, B.R. 2003. International Historical Statistics - Africa, Asia & Oceania, 1750-2000. 4th edn. Macmillan, New York. [ Links ]
Salamon, M.D.G. 1967. A method of designing bord and pillar workings. Journal of the South African Institute of Mining and Metallurgy, vol. 68, no. 2. pp. 68-78. [ Links ]
Salamon, M.D.G. and Munro, A.H. 1967. A study of the strength of coal pillars. Journal of the South African Institute of Mining and Metallurgy, September, 1967. pp. 56-67. [ Links ]
Salamon, M.D.G., Canbulat, I., and Ryder, J.A. 2005. Development of seam-specific strength formulae for South African collieries. Final report to Coaltech 2020. www.coaltech.co.za [ Links ]
Van der Merwe, J.N. 2003b. Predicting coal pillar life in South Africa. Journal of the South African Institute of Mining and Metallurgy, vol 103, no. 5. pp. 293-301. [ Links ]
Van der Merwe, J.N. 2003a. New pillar strength formula for South African coal. Journal of the South African Institute of Mining and Metallurgy, vol. 103, no. 5. pp. 281-292. [ Links ]
Van der Merwe, J.N. and Mathey, M. 2013b. Update of coal pillar strength formulae for South African coal using two methods of analysis. Journal of the Southern African Insti-tute of Mining and Metallurgy, vol. 113, no 11. pp. 841-848. [ Links ]
Van der Merwe, J.N. and Mathey, M. 2013a. Update of coal pillar database for South African coal mining. Journal of the Southern African Institute of Mining and Metallurgy, vol. 113, no. 11. pp. 825-840. [ Links ] ♦
Paper received May 2013
Revised paper received Sep. 2013
© The Southern African Institute of Mining and Metallurgy, 2013. ISSN 2225-6253.

