


Services on Demand
Article
 English (pdf)
 Article in xml format
 Article references
Indicators

Related links
-
 Cited by Google
 -
 Similars in Google
Share

 Permalink
Journal of the Southern African Institute of Mining and Metallurgy
On-line version ISSN 2411-9717
Print version ISSN 2225-6253
J. S. Afr. Inst. Min. Metall. vol.113 n.11 Johannesburg Nov. 2013
Update of coal pillar strength formulae for South African coal using two methods of analysis
J.N. van der MerweI; M. MatheyII
IUniversity of the Witwatersrand
IIUniversity of the Witwatersrand and RWTH Aachen University
ABSTRACT
The pioneers in the field of coal pillar strength in South Africa were M.D.G. Salamon and A.H. Munro, who preferred to use statistical back-analysis of failed and intact pillars to determine the pillar strength, and Z.T. Bieniawski, whose attempt was based on the direct strength determination of coal pillars using specimens of various sizes. At the time when the original statistical analysis was performed, 27 cases of failed pillar workings were considered suitable for inclusion in the database of failed pillars.
The databases of failed and stable pillar cases have recently been updated to include cases of pillar failure that occurred in the past few years (Van der Merwe and Mathey, 2013a). The work described in this paper relates to a review of pillar strength formulae using the latest available data and using two different approaches to the analysis.
A clear distinction was found between pillar failure in the so-called 'weak coal' areas, comprising the Klip River, Vaal Basin, and Free State coalfields, and the rest of the areas in South Africa. It was not possible to derive satisfactory strength formulae for the 'weak coal' areas using either the maximum likelihood or the overlap reduction technique of analysis. The pillars in these areas tended to fail at much higher safety factors, calculated by using the strength formulae developed for the 'normal coal' areas. It is postulated that the mode of failure may be different in these areas.
This distinction reinforces the notion that coals in different areas have different characteristics and that there is scope to develop site-specific strength formulae. However, the scarcity of data for the different areas prohibits the development of reliable formulae at this stage, and therefore the broad distinction of 'weak' and 'normal' coals has to suffice for the present.
The updated databases resulted in only slightly different strength formulae for the different approaches to the analysis than were obtained previously. Both the maximum likelihood and the overlap reduction technique resulted in usable formulae.
The maximum likelihood technique resulted in a closer grouping around the average safety factor of unity for the failed cases, while the overlap reduction technique resulted in better distinction between cases of failed and stable pillars.
For the same pillar geometries, the overlap reduction formula predicted lower strength than the maximum likelihood formula for pillars with width-to-height ratios less than 1.88, and higher strength for pillars with higher width-to-height ratios.
Further work is required to review the squat pillar formula in the light of these new formulae, as the transition between the formulae presented here and the squat pillar formula is no longer continuous.
In similar vein, the previous work to predict the stable life-span of coal pillars should also be reviewed using the latest available data.
Keywords: coal pillar strength, pillar collapse, safety factor.
Introduction
The pioneers in the field of coal pillar strength in South Africa were M.D.G. Salamon and A.H. Munro, who preferred to use statistical back-analysis of failed and intact pillars to determine the pillar strength, and Z.T. Bieniawski, whose attempt was based on the direct strength determination of coal pillars using specimens of various sizes. The work by Salamon and Munro (1967) gained wide acceptance in South Africa, while Bieniawski's work gained popularity in the USA following his move there.
At the time when the original statistical analysis was performed, 27 cases of failed pillar workings were considered suitable for inclusion in the database of failed pillars. The main criteria for inclusion were that there had to be reasonably certainty that the pillars themselves had failed (not the roof or the floor), that the panel width had to be at least equal to the depth of mining, and that the pillar layout had to be reasonably consistent.
The pillar load in the original work by Salamon and Munro (1967) was assumed to be the tributary area load, based on the concept that each individual pillar is responsible for bearing its full share of the overburden load. While this simplified approach ignores a number of factors that actually reduce the real load on pillars, such as the stiffness and bridging capability of the overburden and the existence of interpanel pillars, it remains a simple and acceptable method of calculating pillar load provided that the pillars have more or less the same size, are equally spaced, and that the panel is at least as wide as the depth of mining.
Pillar failure did not stop after the introduction of the safety factor formula by Salamon and Munro (1967). In the ensuing years, pillars that were created before the application of the formula deteriorated and later failed, as did ones that were created after the introduction of the formula. This means that over time, the database of failed pillar cases did not remain constant, but that it increased in size, allowing ever more reliable analyses to be performed.
Researchers are duty-bound to review any result based on empirical procedures as time goes by and as the data improves. It is granted that the implementation of frequent changes that contribute only marginally to accuracy does more harm than good by introducing an element of uncertainty, but it remains imperative to perform the review from time to time.
This has been done in South Africa on a number of occasions, and this latest review should be seen as another step in the attempt to refine the original work that was done more than 40 years ago, based on the latest database which now includes 86 cases of failed pillars and 337 of intact cases.
Successful pillar design has to satisfy the requirements of safety and economy simultaneously. The ultimate pillar is the smallest one that results in the required measure of stability.
Another complexity in empirical studies of this nature has to be borne in mind. The only data that is available refers to the as-mined dimensions of the pillars. Over time, it is known that pillars scale and thus decease in size. In the vast majority of cases, pillar failure occurs only after the passage of several years, sometimes after decades, meaning that the pillar size at the time of failure was in most cases less than the dimensions at the time of mining.
There is unfortunately no way of measuring the real pillar sizes at the time of failure and therefore this disadvantage simply has to be accepted, although it is used to explain a number of phenomena that will otherwise not make sense.
There may be ways to accommodate the time-dependent reduction in size, but that complexity is left for later and did not form part of the current study.
The pillar strength formulae were reviewed based on the updated coal pillar databases. Two well-established techniques were utilized for this purpose, namely the maximum likelihood method as introduced to pillar strength prediction by Salamon and Munro (1967) and the overlap reduction technique as proposed by Van der Merwe (2003a). The results of both techniques are compared and checked for applicability. The theory and application of both methods will be outlined in the following section.
Maximum likelihood method
The maximum likelihood method was first introduced to pillar stability evaluation by Salamon and Munro (1967). It has subsequently been used by several international authors and has proved its practical applicability throughout time. The theory behind the procedure was explained in detail in the original publication of Salamon and Munro (1967). The essential elements are explained in the following paragraphs.
The concept of a pillar safety factor is introduced as a measure for pillar stability. The safety factor (SF) is defined as
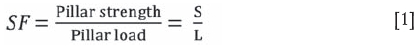
Using the common power equation for pillar strength S [kPa]:

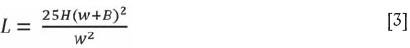
and tributary area theory for the determination of pillar load L [kPa]:
the safety factor can be written as:

It can be reasonably assumed that if the true values for pillar strength and load would be known, then failure has to occur for SF<1 and stability can be anticipated for SF>1.
However, due to the great variability of influencing factors on both in situ pillar strength and pillar load, true values are not known in practice. Instead one has to accept that the predicted SF of observed failed cases can be either larger or smaller than unity.
Salamon and Munro postulated that this variation of the observed safety factor at failure can be described by a lognormal distribution with zero mean (equalling a safety factor of unity), given as

The corresponding cumulative lognormal distribution of the safety factor, F(SF), is then expressed as

where ϕ is the cumulative normal distribution function. It should be noted that in contrast to formula given in the original publication of Salamon and Munro, the natural logarithm is used here.
It is desirable that an optimized pillar strength formula, which approximates the true strength of pillars acceptably well, maximizes the likelihood of obtaining the assumed lognormal distribution of the safety factor at failure. The standard deviation of the lognormal distribution has to be determined in the optimization process as well. It is desirable that the standard deviation is as small as possible in order to minimize the scatter of observed failures around the mean value of unity. This mathematical equation for this condition is expressed as a product function:
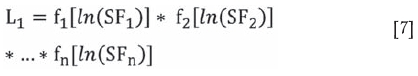
where n is the number of failed cases in the database. Optimization of the pillar strength formula is conducted by a careful iteration of values throughout the possible range of the variable input parameters k, a, ß, and σ.
A second condition can then be introduced to include the stable cases from the database in the investigation. This condition requires that the same parameters, which maximize the likelihood of obtaining a lognormal safety factor distribution at failure, should also maximize the probability of having a stable geometry for the stable cases in the database. This condition is expressed as:

where n is the number of stable cases in the database. Parameters that fulfil both conditions in an optimal way can be obtained from the product

A spreadsheet was set up in Excel to facilitate the maximum likelihood estimation from the updated databases. The required formulae (Equations [1]-[9]) were implemented by using available statistical functions in Excel. The iterative process of finding the optimal values for k, a, ß, and a was carried out with special optimization software @RlSK from Palisade.
Overlap reduction technique
Another approach to deriving optimal parameters for pillar strength was introduced by Van der Merwe (2003a) The concept was based on a technique described by Harr (1997) to determine the reliability of the performance of structures in civil engineering.
It can be argued that the best safety factor formula is the one that results in the least amount of overlap between databases of failed and stable pillar cases. Consequently, the reliability of a safety factor prediction can be quantified in terms of the overlap between the distributions of stable and failed cases.
The idea is illustrated in Figure 1. The frequency distributions of the updated databases of failed and stable cases are plotted as idealized lognormal distributions from their individual means and standard deviations. Safety factors were calculated using the original Salamon and Munro strength formula.
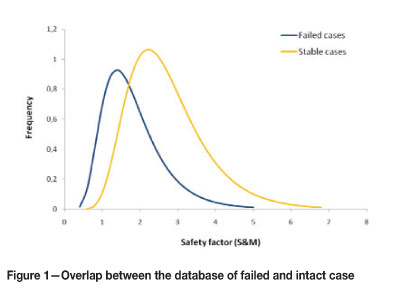
The overlap between the distributions is an indicator that the Salamon and Munro formula is adequate for designing pillars. It is obvious that with an increasing overlap the capability of distinguishing between failed and stable cases decreases, and vice versa.
Pillar strength optimization should then focus on reducing the overlap between failed and stable pillars. Due to the fact that the denominator of the safety factor, i.e. pillar- load, is a fixed value determined by the mining dimensions, the only adjustable parameters for the improvement of the performance of the safety factor formula are those included in the pillar strength formula.
Optimizing the performance of the safety factor concept is then simply a matter of varying the constants a and ß to achieve a minimum overlap between the distributions of failed and stable cases.
The area of overlap of two normal distributions (A) can be determined according to Harr (1996) from equations 10-12,

For x < 2.2 statistical tables should be used, although the following equation is an adequate description of the tables and perhaps easier to use:

In this nomenclature  and
and  are the mean values and σS and σf the standard deviations of the frequency distributions of stable and failed safety factors respectively.
Care must be taken in that the distribution of safety factors in both the stable and failed databases does not resemble a normal distribution, but a lognormal distribution. As the above formulae are valid only for normal distributions, the mean and the standard deviation of the natural logarithms of safety factors have to be used in this investigation.
Optimizing parameters a and ß in the pillar strength formula then changes the characteristics of the resulting safety factor distributions and allows a minimization of overlap between stable and failed cases.
It should be noted that a variation of the k-constant in the strength equation does not change the overlap of the two distributions, since it only 'shifts' both distributions by the same amount. The optimal value for k can be found on the assumption that a safety factor of unity (calculated with the new strength equation) should be the average safety factor of the failed cases. The optimal k value can therefore be found by a number of careful iterations, until the average safety factor of the failed cases equals unity.
An ideal safety factor formula, derived by these means, would result in a zero overlap between stable and failed cases. However, this is very unlikely to occur since the common safety factor formula cannot account for the many variables that influence pillar strength and pillar load.
For a better quantification of the optimization results an improvement factor I was introduced:

which determines the percentage improvement in overlap reduction between the database of failed and stable cases relative to the overlap that would result a safety factor calculation based on the new maximum likelihood estimation. In Equation [13], AMLM is the area of overlap that would result between the two lognormal distributions according to the new maximum likelihood strength formula, and AOR is the area of overlap between the two distributions after overlap reduction was carried out.
Total database
An initial analysis was conducted for the entire updated database comprising 86 failed and 337 intact pillar cases. Only pillar failures that occurred at the Witbank No. 5 seam were excluded from this investigation. The No. 5 seam is known for its weak floor conditions and it could not be confirmed whether the given cases in the database represent genuine pillar failures or foundation failures.
The strength parameters derived by means of maximum likelihood estimation and overlap reduction technique are presented in Table I. Neither the maximum likelihood estimation nor the overlap reduction technique could achieve satisfactorily results initially. The optimization procedures were not able to move the mean value of failed safety factors close to unity; instead they remained fairly high with SF = 1.39 (maximum likelihood) and SF = 1.37 (minimum overlap) respectively. The k-values were then adjusted to result in safety factors equal to unity for both cases. In addition the standard deviations of the predicted lognormal distributions are relatively large compared to the standard deviation σ obtained in the original Salamon and Munro investigation (σ = 0.16). This indicates a wider scatter of mining and geological conditions in the overall database.

A plot of the predicted safety factors of failed cases from the different coalfields highlights the significant differences between the coalfields (Figure 2). It is obvious that pillar failures in the Klip River, Vaal Basin, and Free State occurred at significantly higher safety factors than in the all other South African mining areas, which indicates a more complex geology or simply weaker coal material in these areas.

In order to derive optimal coal pillar strength formulae it was thus decided to split the total databases into two groups: The Klip River, Vaal Basin, and Free State coalfield were classified as 'weak coal' areas, while the rest of the database, which displayed more homogenous conditions, was grouped as 'normal coal' areas. A further subdivision of the database was not thought to be reasonable due to the fact that the remaining statistical evidence for each group was becoming too small to allow reliable solutions.
Normal coal areas
The group of 'normal coal' areas contained 48 failed and 276 stable cases. Satisfying results could be obtained from both maximum likelihood and overlap reduction techniques. A summary of the predicted pillar strength parameters can be seen in Table II.

The maximum likelihood estimations of the relevant pillar strength parameters resulted in a drop of the strength constant to k = 6613 kPa (Salamon and Munro: k = 7176 kPa). This had to be expected in light of the observed increase in safety factors of failed cases during the recent decades of coal mining. However, no significant change could be observed for the exponents a and ß, which stay practically the same with a = 0.50 (0.46) and ß =-0.70 (-0.66). The standard deviation of the predicted lognormal distribution is within the same range as obtained by Salamon and Munro with σ = 0.18 (σ 0.16). The small increase is practically insignificant and still confirms that a close clustering of failed cases around the mean value of unity was achieved.
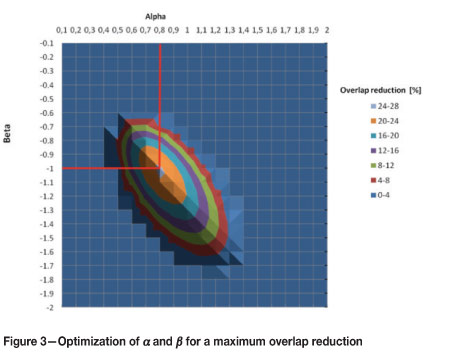
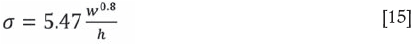
The application of the overlap reduction technique resulted in a lower strength coefficient of k = 5470 kPa, while a increased to a = 0.8 and ß decreased to ß = -1.0. The reduction in overlap is 24.5%, as it can be seen in Figure 3, and goes along with a small increase in the standard deviation of observed failures (σ = 0.22).
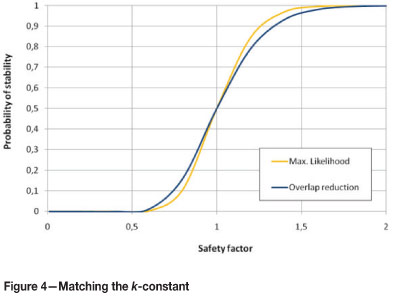
The k-constant was determined by following the assumption that the average safety factor of the failed cases should be unity. The optimal value for k could therefore be found by shifting the cumulative distribution curve until the average safety factor of the failed cases was unity. The resulting cumulative distribution curve can be seen in Figure 4.
The relationships between the predicted new pillar strength and width-to-height ratios are demonstrated in Figure 5. It can be seen that the new formula derived by means of maximum likelihood estimation confirms the original Salamon and Munro formula for all practical purposes. The new strength formula derived by means of overlap reduction displays similar behaviour to the linear strength formula as predicted by Van der Merwe (2003a).

Both formulae predict equal pillar strength for a pillar width-to-height ratio of about w/h = 1.88 at a pillar height of h = 3 m. In the range of w/h <1.88, the new minimum overlap formula predicts lower strength than the formula derived from maximum likelihood estimation. For the range of w/h >1.88 the predicted strength is higher. It can be anticipated that the choice of the strength formula may have implications for coal recovery, since different pillar sizes will be required in order to achieve the same SF. Note that this comment relates to the characteristics of the formulae, and should not be seen as implying that design should be done to low w/h ratios at shallow depth.
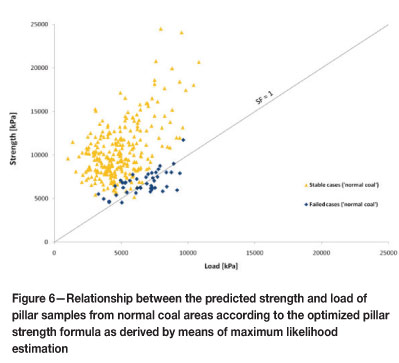
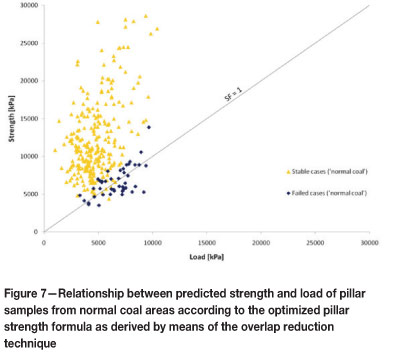
At this point, however, it should be emphasized that the use of both pillar strength formulae is technically justified. Both formulae distinguish reasonably well between pillars that collapsed and pillars that are intact. To demonstrate this fact, the pillar strength to pillar load relationships of stable and failed cases were plotted for both formulae in Figures 6 and 7. The line represents a safety factor of unity. Failed pillars are expected to scatter closely around this line, while stable cases should be located above it.
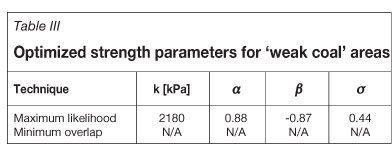
Weak coal areas
The databases of 'weak coal' areas comprise 31 failed and 38 intact cases. Pillar strength optimization by means of maximum likelihood estimation results in a very low strength coefficient k = 2180 kPa, while a increases to 0.88 and ß decreases to -0.87. The standard deviation of the lognormal distribution is again fairly large with σ = 0.44 and demonstrate that a close clustering of the failed cases could not be achieved. Figure 8 plots the strength to load relationship of both failed and stable cases in the group of weak coal areas. It can be seen that the overlap between failed and intact cases remains relatively large. Furthermore, five stable cases (i.e. about 13% of the stable database) are predicted to have safety factors significantly less than unity. It may thus be concluded that the maximum likelihood technique cannot achieve satisfying results.

The overlap reduction technique was also applied to the weak coal areas. The exponents a and ß were initially optimized for a range of 0.1 < a < 2.0 and -2.0 < ß < -0.1 respectively. An overlap reduction of about 50% could be obtained for a = 1.8 and ß = -2.0. The magnitude of both parameters has not been obtained before in an analysis, and gave rise to concern of a possible error. The concern was confirmed when the overlap reduction was performed for even greater values for a and ß, now ranging from 1 < a < 20 and -20 < ß < 1 respectively. An improved overlap reduction of 65% was then obtained for values of a = 14 and ß = -20. This result now shows clearly that the overlap reduction technique cannot perform a pillar strength optimization for the 'weak coal' area either.
Finally, it gives rise to suspicion that the cause behind the investigated failures may not be the inadequacy of pillar sizes, but rather geological discontinuities in the coal material, which weaken the pillars significantly and which cannot be considered with either of the pillar strength optimization techniques as proposed in this study. It is also possible that a different mode of system failure caused the failures in the 'weak coal' areas.
Conclusions
There is clear distinction between pillar failure in the so-called 'weak coal' areas, comprising the Klip River, Vaal Basin, and Free State coalfields, and the rest of the areas in South Africa. It was not possible to derive satisfactory strength formulae for the 'weak coal' areas using either the maximum likelihood or the overlap reduction technique of analysis. The pillars in those areas tended to fail at much higher safety factors, calculated by using the strength formulae developed for the 'normal coal' areas. It is postulated that the mode of failure may be different in these areas.
This distinction reinforces the notion that coals in different areas have different characteristics and that there is scope to develop site-specific strength formulae. However, the scarcity of data for the different areas prevents reliable formulae from being developed at this stage, and therefore the broad distinction of 'weak' and 'normal' has to suffice for the time being.
The updated databases resulted in only slightly different strength formulae for the different approaches to the analysis than were obtained previously. Both the maximum likelihood and the overlap reduction technique resulted in usable formulae.
The maximum likelihood method resulted in the following formula for pillar strength in the 'normal' areas, i.e. all the coalfields with the exception of the Vaal Basin, Klip River, and Free State:

The overlap reduction method resulted in the following formula for the 'normal' coal fields:
The maximum likelihood technique resulted in a closer grouping of the failed cases around the average safety factor of unity for the failed cases, while the overlap reduction technique resulted in better distinction between cases of failed and stable pillars.
The two formulae were derived from the same data, but using different statistical techniques. This deserves discussion.
Using the maximum likelihood technique results in a closer grouping of the data around a safety factor of 1.0. This is to be expected, as the underlying assumption in using the technique is that pillars fail at a safety factor minimally less than 1.0 and the variables are then adjusted such that the safety factors conform as closely as possible to that expected outcome.
There is no evidence that this underlying assumption is valid. Firstly, before the notion of a safety factor was introduced, the older pillars were designed around operational parameters rather than stability. There was thus no consideration given to leaving pillars to any standard with regard to stability.
Secondly, both the methods rely on the as-mined dimensions, and it is widely recognised that pillars scale over time. Only in the rarest of cases does failure occur immediately after mining, and consequently the pillar dimensions at the time of failure are not the same as at the time of mining. Failure can occur at almost any time several decades after mining, and the pillars would all have deteriorated to different extents. Attempting to force these pillars to correspond to any given single value of safety factor is not valid.
The overlap reduction technique suffers from the same deficiency with regard to change in dimensions over time, but it does not rely on any assumption regarding the safety factor at the time of failure. It merely views the two databases of failed and intact cases and then adjusts the variables to separate the two databases as best as possible. It is inherently based on differentiating between failed and stable cases.
It is then also to be expected that the data will exhibit wider scatter, but that is a reflection of reality. As there was no norm with regard to a safety factor at the time that the older pillars date from, it cannot be expected that they will group around any given value of safety factor.
As the reason for performing pillar design is to ensure a stable layout - i.e. achieve a required distinction between stability and failure - the formula resulting from the overlap reduction technique (Equation [15]) is preferred.
The fact that the outcomes of the two techniques both result in a certain amount of scatter of the data, i.e. distributions rather than singular solutions, hints very strongly at considering the probability of failure is preferable, rather than a safety factor, in performing pillar design. This topic is addressed in Van der Merwe and Mathey (2013b).
Recommendations for further research
The first, and perhaps most important, recommendation is that the pillar strength formulae should be reviewed at regular intervals as the database of failed pillars grows over time. The most suitable method of analysis has been found to be empirical, and as the quality of data improves, it should be used to continually improve the accuracy of the strength formulae. This implies that the database of failed pillars should be maintained by a selected research agency.
The second issue is that the squat pillar formula for wide pillars should also be reviewed to fit in with the new formulae. There is no longer a smooth transition from the 'slender' to the 'squat' pillar regions. The formula currently in use was developed to fit seamlessly with the Salamon and Munro (1967) formula, and adaptation is now required.
Coupled with that, is the curious fact that as things stand now, two formulae are required to fully define pillar strength at all width-to-height ratios. This implies acceptance that at lower width-to-height ratios, there is zero contribution from confinement, and that a certain ratio (somewhat arbitrarily selected), it suddenly begins to have an effect.
This is difficult to understand in nature and may indicate that fundamental understanding of pillar strength is lacking. The view that pillar strength is a function of the width and height dimensions in certain combinations, coupled to a constant representing the material strength, may be an oversimplification. It is for instance not inconceivable that the contribution of the material strength diminishes as the width-to-height ratio increases or that pillar strength increases exponentially over the full range of width-to-height ratios. This is fundamental work that should be addressed.
In similar vein, the previous work to predict the stable life-span of coal pillars (Van der Merwe, 2003b) should also be reviewed using the latest available data.
Acknowledgements
The Coaltech Research Association is gratefully acknowledged for partial financial support of the research described in the paper.
References
Harr, M. 1997. Reliability-Based Design in Civil Engineering. Dover Publications, New York. [ Links ]
Salamon, M.D.G. and Munro, A.H. 1967. A study of the strength of coal pillars. Journal of the South African Institute of Mining and Metallurgy, September. [ Links ]
Van der Merwe, J.N. 2003a. New pillar strength formula for South African coal. Journal of the South African Institute of Mining and Metallurgy, vol. 103, no. 5. pp. 281-292. [ Links ]
Van der Merwe, J.N. 2003b. Predicting coal pillar life in South Africa. Journal of the South African Institute of Mining and Metallurgy, vol. 103, no. 5. pp. 293-301. [ Links ]
Van der Merwe, J.N. and Mathey, M. 2013a. Update of coal pillar database for South African coal mining. Journal of the Southern African Institute of Mining and Metallurgy, November, vol 113, no. 11. pp. 825-840. [ Links ]
Van der Merwe, J.N. and Mathey, M. 2013b. Probability of failure of South African coal pillars. Journal of the Southern African Institute of Mining and Metallurgy, vol. 113, no. 11. pp. 849-858 ♦ [ Links ]
Paper received May 2013
Revised paper received Sep 2013.
© The Southern African Institute of Mining and Metallurgy, 2013. ISSN 2225-6253.

