


Services on Demand
Article
 English (pdf)
 Article in xml format
 Article references
Indicators

Related links
-
 Cited by Google
 -
 Similars in Google
Share

 Permalink
Journal of the Southern African Institute of Mining and Metallurgy
On-line version ISSN 2411-9717
Print version ISSN 2225-6253
J. S. Afr. Inst. Min. Metall. vol.113 n.11 Johannesburg Nov. 2013
Update of coal pillar database for South African coal mining
J.N. van der MerweI; M. MalheyII
IUniversity of the Witwatersrand
IIUniversity of the Witwatersrand and RWTH Aachen University
ABSTRACT
Following the Coalbrook disaster in 1960, research into coal pillar strength resulted in the adoption of the concept of a safety factor for the design of stable pillars in South African coal mining.
At the time when the original statistical analysis was performed by Salamon and Munro in the early 1960s, 27 cases of failed pillar workings were considered suitable for inclusion in the database of failed pillars. Pillar failure did not stop after the introduction of the safety factor formula by Salamon and Munro (1967). In the ensuing years, pillars that were created before the application of the formula deteriorated and later failed, as did ones that were created after the introduction of the formula. This means that over time, the database of failed pillar cases increased in size, allowing ever more reliable analyses to be performed.
The number of failed cases in the database had grown from the original 27 in the 1960s to 86 by 2011. All the failed cases are contained in the updated database. The database of stable pillars, which is also used in the derivation of strength formulae, has now been extended from 125 to 337 cases.
The new database of intact pillar cases is more complete as it bridges the time gap between the Salamon and Munro (1967) and the Van der Merwe (2006) databases. The original requirements for inclusion into the database were satisfied in the compilation of this latest collection.
The characteristics of the original database of intact pillars did not change in a meaningful way. The mining depth and pillar dimensions of the new database are largely as they were in the original database.
Time-related trends with regard to pillar dimensions and depth of mining could not be found, indicating that the geometrical parameters of coal mining in South Africa have not changed meaningfully in approximately a century of mining.
The characteristics of cases in the updated database of failed pillars does not differ substantially from the one published by Van der Merwe (2006). The same difference between that database and the original Salamon and Munro database, namely that the average safety factor of the failed cases had increased dramatically, from 1.0 to 1.5, is still apparent. This may be due to the inclusion of more failures from specific areas that exhibit a disproportionate number of failures at higher safety factors. These areas are the Vaal Basin, Klip River, and Free State coalfields.
The new database confirms yet again that there is no correlation between the safety factors of failed pillars and their time of failure. The safety factor on its own is thus not a reliable predictor of longterm stability of pillars.
Keywords: coal pillar, stable pillar cases, pillar collapse, pillar database.
Introduction
Following the Coalbrook disaster in 1960, research into coal pillar strength resulted in the adoption of the concept of a safety factor for the design of stable pillars in South African coal mining.
The pioneers in this field were M.D.G. Salamon and A.H. Munro (1967), who preferred to use statistical back-analysis of failed and intact pillars to determine the pillar strength, and Z.T. Bieniawski, whose attempt was based on the direct strength determination of coal pillars using specimens of various sizes.
At the time when the original statistical analysis was performed, 27 cases of failed pillar workings were considered suitable for inclusion in the database of failed pillars. The main criteria for inclusion were that there had to be reasonable certainty that the pillars themselves had failed (not the roof or the floor), that the panel width had to be at least equal to the depth of mining, and that the pillar layout had to be reasonably consistent.
The pillar load in the original work by Salamon and Munro (1967) was assumed to be the tributary area load, based on the concept that each individual pillar is responsible for bearing its full share of the overburden load. While this simplified approach ignores a number of factors that actually reduce the real load on pillars, such as the stiffness and bridging capability of the overburden and the existence of interpanel pillars, it remains a simple and acceptable method of calculating pillar load provided that the pillars have more or less the same size, are equally spaced, and that the panel is at least as wide as the depth of mining.
Pillar failure did not stop after the introduction of the safety factor formula by Salamon and Munro (1967). In the ensuing years, pillars that were created before the application of the formula deteriorated and later failed, as did ones that were created after the introduction of the formula. This means that over time, the database of failed pillar cases did not remain constant, but that it increased in size, allowing ever more reliable analyses to be performed.
Researchers are duty-bound to review any result based on empirical procedures as time goes by and as the data changes. It is granted that the implementation of frequent changes that contribute only marginally to accuracy does more harm than good by introducing an element of uncertainty, but it remains imperative to perform the review from time to time.
There have been updates in South Africa on a number of occasions, and this latest review should be seen as another step in the attempt to refine the original work, which was done more than 40 years ago.
The first step in the re-analysis was to compile a new database containing the latest failures that satisfy the selection criteria. A new, extended database of stable pillars was also compiled to enable the analysis to include determination of failure probability.
General description
Since the most frequent approach to determining pillar strength was to observe the geometries of failed and stable pillars, a comprehensive database of coal pillars was generated in South Africa over time. It originated from the work of Salamon and Munro (1967), but was updated and extended by several researchers in the following decades. Van der Merwe (2006) published and discussed a later version of the coal pillar database.
It should be noted that the various entries (i.e. 'cases') in the database do not refer to observations on single pillars. A case always represents a significantly large group of pillars in bord and pillar workings that either collapsed or remained intact. The recorded geometries of failed and intact cases are derived from averaging the observed characteristics within these pillar groups.
It can be assumed that nearly all cases of pillar failure up to 2006 were registered in the database. The database indicates that the majority of failures in coalfields of 'normal coal strength' occurred at safety factors between 0.7<SF<1.6. Significantly less frequent failures could be observed with higher safety factors.
Unlike the failed pillar database, the database of stable cases stores only a limited number of samples from the entire population. The composition of this database is of critical importance, since for any statistical analysis it is desirable that the database resembles the characteristics of the entire population of stable pillars as closely as possible.
The intact pillar samples were taken from different time intervals of coal mining and from different coalfields in South Africa. The majority of samples come from the Witbank coalfield, as this is the area where the main coal mining activities take place. The intact samples cover a wide range of safety factors between 0.9<SF<10.0 with a mean value of 2.39, which is significantly higher than the mean value of the failures in normal coal areas (SF≈1). Nevertheless both- databases exhibit overlapping information for a safety factor range of about 0.9<SF<1.6 (the less frequent failures in the known weak coal areas with large safety factors are ignored here).
This overlap indicates the safety factor interval in which pillar design takes place and neither pillar collapse nor stability can be predicted with a satisfying degree of reliability. A comparison of the number of failed to the number of stable cases in this interval is required to determine the probability of failure, which in return can assist in pillar design decisions.
So far only 20% of all registered intact pillar samples have safety factors in this range of focus. It requires a careful examination to decide if this number can be taken as representative for the entire population of stable pillars or if refinement is needed.
It seems reasonable to suppose that a certain number of stable pillars with low safety factors have not been detected so far. One can imagine that in collieries that operated in the first half of the 20th century, pillar design was based on trial and error rather than on scientific knowledge. The influence of safety requirements on pillar design was not as strong as it is today. Both arguments speak for the assumption that groups of small pillars might be found on maps from historical mines. The update of the stable database therefore started with extensive research at the archives of the mining authority, the Department of Mineral Resources (DMR).
Database of intact pillars
A visual inspection of mine plans from about 170 abandoned collieries was carried out at the archives of the DMR in Pretoria.
The available data covers roughly 100 years of bord and pillar mining activities in South Africa, starting in the late 19th century, while the majority of information comes from abandoned coal mines that operated between the 1930s and 1970s.
The criteria for the inclusion of mine plans in the database were as follows:
- Completeness of information-As the investigation aims on a back-calculation of pillar safety factors, at least one data point on each mining depth below surface and mining height had to be available. A greater density of information was preferred. Pillar width and bord width can generally be obtained from measurements of the mapped pillar geometries
- Scale of plan-For accuracy reasons it was decided that only plans with a scale of 1:1500 or higher could be included in the investigation
- General accuracy of mapping-It is essential for a reliable back-calculation of safety factors that the mapped pillar geometries reflect the 'as-mined' pillar shape as accurately as possible
- Panel width-The panel width had to be at least equal to the mining depth.
General observations
It was found that only 48 maps from 11 closed mines provide the relevant information with the accuracy required by the given assessment criteria.
The entire set of mine maps from the first half of the 20th century had to be excluded from further analysis due to the fact that the completeness of information criterion was not satisfied. This circumstance deserves a certain explanation, and therefore an outline of how the essential pillar and mining geometries have to be derived from maps is necessary.
Surface contours are a random occurrence on maps from the first half of the 20th century, and were found more frequently only on maps from the late 1960s onwards. However this lack of information can be compensated in some cases by information provided by mapped exploration boreholes, where usually the borehole collar and seam intersections (roof and floor) elevations are indicated. The great majority of South African coal deposits are generally flat lying, as is the land surface in the coal mining areas. Hence these single information points can be regarded as acceptable for interpolating a sufficiently accurate mining depth below surface for pillars located between them.
A bigger challenge was thus to find reliable values for mining heights in the underground workings. This information can be derived only from mapped survey pegs, where roof and floor elevations are usually measured. However it was found that the available data from the first half of the 20th century indicated only the working roof elevations, if that. Consequently nearly all the data from this time period had to be rejected due to a lack of mining height information.
Another problem concerning the general accuracy of available information from old maps has to be addressed in this context as well, i.e. that in many cases pillar geometries are not mapped 'as-mined' but as idealized square pillars. The absence of survey pegs in the vicinity of those pillars would also indicate that they were not properly surveyed. Due to the delicate relationship between pillar size and pillar stability it was thus decided to exclude those cases from further investigations.
The general observation on the layouts of panels from the early decades of coal mining was such that no tendency towards a higher extraction ratio and smaller pillars could be detected. However, it might be reasonably assumed that mining in the early stages was focused on convenience rather than on stability.
This view might find valid support in the findings of the Petrick Commission of Inquiry (Lang, 1995), which was set up by the South African government in 1970 to investigate the national coal resources. In its final report from 1976 the commission declared that usage of coal deposits had been inefficient and wasteful so far. This statement certainly refers to the predominant application of the bord and pillar mining method and selective mining of only coal seams or horizons within thicker seams with highly favourable geological conditions and qualities. But it was also found that the general percentage of coal mined in situ at most of South African collieries was low - in some extreme cases amounting less than 10%.
Description of the selected mine maps
The oldest mining maps that were considered to be suitable for the derivation of intact coal pillar cases come from a colliery that operated in the 1950s. The majority of the- selected 11 mines operated in the 1960s and 1970s. While it was not possible to include cases from the early decades of coal mining in South Africa in the investigation, the selected data set at least allows the improvement of the consistency of the overall intact pillar database, as it closes the time gap between the samples collected by Salamon (pre-1960) and other researchers' data (majority of pillars mined post-1980).
The scale for mapping was generally found to be 1 in 1500. Until the 1970s English feet were used as units for coordinates and elevations. The latter are expressed in feet below an imaginary datum plane, which was usually set at 6000 English feet above mean sea level.
Since the enactment of the National Measuring Standards Act No. 76 of 1973, all units were metricated and elevations are now expressed in metres above mean sea level. In a transitional period of about 5 years, both old and new units are found on maps.
Data preparation and sampling
In order to analyse the mapped pillar geometries as accurately as possible, the selected 48 maps were professionally reproduced by photographic techniques. The resulting highresolution raster images were brought into a geographic information system (ArcGIS® from ESRI), where geometrical distortions -due mainly to the central projection of the reproduction camera - could be compensated by adjusting the coordinate grid points digitally on the map. The geo-referenced maps then formed the basis for the sampling of intact pillar cases.
The pillar dimensions for each selected sample area were determined by digitizing about 50 pillars in the selected panels. Care was taken that the areal extent of the sample area was at least equal to the mining depth.
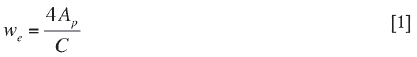
The average effective square pillar width (we) was determined according to the Wagner (1980) formula from the pillar's cross-sectional area (Ap) and circumference (C):
The mining height in the relevant area was read from the map and averaged in those cases where more than one value was available.
The mining depth below surface was either derived from surface contours in conjunction with underground survey pegs or directly from registered borehole elevations. In case of the latter it had to be assumed that the recorded seam thickness equals approximately the mining height of the underground operations, which is believed to be realistic in cases where the seam thickness does not exceed 3 m.
The average bord width in the sample area was measured along 6 rows of pillars, each three in opposing directions, as demonstrated in Figure 1.
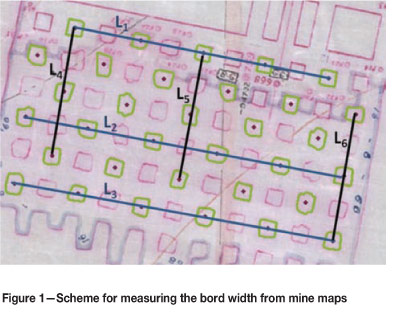
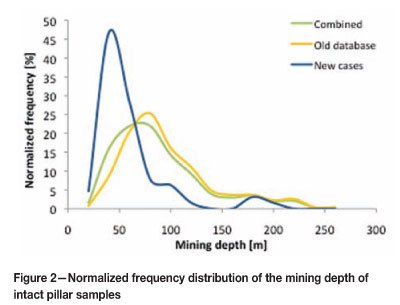
The bord width is calculated according to Equation [2]:
where Li is the measured distance between the centres of pillars at the beginning and end of a row, ni is the number of pillars within a row, and we is the average effective pillar square width for the investigated area.
To avoid an unbalanced data acquisition a minimum distance of 500 m was chosen between the sample areas. This distance may account for changes in geological and mining conditions in the production areas.
For the identification of samples the name of the colliery, the coalfield, and the seam in which the operation took place, as well as a representative coordinate from the sample area, were recorded. The panel span, given as the minimum distance between barrier pillars or the abutment surrounding the panel, was taken as a very rough indication for the applicability of tributary area loading on pillars.
A catalogue was compiled in Excel® for the sampled cases. In addition to the abovenamed characteristics a picture detail of the digital map, showing the investigated area, was included.
A critical aspect concerning the acquisition of stable cases from old mine maps was the validation of the data, i.e. the proof that the chosen cases are indeed still intact. The only practical means of proving the stability of the abandoned workings was to examine aerial photos of the land surface above the excavated areas and to check for possible disturbances that might indicate a collapse of the void underneath. As only a small number of intact cases from the old maps were added to the database, this situation did not arise often.
Data comparison
A total of 64 samples of stable cases could be derived from the review of historical mine maps. The updated database of stable pillars now comprises 337 cases in total and stores bord and pillar mining dimensions from about 80 years of coal mining in South Africa. The characteristics of the old database have been already discussed in full detail by Van der Merwe (2006). The following descriptions should thus focus on the characteristics of the newly sampled cases and their impact on the total databases. It should also be kept in mind that the new samples come mostly from a different period of mining, namely from the 1960s and 1970s.The vast majority of cases in the old database come from the investigation of Salamon and Munro (pre-1960) and other research (post-1980).
In the following discussion the characteristic dimensions (pillar width, mining height, bord width, depth of mining) of- the observed pillars will be displayed in frequency diagrams. In order to simplify the comparison between the old and new data, all observed frequencies are normalized against the total number of observations in the relevant group and expressed as a percentage. The database was also checked for possible correlations between the characteristics. The newly sampled cases are shown in blue colour, while for the old database orange is used. The characteristics for the combined database are displayed in green colour.
Mining depth
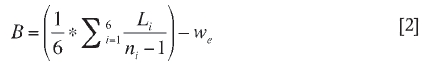
The average statistical depth of mining in South Africa is about 80 m below surface, while the vast majority of newly added samples come from shallower operations of up to 20 m below surface. The normalized frequency distribution of the depth of mining of the stable cases is presented in Figure 2.
Bearing in mind that the new samples come from a different period of mining than the rest of the database, the question was considered whether a connection would exist between the date of mining and the depth of mining activities. However, a statistical link could not be established - the correlation is less than 1%. This finding may be somewhat surprising, since one could have imagined that mining activities in South Africa started at easily accessible deposits near surface and then descended to deeper deposits. It should be kept in mind that the available statistic refers only to a limited number of observations (337) on mining characteristics in South Africa, which may not be suitable for detecting every trend that possibly exists.
Pillar width
The average pillar width in the combined database is about 10.5 m. For the new cases it can be expected that the width is smaller than the overall mean value, since the new cases are derived almost exclusively from mining operations at shallow depth, and pillar width is expected to increase with increasing mining depth for stability reasons. This expectation is confirmed by the normalized frequency distribution in Figure 3.
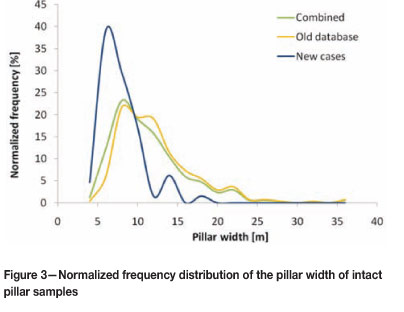
A weak but existing correlation between pillar width and mining depth of about 60% was found in the database of intact pillars.
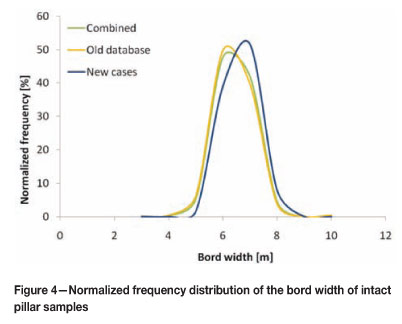
Bord width
Practically no change can be observed for the bord width. The average value for the old database is approximately 6 m; the average value for the new data is just slightly higher. Consequently the combined database maintains its original close, normally distributed scatter around the mean of 6 m. The corresponding normalized frequency distributions are given in Figure 4.
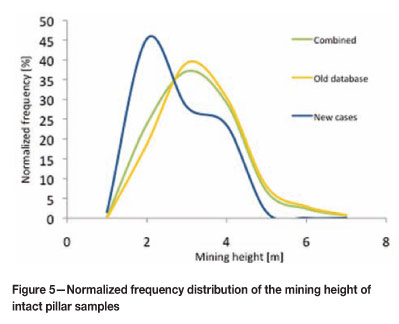
Mining height
The average mining height of the sampled pillars in the combined intact database is about 3 m. The frequency distribution of the new cases peaks at a lower value of 2 m, but the average value is close to 3 m as well. The characteristics of the mining heights in the different databases can be obtained from Figure 5.
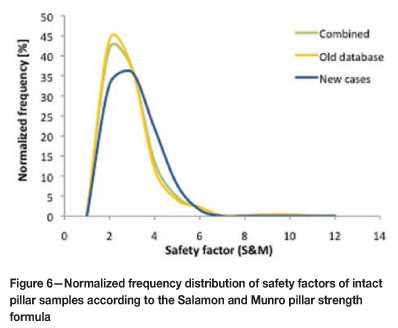
Distribution of safety factors
Safety factors of the cases in the stable database were calculated using the original Salamon and Munro (1967) formula. The frequency distribution of safety factors in the old stable database has a mean value of SF = 2.4, but ranges in a few cases up to SF = 10. The mean value of the new cases is similar to the old database with SF = 2.6, but the clustering of the distribution is narrower. The frequency distribution of the combined database does not change its characteristics significantly and maintains the shape of a lognormal distribution (Figure 6).
Trends
The data was analysed in an attempt to identify trends related to time and various other parameters.
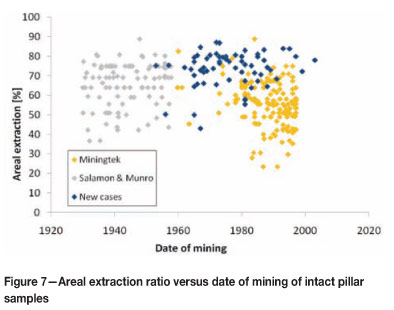
Areal extraction ratio versus date of mining
A plot of the areal extraction ratio versus date of mining was thought to give insight into matters of the mines' resource utilization throughout time. Possible time-dependent factors influencing the coal recovery rate may include the available mining technology as well as coal demand and prices at the time. Other factors are geological conditions and safety requirements.
It should be noted that the exact mining dates for the sampled cases from Salamon and Munro (1967) are not known. However, it may be reasonably assumed that the date of mining falls into a time interval between 1930 and 1958, since the authors derived their cases from actively operating collieries and closed the databases 5 years before they started the analysis in the 1960s. Consequently, randomly computed mining dates between 1930 and 1958 could be assigned to each of the Salamon and Munro cases for demonstration purpose.
Figure 7 reveals a fairly large scatter of the sampled extraction ratios in the range of 20% to 90%. However, a somewhat surprising finding is that the average extraction ratio throughout time is relatively consistent at about 60%. Figure 7 also confirms the assumption that was expressed earlier, i.e. that there is no evident tendency towards smaller pillars and higher extractions in the earlier stages of coal mining in South Africa.
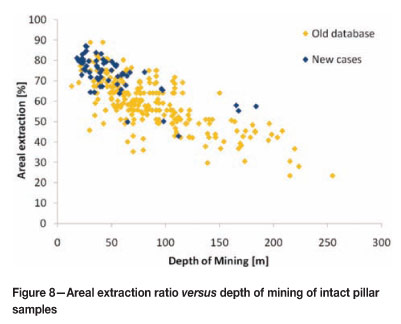
Areal extraction versus depth of mining
It was mentioned earlier that the pillar width can be assumed to be a function of the depth of mining, since it is obvious that pillar sizes have to be enlarged when mining operations approach greater depth and the overburden load increases. Consequently it should be expected that the coal recovery rate in a bord and pillar operation can also be considered as a function of depth: the deeper the mining operations, the less the extraction ratio. Figure 8 may confirm this general trend. The correlation between the areal extraction ratio and the mining depth is weak, but existing at about 0.55.
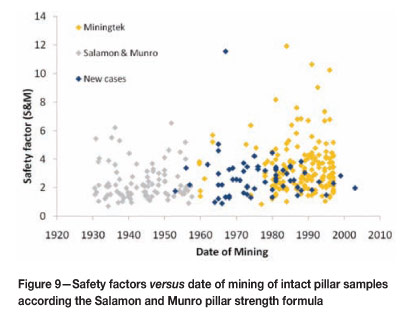
Safety factor versus date of mining
There has been an increase in pillar safety factors since the publication of the Salamon and Munro (1967) strength formula. The average safety factor of samples from pre-1967 is about SF = 2.0 (back-calculation with the Salamon and Munro strength formula), while the average safety factor of cases mined post-1967 was found to be significantly higher with SF = 2.6. It can be seen in Figure 9 that some post-1980 cases exhibit very large safety factors with SF > 7, which was the upper limit for cases from earlier decades. However, a general correlation between safety factor and date of mining could not be established.
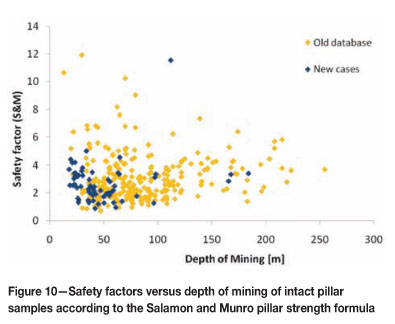
Safety factor versus depth of mining
Figure 10 demonstrates that a wide scatter exists for the applied safety factors at any depth interval. The majority of safety factors have values greater than SF = 1.6, which is the proposed design criterion according to Salamon and Munro (1967). There is no correlation between the safety factor and- the depth of mining . This finding is certainly not surprising, since the safety factor formula already includes the depth of mining in its calculation.
Database of failed pillars
The latest version of the database of failed pillars was published by Van der Merwe (2006). An earlier database could be sourced from a report on the development of seam-specific strength formulae by Salamon et al. (2005). Both databases store essentially the same information and differ only in a few additional cases that the different researchers included in their own investigations.
A new database was set up that included both the common and the additional information of the two databases. A further six cases of pillar failures at Vierfontein colliery (Free State coalfield) were added from investigations of Van der Merwe. Another failure at Kriel colliery (Highveld coalfield) in 2007 was also included.
The data research at the DMR also revealed two additional panel collapses that had not been captured by earlier investigations of other researchers. They were spotted on a mine map from Natal Cambrien colliery (Ballengeich section), where the outline of the panel collapse was indicated with a red-coloured boundary line. The failures occurred in two different panels at a distance of about 350 m from each other, close to the N11 highway south of Newcastle. The shape of the indicated subsidence trough could be roughly confirmed by aerial photos of the land surface.
A safety factor back-calculation for both cases resulted in SF = 1.04 and SF = 3.03 respectively. While the SF = 1.04 failure can be plausibly related to a collapse of pillars, the other SF = 3.03 failure gave rise to concerns about the mechanism behind the collapse. Out of caution it was then decided to exclude this case from further investigations. The updated database comprises 86 cases of pillar failure.
Data comparison
For the following descriptions the same conventions were used as for the database of stable cases. The term 'old database' will refer to only those cases that were common in both the Van der Merwe (2006) and Salamon et al. (2005) database. New cases comprise the additional information that was stored in the two separate databases plus the newly added failures from Vierfontein, Kriel, and Natal Cambrien colliery. It will be seen that no significant changes in the characteristic values of the database occurred due to the inclusion of additional new cases. This circumstance is certainly owed to the facts that the new cases comprise only 15% of the combined database, and that the new samples cover roughly the same range of characteristic values as the old database.
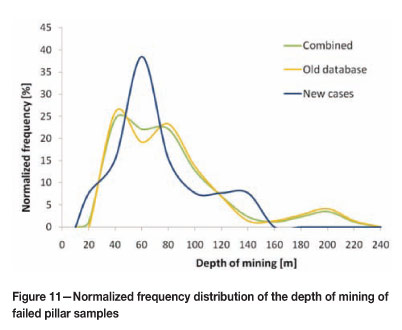
Mining depth
The observed cases of failed pillars range in depth between 20 m and 220 m, which is about the same depth that is covered by samples in the database of stable pillars. The highest concentration of failures can be observed at shallow mining depths between 40 m and 80 m (Figure 11).
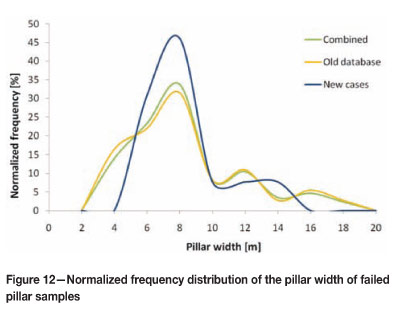
Pillar width
The frequency distribution of pillar width of the sampled failed cases can be seen in Figure 12. The highest density is found around the mean value of about 7 m for both the old database and the new cases. No significant changes in the distribution of the combined database can be observed.
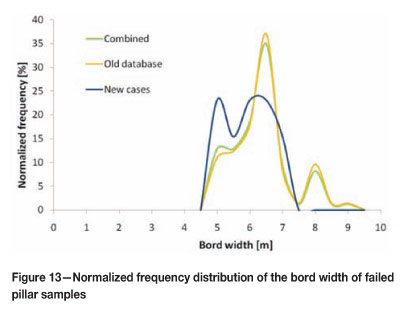
Bord width
The frequency distribution of the reported bord width of- failed cases is plotted in Figure 13. The mean value of the distribution is just slightly higher than 6 m, and therefore still very similar to the average bord width obtained from the stable cases.
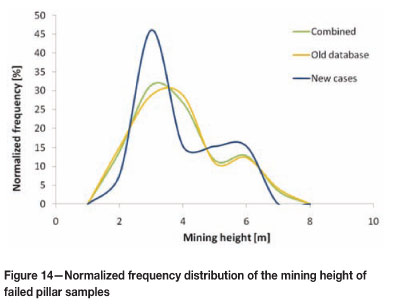
Mining height
The frequency distribution of mining heights, as shown in Figure 14, peaks at a value of about 3 m but ranges up to values slightly higher than 6 m. Again, no major shift in the combined database can be observed.
Safety factor
The distribution of safety factors (using the original Salamon and Munro formula) is plotted in Figure 15.
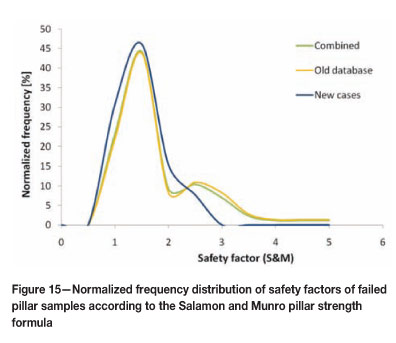
It goes without saying that substantially smaller values have to be expected for the failed cases than for the stable cases.
The average safety factor of the updated database of failed cases is SF = 1.53. Applying the same calculation to only the failed cases that were sampled by Salamon and Munro, however, results in a substantially lower and desirable safety factor close to unity. The following conclusions can be drawn from this observation.
The increase in the average safety factor indicates that the average strength of pillars in the database was actually weaker than predicted by the formula. This emphasizes the need to update empirically derived formulae in regular time steps in order to reflect the actual mining conditions as accurately as possible. Furthermore, as the updated database now comprises a greater variety of coalfields and seams, it should also be concluded that the variety of geological conditions in which mining operations take place has increased since the investigations of Salamon and Munro. It might therefore be reasonable to update the coal pillar strength formula for certain groups of coalfields or seams.
Safety factor versus time to failure
It is well known from practice and research that coal pillars tend to scale over time, thereby reducing their size and finally reaching safety factors low enough for collapse to occur. Scaling rates for the different South African coal seams were determined by Van der Merwe (2003a, 2004) on an empirical basis. Figure 16 shows an updated plot of safety factors versus the time to failure of pillars. It should be noted that not all failed cases from the database could be included in this illustration due to a lack of information on the mining or failure date. However, Figure 16 still demonstrates reasonably well the major difference between the South African coalfields. Failures in the Free State, Klip River, and Vaal Basin occur at significantly higher safety factors and in a shorter average time than in the other coalfields. Failures from the latter are clustered closer around unity.
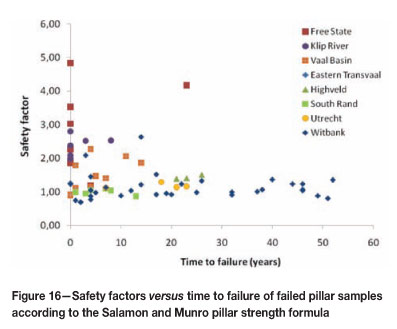
This finding emphasizes that a certain variety of geological conditions and coal strength was captured within- the database of failed cases. This circumstance will have to be reconsidered when the updated databases are utilized for the adjustment of coal pillar strength formulae.
Another important conclusion is that no statistical link exists between the safety factor and the time to failure. In the Witbank coalfield, for instance, where the largest portion of failures occurred (and where the majority of coal mining activities take place), the life span of pillars ranged between zero and 55 years. This should be noted against the background of the more or less homogenous safety factors of that group, which do not display significantly different values.
Conclusions
Pillar failures continue to occur, and as a result the data on which to base empirical strength formulae becomes ever more reliable. Researchers are duty-bound to review any empirical conclusion from time to time as the databases change. The original Salamon and Munro (1967) database of failed pillar cases has now increased from 27 to 86, more than three-fold.
The new database of intact pillar cases is more complete as it bridges the time gap between the Salamon and Munro (1967) and the Van der Merwe (2006) databases. It now contains 337 cases.
The original requirements for inclusion into the database were satisfied in the compilation of this latest collection.
The characteristics of the original database of intact pillars did not change in a meaningful way. The mining depth and pillar dimensions of the new database are largely as they were in the original database.
Time-related trends with regard to pillar dimensions and depth of mining could not be found, indicating that the geometrical parameters of coal mining in South Africa have not changed meaningfully in approximately a century of mining. It was also interesting to note that the average safety factors of the stable cases prior to 1967 was around 2.0, implying that in general, pillar design was safe even before the implementation of the notion of a safety factor. There were of course exceptions, such as the well known Coalbrook Colliery that collapsed in 1960.
The updated database of failed pillars does not differ substantially from the one published by Van der Merwe (2006). The same difference between that database and the original Salamon and Munro database, namely that the average safety factor of the failed cases had increased dramatically, from 1.0 to 1.5, is still apparent. This may be due to the inclusion of more failures from specific areas that exhibit a disproportionate number of failures at higher safety factors. These areas are the Vaal Basin, Klip River, and Free State coalfields.
The new database confirms yet again that there is no correlation between the safety factors of failed pillars and- their time of failure. The safety factor on its own is thus not a reliable predictor of long-term stability of pillars.
Acknowledgements
The Coaltech Research Association is gratefully acknowledged for partial financial support of the research described in the paper.
References
Lang, J. 1995. Power Base: Coal Mining in the Life of South Africa. Jonathan Ball, Johannesburg. [ Links ]
Salamon, M.D.G., Canbulat, I., and Ryder, J.A. 2005. Development of Seam-Specific Strength Formulae for South African Collieries. Final report to Coaltech 2020. www.coaltech.co.za. [ Links ]
Salamon, M.D.G. and Munro, A.H 1967. A study of the strength of coal pillars. Journal of the South African Institute of Mining and Metallurgy, September, 1967. pp. 56-67. [ Links ]
Van der Merwe, J.N. 2006. South African coal pillar database. Journal of the South African Institute of Mining and Metallurgy, vol. 106, no. 2 pp. 115-128. [ Links ]
Wagner, H. 1980. Pillar design in coal mines. Journal of the South African Institute of Mining and Metallurgy, vol. 80, no. 1. pp. 37-45. [ Links ]
Van der Merwe, J.N. 2003a. New pillar strength formulae for South African Coal. Journal of the South African Institute of Mining and Metallurgy, vol. 105, no. 5. pp. 281-292. [ Links ]
Van der Merwe, J.N. 2004. Varification of pillar life prediction methos. Journal of the South African Institure of Mining and Metallurgy, December 2004. pp. 667-677. [ Links ] ♦
Paper received May 2013
Revised paper received Sep. 2013
© The Southern African Institute of Mining and Metallurgy, 2013. ISSN 2225-6253.


