


Services on Demand
Article
 English (pdf)
 Article in xml format
 Article references
Indicators

Related links
-
 Cited by Google
 -
 Similars in Google
Share

 Permalink
Journal of the Southern African Institute of Mining and Metallurgy
On-line version ISSN 2411-9717
Print version ISSN 2225-6253
J. S. Afr. Inst. Min. Metall. vol.113 n.10 Johannesburg Jan. 2013
GENERAL PAPERS
Relating high-resolution tilt measurements to the source displacement of an M2.2 event located at Mponeng gold mine
P. ShareI, II ; A. MilevI; R. DurrheimI, II, III; J. KuijpersI; H. OgasawaraI, IV
IJST-JICA, Science and Technology Research Partnership/or Sustainable Development (SATREPS).
IICouncil/or Scientific and Industrial Research, South Africa
IIIUniversity of the Witwatersrand, South Africa
IVRitsumeikan University, Japan
ABSTRACT
As part of JAGUARS (JApanese-German Underground Acoustic emission Research in South Africa), high-resolution tiltmeters were installed during 2007 at Mponeng gold mine, South Africa, in an attempt to study and understand the risks posed by in-mine seismic events and to subsequently use the knowledge gained to mitigate these risks. In December 2007, an M2.2 event occurred at Mponeng and was detected by the tiltmeters installed. The tilt expected for the M2.2 event is modelled through the use of numerical and analytical tools and utilizing, as input parameters, characteristics of the event such as the rupture area, the amount of slip, elastic properties of the rock, the state of stress before the event occurred, and frictional parameters of the rupture. The calculated tilt values are correlated and compared with the recorded data, and are found to be of the same order. Certain input parameters, such as the initial rupture point, are further constrained by varying them, during modelling, until the calculated and observed tilt values are approximately equal. From modelling, it can be concluded that the rupture point had to be closer to the location of the tiltmeters. In addition, possible locations acting as source areas for the observed aftertilt are determined. Further modelling still needs to be done to quantify the effects of the tunnel close to the tiltmeters and plastic deformation of the rock
Keywords: high-resolution tilt data, Mponeng gold mine, M 2.2 seismic event, analytical modeling, numerical modeling, rupture plane.
Introduction
Japanese-German research at Mponeng gold mine, South Africa
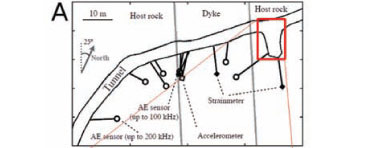
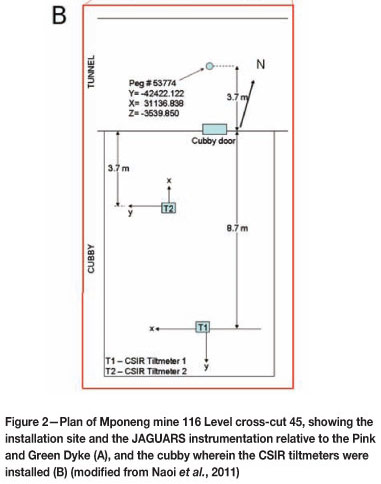
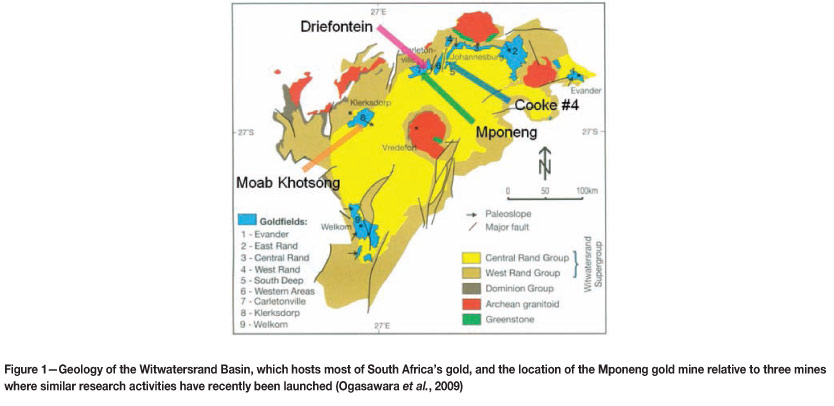
A unique experiment, called JAGUARS (JApanese-German Underground Acoustic emission Research in South Africa), involved the installation and monitoring of several sensitive seismic instruments from 2007 to 2009 at Mponeng gold mine, South Africa (Figure 1). JAGUARS was a joint project of the University of Tokyo, Tohoku University, Ritsumeikan University (Japan), GFZ German Research Center for Geosciences, Gesellschaft für Materialprüfung und Geophysik (Germany), Seismogen CC, AngloGold Ashanti Ltd., ISS International, and the Council for Scientific and Industrial Research (CSIR, South Africa) (Naoi et al., 2011). The instruments installed included acoustic emission (AE) sensors, strain meters, and an accelerometer (Figure 2a). In addition, two high-resolution tiltmeters (Figure 2b), managed by the CSIR, were also installed. The installation site was located 90 m below a dip pillar at a depth of approximately 3270 m below surface. The high-resolution tiltmeters were installed in a cubby close to a large dyke, termed the Pink and Green Dyke (Figure 2), while the other seismic sensors were installed within and around the dyke (Figure 2a).
The M2.2 event located in close proximity to the monitoring site
Data acquisition started in June 2007 and ended in January 2009, during which time an M2.2 event occurred on 27 December 2007 with the main shock less than 50 m away from the monitoring site. The event was recorded by both the CSIR tiltmeters and JAGUARS network.
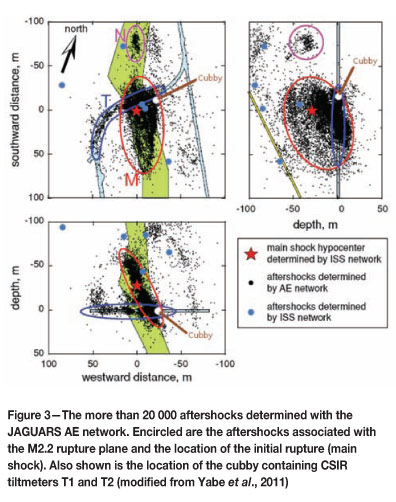
The main shock of the M2.2 event, as determined by the in-mine seismic network, lies within the dyke, and 60 per cent of the more than 20 000 aftershocks located by the AE network (Yabe et al., 2009; Naoi etal., 2011) are associated with the main rupture and are also situated within the dyke (Figure 3). This is in contrast to what is intuitively expected, where in-mine rupture or failure generally occurs along structural weaknesses, such as a dyke-quartzite (host rock) boundary. The rupture and faulting within the dyke was normal, and according to the aftershock distribution, the rupture plane had a dip angle of approximately 60° in compliance with the Coulomb failure criterion (Yabe et al., 2009). After inversion of the in-mine seismic data, one of the nodal planes of the centroid moment tensor was found to dip at 56°, which is very similar to the orientation of the aftershock cluster (Naoi et al., 2011). The aftershock distribution shows the rupture surface to be approximately 4 m in thickness and 100 m χ 80 m in areal extent. The aftershock distribution compares well with the calculated rupture radius of 75 m (Naoi et al., 2011), if the circular crack model of Sato and Hirasawa (1973) is assumed, and a calculated corner frequency of 15 Hz is used. Analysis of the individual waveforms of the event by Naoi et al. (2011) produced a seismic moment of 2.9 χ 1012 Nm. In contrast, calculations using the same data by the Institute of Mining Seismology (Hofmann et al., 2012) gave a seismic moment of 9.875 χ 1011 Nm, a corner frequency of 24.7 Hz, and a source diameter of 110 m (Brune model, Brune, 1970). Initial rupturing along the surface, as determined by the mine network, took place approximately 30 m above the tunnel and cubby (Figure 3). However, owing to the spatial distribution of the in-mine seismic network and the fact that s-waves could not be picked from the AE network, the location of the initial rupture (especially in the vertical direction) has large uncertainty (approx. 20 m). The same rupture starting point (Figure 3) was obtained when locations of aftershocks having a pattern of p-wave arrival times similar to that of the mainshock were considered representative of the location of the mainshock.
Tiltmeter installation and data
Installation and data acquisition
The two tiltmeters (Figure 2b) installed at 116 Level of the Mponeng gold mine were platform-type with 0.1 microradian ^rad) sensitivity and 800 µrad recording range. They sense a change in tilt angle by means of an electrolytic sensor that works similarly to a spirit level. When the sensors are rotated by strain increases in the rock mass, which occurs in response to approaching seismic energy, a change in electrical resistance is registered. The change in resistance is converted to a high-level DC signal that is proportional to the tilt angle. Both tiltmeters are biaxial, meaning that both contain orthogonal electrolytic level sensors that record tilt in two perpendicular directions (x and y, both relative to the horizontal plane). Tilt polarities and magnitudes observed in the perpendicular components facilitate in determining the direction and amount of maximum tilt.
The tiltmeters were installed on specially built piers coupled to the bedrock, which was exposed by removing 1 m of fractured material from the footwall. Tilt was recorded in two ways:
1. Dynamic tilt, where recording commences only when seismically triggered at a sampling rate of 10 kHz. The recording window for dynamic tilt was approximately two seconds
2. Quasi-static tilt, where measurements were taken at one-minute intervals and stored in memory.
Tilt data
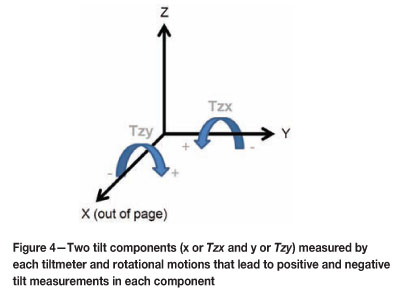
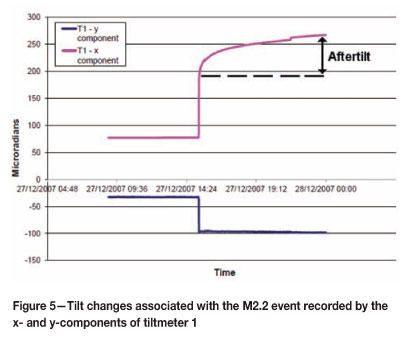
A positive tilt change measured in the y-direction relates to an anti-clockwise rotation of the rockmass when the observational direction is +x (Figure 4). In contrast, a positive tilt change as recorded by the x-component is equivalent to a clockwise rotation in the rockmass when viewed in the +y direction (Figure 4). Tilt measurements associated with the M2.2 event are shown in Figure 5. Only values for tiltmeter 1 are shown, because during the event tiltmeter 2 decoupled from the bedrock and therefore its data could not be trusted. Coseismic tilt jumps of -63.9 and 126.3 µrad were recorded by T1(y) and T1(x), respectively. T1 (x) recorded significant aftertilt, a phenomenon not previously observed with in-mine seismic events (Spottiswoode and Milev, 2006).
Modelling tools
Two modelling tools were used to try to reproduce the recorded tilt, one an analytical tool and the other a numerical package. The analytical tool consists of two formulae by which the horizontal tilt (in two orthogonal directions) due to a single displacement on a rectangular plane is calculated. The formulae form part of an entire set of closed three-dimensional (3D) analytical expressions that are used to compute the internal displacements and strains due to shear and tensile faults for both point and finite rectangular sources (Okada, 1992). Numerical calculations of the displacement field due to slip on a plane (from which tilt is derived) are performed by means of a code developed at the CSIR, called DIGS (Discontinuity Interaction and Growth Simulation ( Napier, 1991; Napier and Hildyard, 1992).
In contrast to the 3D analytical tool used, DIGS is two-dimensional (2D); however, the number of slip parameters on the rupture plane that are user-definable far exceeds the two that can be varied in the analytical case, namely the size of the rectangular source and the average slip. The use of a 2D code, apart from providing appropriate first-order approximations of tilt, is justified owing to one component of tiltmeter 1 (T1 (x)) being approximately perpendicular (within 5° to 10°) to the strike of the rupture surface (compare Figures 2 and 3). Both analytical and numerical tools compute stress and strain variations in the rock mass with the assumption that it behaves perfectly elastically (Okada, 1992; Napier, 1991).
Previously, the Map3D modelling package (Wiles, 2010), had been used to reproduce the actual M2.2 rupture and displacement while taking into account factors such as stress state and the presence of excavations and tunnels (Hofmann et al., 2012). Outputs of this earlier study were used as input to the current study. These were the average shear stress on the rupture surface (31.98 MPa), average normal stress on the surface (53.80 MPa), peak internal frictional angle before and after rupture (25° and 28.5°, respectively), and the peak cohesion (12.20 MPa). The residual cohesion after fracturing was assumed to be zero.
According to the aftershock distribution determined by the AE network (Figure 3), most of the rupture took place inside the Pink and Green Dyke. Therefore the elastic properties of the dyke dictated the amount of slip on the rupture surface. A transmission test based on the seismic velocities of the dyke was completed (Naoi et al., 2008), and a Young's Modulus of 100 GPa and Poisson's ratio of 0.26 was obtained. Using one of the classical equations of elasticity:
where G is the shear modulus (GPa), E is Young's modulus (GPa), and v is Poisson's ratio (unitless), the shear modulus of the dyke was calculated to be 40 GPa. Further calculations, using the equation:

Ma-GAD, [2] where M0 is the seismic moment of the event (Nm) and A the area of rupture (100 χ 80 m2), produced an average displacement (D) of 3 mm for the IMS-determined seismic moment and 9 mm for the moment determined by Naoi et al. (2011). The product of A and D is known as the source potency, P (Ben-Zion, 2003, p. 1860).
Results
The aim of modelling in the current study is to use the analytical and numerical tools and input variables available to reproduce and interpret the recorded tilt. From such a comparison, clarity will be gained on which faulting parameters mostly influence tilt, and, thereafter further constraints can be placed on the input parameters used during modelling.
3D modelling
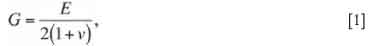
Approximating the rupture area as a plane, and assuming it has a constant dip of 60°, results in a modelling set-up where tiltmeter 1 locates 53 m down the plane, 70 m across it, and 16 m horizontally away from it along the tunnel (Figure 6).
Modelling started with the analytical formulae of Okada (1992) and using the configuration in Figure 6 with the x-component (Tzx) perpendicular and y-component (Tzy) parallel to strike of rupture. Allowing the entire rupture plane to slip 9 mm (as calculated with the seismic moment from Naoi et al., 2011) and at the same instant (infinite rupture velocity) and selecting the Young's modulus (E) and Poisson's ratio (v) stated in the previous section results in Tzy = 5 µrads and Tzx = 111 µrad (polarities of tilt vectors Tzy and Tzx are in line with the convention defined in Figure 4). As expected, because the amount of slip dictates the state of strain and is user-defined, varying E from 70 to 110 GPa results in no change in the latter tilt values. However, varying v from 0.2 to 0.3 changes Tzy from 5.28 to 5.18 µrad, and Tzx from 109 to 113 µrad. By far the greatest variation in calculated tilt is observed when varying the amount of slip. A doubling in D results in a doubling of both Tzy and Tzx. In the same way, when D is halved, Tzy and Tzx are halved as well.
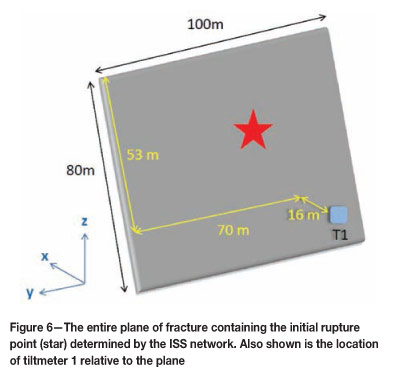
By dividing the rupture plane into 1 m2 squares and sequentially allowing each square element to slip at a time, an indication is obtained of how each element contributes to tilt at T1. Also, with such a test, the effect of the location of a tiltmeter relative to a point of rupture is observed. In Figure 7 the tilt contribution of each element (with 9 mm of slip on each element) to Tzy (A) and Tzx (B), at the location in Figure 6, is shown.

Studying the results thus far, we conclude that the factors that influence the amount of tilt most are the amount of displacement along the rupture plane and the relative distance between the 1 m2 block rupturing and the observation point. The latter factor is observed in Figure 7, and is also anticipated owing to the rapid fall-off of tilt energy with distance when compared to decreasing seismic energy with distance (Spottiswoode and Milev, 2006). Also, tilt along strike (Tzy) is as much as two orders of magnitude less than tilt perpendicular to strike (Tzx).
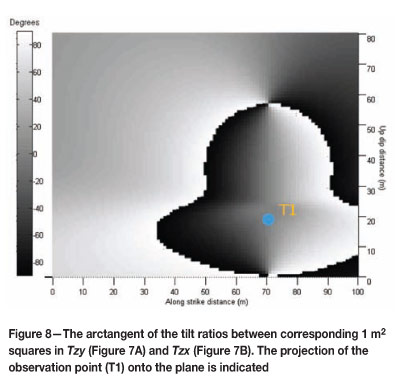
The two orders of magnitude difference between Tzy and Tzxis obtained when the sums of the tilt contributions of each 1 m2 square in the case of Tzy and Tzx, respectively, are compared. Yet, when considering each 1 m2 square in Tzy individually, and evaluating it against each corresponding 1 m2 square in Tzx, it is clear that the values of tilt are, in fact, comparable and of the same order. A suitable way of visualizing the degree of comparability between corresponding squares is to calculate the ratio, for each pair, of Tzy and Tzx, and deriving an angle from the ratio (Figure 8). Such a plot can also be used as a proxy to determine the initial point of rupturing, once the direction of tilt is computed from two orthogonal tilt measurements.
Modelling in DIGS
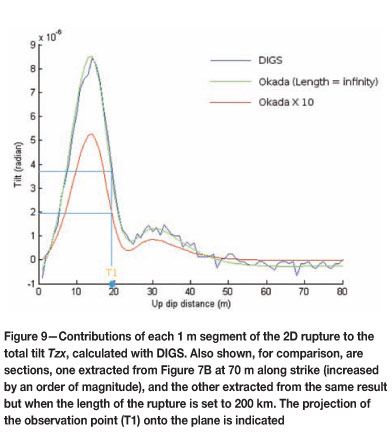
Starting with E = 100 GPa, v = 0.26, and an average displacement of 9 mm along the rupture, the same process was repeated in DIGS. Using as inputs a shear stress of 31.98 MPa, a normal stress of 53.80 MPa, peak internal frictional angles before and after rupture of 25° and 28.5° respectively, and a peak cohesion of 12.20 MPa, the value of Tzx (Tzy cannot be computed since DIGS is a 2D tool) deduced from the displacement field with D = 9 mm is 103 µrad. Again, varying E has no effect whilst changing v from 0.2 to 0.3 results in Tzx changing from 101 to 105 µrad. Also, doubling and halving D has the same effect as in the 3D modelling case. The resultant tilt contributions of each 1 m segment of the 2D rupture, each displaced by 9 mm, compared with a tilt profile extracted from Figure 7B at 70 m along strike appear in Figure 9. Encouragingly, and overall, the preliminary values of Tzx calculated with analytical and numerical tools, and their position-dependent behaviour, are comparable. However, rupturing with infinite velocity is unlikely, as attested by unequal values of modelling and data (Tzx versus T1 (x) and Tzy versus T1 (y), on the basis that T1 (x) is approximately perpendicular to the strike of the fracture surface). As a result, further testing is needed.
Extended source model
Rupturing that starts at a single point and distributes in a systematic or arbitrary manner to the rest of the final source plane is more realistic. Of the two tools used thus far, modelling where the amount of displacement varies along the rupture plane can be achieved only in DIGS, so hereinafter only modelling results from DIGS will be presented.
To allow the source potency (P = AD) to remain equal for the single rupture point scenario, and the case where rupture occurs instantaneously all along the source plane, the displacement at that initial rupture point has to be larger than 9 mm. To determine the initial displacement value, a model was constructed such that the initiation point was located at the point suggested by previous studies (Figures 3 and 6), and the normal and shear stresses applied on the plane, and internal friction angle and cohesion of the rupture, were equal to the values given in Hofmann et al. (2012). On a trial-and-error basis, a displacement value of 26 mm at the suggested rupture point was determined appropriate for the source potency to be the same as for the instantaneous rupture. As the point was moved closer to the edges of the entire rupture, the value of 26 mm had to be increased by 1-2 mm to retain the calculated source potency. With an initial displacement of 26 mm, and the displacement decreasing away from this point to zero at the edges, Tzx at the measurement location is 81 µrad, and therefore too low when compared to measurements. The value of Tzx can be increased by, for instance, decreasing the shear stress or increasing the normal stress, which will both necessitate the increase of the initial displacement and, in turn, increase tilt. However, the amounts of stress, internal friction angles, and cohesion values were very accurately determined by an independent modelling process while taking into account many relevant factors, and are therefore trusted. Even when admitting an error in the input variables of a few per cent, the calculated tilt will still remain too low when compared to observations. Also, in DIGS, a different value of tilt can be obtained when altering the angle of dilation. In spite of this, any increase in the angle of dilation from its initial value of 0° returns a decrease in the amount of tilt (for dilation angles of 10° and 20°, Tzx equals 54 and 39 µrad, respectively).
As previously determined, the two main variables contributing to tilt are the displacement on the rupture plane and the position of the observation point relative to the plane or the initial point of rupture (Figures 7 and 9). As stated, the amount of displacement, even when allowing error in other input variables, is fixed. Therefore, the only variable left, that if altered will have a significant effect on tilt, is the location of the rupture point. If Figure 9 is interpreted not as the contribution of each rupturing section to the total tilt, but rather as a measure of the location-dependent sensitivity of rupturing to the total tilt, then it is clear that if rupture starts (or only occurs) from 5 m to 40 m up-dip (especially between 6 and 20 m), the measured tilt will be much larger than if rupturing started elsewhere. The proposed initial rupture point is located at approximately 47 m up-dip, which is outside the high-sensitivity region; thus, to achieve the desired measured tilt during modelling, this point needs to be shifted lower down the rupture plane. When rupturing starts at 26 m up-dip, the resultant tilt is comparable to the measured value for Tzx, namely, 126.3 µrad (T1 (x)).
Another possibility, in which both the suggested (47 m up-dip) and recently calculated (26 m up-dip) rupture points are included, is a continuous segment, from the one point to the other, that as a whole initiated rupturing. Owing to the increase in length, and in an attempt to retain source potency, the displacement value on the segment equated to 14 mm. The tilt associated with the 21 m long segment, with D = 14 mm, is 106 µrad, which is too small compared to T1 (x).
Using the average displacement of 3 mm across the rupture plane, as determined using the IMS's seismic moment, a tilt value of 34 µrad (one-third of the value calculated with D = 9 mm) was obtained. Assuming again a single rupture point, and that the determination of displacement at that point is constrained by the constant source potency requirement, led to a displacement of 4 mm being obtained. However, during modelling with a displacement of 4 mm, no calculated tilt value approaches the real measurement, irrespective of how the rupture point is shifted around. A maximum value of only 42 µrad is achieved, and this occurs when the initial rupture point is at 14 m up-dip.
Discussion and conclusions
During the analyses of data, and due to the x-component of tiltmeter 1 aligning approximately perpendicularly to the strike of the rupture plane, much of the focus has been placed on only correlating modelled results of the perpendicular component (Tzx) with real data measured in that direction. However, in contrast to 3D modelling results, the measured component parallel to strike, T1 (y), is not small compared to its orthogonal equivalent (Tzy). The coseismic tilt jump recorded in T1 (y) is only a fraction smaller than the jump measured in T1 (x) (not two orders of magnitude smaller, as was shown during modelling); therefore, the tilt vector points in a direction somewhere in between x and y, and the vector's magnitude is larger than both 126.3 µrad (T1 (x)) and 63.9 µrad (absolute value of T1 (y)). By simple vector addition the magnitude of tilt (T1) is calculated to be approximately 143 µrad and it points in a direction 30° from the +x axis, measured clockwise. 3D modelling (Figure 8) can provide a manner in which the direction of the tilt vector can be interpreted to give added information with regard to initial rupturing. Studying Figure 8, and assuming rupturing started 20-30 m up-dip, it can be hypothesized that the mainshock occurred either 10-20 m or 70-80 m along strike, given the 30° calculated. Greater clarity on the hypothesis, and other issues raised, will be gained only by means of more in-depth 3D modelling.
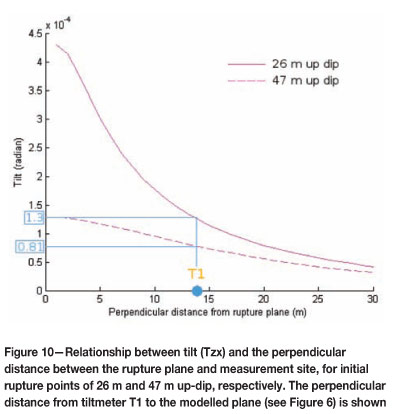
From the modelling results it was deduced that the initial rupture point had to be closer to the tiltmeter locations. However, a larger tilt could also have been obtained by moving the entire rupture plane closer to the tiltmeter locations, while the location of the initial rupture remains unchanged. Indeed, the rupture surface, as determined by the AE network, is in fact a slab with thickness 4 m rather than a surface. During modelling, the centre of this slab was taken as the plane of rupture; therefore, realistically, the true rupture surface could have been located a few metres closer to the tiltmeters. Figure 10 highlights the dependence of tilt magnitude on the perpendicular distance between measurement sites and rupture surface. It is clear that for an initial rupture at 47 m up-dip the dependency is less pronounced than in the case where the mainshock locates at 26 m up-dip. In fact, even when the measurement sites are as close as 2 m from the rupture plane and rupturing starts at 47 m up-dip, the modelled tilt barely approaches the observed T1 (x) value of 126.3 µrad (Figure 10). When rupturing occurs at 26 m up-dip, the increase in tilt with decreasing perpendicular distance is more evident; for example, for a decrease from 14 m to 12 m (that is, half the thickness of the rupture volume) tilt increases by approximately 20 µrad. Such an increase in tilt still facilitates an initial rupture point at approximately 26 m up-dip (given the recently calculated larger tilt of approximately 143 µrad), but, once again, rules out rupturing that initiated at approximately 47 m up-dip. Thus, we conclude, with certainty, that initial rupturing occurred closer than was previously suggested (Naoi et al.2011), but still within the error (approximately 20 m) of that earlier calculation.
Determining the reasons for the initial rupture point locating lower down the final rupture surface (or for that matter in the location where it was originally calculated to be) is beyond the scope of the current topic (and the resolution of the data), but it is still an important research aim. Again, 3D stress and strain modelling of the source (that is more complex than the plane suggested in the current study) and regions surrounding it is a recommended research topic. In addition, further research should quantify the effects of structures such as the surrounding tunnels during modelling. Also, another possibility is the consideration of two or more separate asperities, activated at different times. However, the presence of numerous asperities or rupture points needs to be firstly confirmed by thorough analysis of the seismic data.
Not much attention has been given to the noticeable aftertilt observed in T1 (x) (Figure 5). The cause of aftertilt is still unclear, but it is usually considered a result of either coseismic or aseismic expansion of the seismogenic zone (rupture surface), or coseismic or aseismic activity within the original seismogenic zone that follows the main event. If the seismogenic zone expanded coseismically or aseismically, and taking into account the amount of aftertilt recorded in T1 (x) (approx. 70 µrad), it is most probable that it expanded to the bottom and bottom right of the seismogenic zone. The sensitivity of tilt to any other boundary of the zone is too low to result in the observed aftertilt (Figure 7). Another possibility is activity occurring within the identified zone after the main event, especially in the bottom right corner of the zone. where a dense collection of aftershocks is present (Figure 3).
Acknowledgements
The authors would like to express their gratitude to the SATREPS project 'Observational studies to mitigate seismic risks in mines' funded by JST-JICA Science and Technology Research Partnership for Sustainable Development for their financial support and encouragement. We wish to express our sincere appreciation to the rock engineering staff of the Mponeng gold mine for their assistance and cooperation.
References
Ben-Zion, Y. 2003. Key formulas in earthquake seismology. International Handbook of Earthquake and Engineering Seismology. Lee, W.H.K., Kanamori, H., Jennings, P.C., and Kisslinger, C. (eds.). Appendix B. International Geophysics Series Volume 81B. Academic Press. London. pp. 1857-1875. [ Links ]
Brune, J.N. 1970. Tectonic stress and the spectra of seismic shear waves from earthquakes. Journal of Geophysical Research, vol. 75, no. 26. pp. 4997-5009. [ Links ]
Hofmann, G., Ogasawara, H., Katsura, T., and Roberts, D. An attempt to constrain the stress and strength of a dyke that accommodated a ML 2.1 seismic event. Proceedings of the Second Southern Hemisphere International Rock Mechanics Symposium, Sun City, South Africa, 15-17 May 2012. Southern African Institute of Mining and Metallurgy. Johannesburg. pp. 435-450. [ Links ]
Naoi, M., Nakatani, M., Yabe, Y., Kwiatek, G., Igarashi, T., and Plenkers, K. 2011. Twenty thousand aftershocks of a very small (M 2) earthquake and their relation to the mainshock rupture and geological structures. Bulletin of the Seismological Society of America, vol. 101, no. 5. pp. 2399-2407. [ Links ]
Naoi, M., Nakatani, M., Yabe, Y., Philipp, J., and JAGUARS-group. 2008. Very high frequency AE (<200kHz) and micro seismicity observation in a deep South African gold mine - Evaluation of the acoustic properties of the site by in-situ transmission test. Seismological Research Letters, vol. 79, no. 2. p. 330. [ Links ]
Napier, J.A.L. and Hildyard, M.W. 1992. Simulation of fracture growth around openings in highly stressed, brittle rock. Journal of the South African Institute of Mining and Metallurgy, vol. 92, no. 6. pp. 159-168. [ Links ]
Napier, J.A.L. 1991. Energy changes in a rockmass containing multiple discontinuities. Journal of the Southern African Institute of Mining and Metallurgy, vol. 91, no. 5. pp. 145-157. [ Links ]
Ogasawara, H., Durrheim, R.J., Nakatani, M., Yabe, Y., Milev, A., Cichowicz, A., Kawakata, H., Moriya, Η and JST-JICA SA research group. A Japanese -South African collaboration to mitigate seismic risks in deep gold mines. Proceedings of the First Hard Rock Safe Safety Conference, Sun City, South Africa, 28-30 September 2009. Southern African Institute for Mining and Metallurgy. Johannesburg. pp. 115-134. [ Links ]
Okada, Y. 1992. Internal deformation due to shear and tensile faults in a half-space. Bulletin of the Seismological Society of America, vol. 82, no. 2. pp. 1018-1040. [ Links ]
Sato, T. and Hirasawa, T. 1973. Body wave spectra from propagating shear cracks. Journal of Physics of the Earth, vol. 21. pp. 415-431. [ Links ]
Spottiswoode, S.M. and Milev, A.M. A study of mine stability using records of ground tilting. Proceedings of the 41st US Symposium on Rock Mechanics, Golden Rocks, Colorado, 17-21 June 2006. American Rock Mechanics Association. Virginia. ARMA/USRMS 06-1168. [ Links ]
Wiles, T. 2010. Map3D User's Manual. Mine Modelling Pty Ltd. Australia. [ Links ]
Yabe, Y., Philipp, J., Nakatani, M., Morema, G., Naoi, M., Kawakata, Η., Igarashi, T., Dresen, G., Ogasawara, Η., and JAGUARS-Group. 2009. Observation of numerous aftershocks of an Mw 1.9 earthquake with an AE network installed in a deep gold mine in South Africa. Earth Planets Space, vol. 61. pp. e39-e52. [ Links ]

