


Services on Demand
Article
 English (pdf)
 Article in xml format
 Article references
Indicators

Related links
-
 Cited by Google
 -
 Similars in Google
Share

 Permalink
Journal of the Southern African Institute of Mining and Metallurgy
On-line version ISSN 2411-9717
Print version ISSN 2225-6253
J. S. Afr. Inst. Min. Metall. vol.113 n.6 Johannesburg Jun. 2013
An algorithm to construct industry cost curves used in analysing cash cost performance of operations for selected minerals in South Africa
T. TholanaI; C. MusingwiniI; G. NjowaII
ISchool of Mining Engineering, University of the Witwatersrand, South Africa
IIVenmyn Rand (Pty) Limited, Sandton, South Africa
SYNOPSIS
South Africa hosts some of the world's largest known resources and reserves of minerals that are strategically important to the global economy. The country's mining industry contributes significantly to the national economy in terms of gross domestic product, export earnings, corporate tax receipts, remuneration earnings, and employment. Platinum, gold, and coal are significant minerals because they make the largest individual contributions to these economic indicators. Several factors impact the cash cost performance of operations that mine these minerals, thus affecting the future sustainability of these operations, which are generally 'price-takers'. It is therefore important that the cash cost performance of operations for these key minerals is analysed. Commercially available industry cost curves can be used for such analysis. However, some companies may not be able to afford to purchase these curves. This paper presents a simple Microsoft Excel® algorithm for constructing the curves. It also demonstrates how the constructed industry curves were used to analyse the cash cost performance of South African mining operations for the three selected minerals for the period 2007 to 2011, which included the 2008 global financial crisis. The analysis revealed that the operations were affected by several global and local factors during the review period. The work reported in this paper is part of an MSc research study at the University of the Witwatersrand.
Keywords: cost curve algorithm, economies of scale, cash cost performance.
Introduction
South Africa is a major mining country that hosts some of the world's largest mining companies and has a comparative advantage in terms of significant mineral resource endowments. In 2011 its in situ mineral resources were estimated to be worth about US$2.5 trillion and its non-energy mineral commodities had an economically exploitable life of more than a century (Department of Mineral Resources of South Africa, 2011). According to the Department of Mineral Resources of South Africa (2010), the country hosts the world's largest known resources and reserves of gold at 13%, platinum group metals (PGMs) at 88%, and chrome and manganese ore at 72% at 80% of global totals, respectively. The country is the world's fifth largest producer of gold and diamonds, the world's largest producer of PGMs, manganese ore, chrome ore, and vanadium. It is also a significant exporter of manganese ore and coal. These minerals are strategically important to the global economy either as precious or industrial minerals.
Since its establishment, the South African mining industry has contributed significantly to the economic development of the country either directly or indirectly through multiplier effects. For example, in 2010 the sector accounted directly for 8.6% of the gross domestic product (GDP), 50% of total merchandise exports, 13% of direct corporate tax receipts, and directly employed 498 141 people (Department of Mineral Resources of South Africa, 2010). Employment in the industry accounts for approximately 6% of the country's total formal employment (Mining Qualifications Authority, 2009). In the mining sector, platinum, gold, and coal are the minerals making the largest individual contributions to these national economic indicators. According to the Chamber of Mines of South Africa (2010) the following were the rankings of these minerals in the mining sector:
In terms of sales value PGMs ranked first, followed by coal, then gold
Based on the above economic significance of gold, platinum, and coal, it was prudent to analyse the cash cost performance of operations producing these minerals and ascertain the continued sustainability of the operations specifically in terms of cash cost performance against challenges that threaten the sector's performance. It is important to consider cash operating costs because mining operations are 'price-takers', and in a perfect market no single company can influence commodity prices. The company operating at the lowest cash cost is therefore the most competitive in surviving profit margin squeezes when commodity prices decline. The strategic importance of the mining industry to both the global and national economies, and the challenges that threaten the sector's future sustain-ability, required that an analysis be done on the cash cost performance of operations that mine these three key minerals.
In order to undertake this analysis, industry cost curves were constructed for mining operations for the three commodities for the period 2007 to 2011. This period was selected because it provides a 5-year medium-term trend analysis including a perspective on how the industry performed before, during, and after the 2008 global financial crisis. The wildcat wage strikes experienced by most mines in the South African mining industry from August 2012 crippled production in 2012 and will have an impact of escalating costs post this study. The work reported in this paper is part of an MSc research study at the University of the Witwatersrand.
Financial performance indicators
Several indicators can be used to analyse the financial performance of mining operations and companies. However, the focus in this paper is on cash cost performance, for four main reasons. Firstly, cash cost is the main value lever that companies can use to maximize profitability, since value drivers such as price are beyond the control of mining companies. Secondly, cash costs indicate the capacity of operations to generate economic value added (EVA). EVA is generated when there are excess earnings remaining after all cash costs, taxes, and the appropriate capital charge have been deducted. Consequently, operations with low cash costs are more likely to generate higher EVAs than those with high cash costs. Thirdly, financial performance indicators such as share price, market capitalization, and earnings per share are meaningfully comparable only when companies under analysis all have their operations in the same country and are of a similar economic scale of production. Lastly, in annual reports, financial indicators are often consolidated for the whole company, such that if a company has operations in different countries it is not possible to determine the specific contribution of operations in one particular country to such financial indicators. For example, comparing the share prices for Gold Fields and Gold One directly may be misleading because Gold Fields derives about 50% of its production from outside of South Africa, while all of Gold One's production comes from South African operations.
Industry cost curves and their uses
CHR Metals Limited (2005) defined a cost curve as a graphical plot of cumulative production for individual mines along the horizontal axis (or x-axis), ranked according to unit cash cost of production on the vertical axis (or y-axis), as shown in Figure 1. The cost curve shows in graphical form the comparative operating cost performance of all operations in the industry sample and provides the cumulative supply by producers from the sample (World Mine Cost Data Exchange Inc., 2012). Industry cost curves can be constructed and analysed at a company or country level to facilitate comparison on a national, regional, or international level. They also facilitate the identification of high- and low-cost producing countries or regions, hence informing company decisions on where to invest.
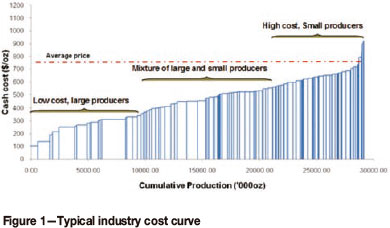
Figure 1 illustrates that large-capacity producers tend to be concentrated in the lowest quartile of the cost curve, which is from zero to about 7 500 000 oz along the horizontal axis. Low-capacity producers tend to be concentrated in the upper quartile, which is from about 22 500 000 oz to 30 000 000 oz along the horizontal axis. This concentration can be explained by the principle of the economies of scale. Mining Man Newsletter (2012) explained the principle of economies of scale as the concept that as production increases, the unit cost of production tends to decrease, although as Rudenno (2009) clarified, the larger the operation's production the higher the absolute cost. The principle of economies of scale is easily understood by considering fixed and variable costs. In the mining business, fixed costs (especially labour and equipment) contribute significantly to the total cost of production, in some cases as much as 60% of total operating costs. Therefore, when more tons are produced by the same labour and equipment, the denominator by which fixed costs have to be divided by becomes larger, leading to a lower unit cost. Additionally, smaller producers do not always have the same overheads as larger producers and also do not always service the full value chain, therefore their unit costs may be relatively lower than for larger producers, despite the principle of economies of scale. Unit variable costs are costs that are incurred as material inputs per unit of production and tend to be fairly constant, but their absolute value increases with increasing production volume. Ideally, fixed costs should be as low as possible, implying lower ratios of fixed costs to absolute variable costs, which is the reason why in economic downturns companies tend to rationalize and downsize on overheads.
According to Jaguar Mining (2010), cost curves are a useful indicator to investors and management as they provide:
- A measure of the mine's cash margin per ton or ounce by comparison of the cash operating cost per ton or ounce to the commodity price
- A trend in costs as the mine matures
- An internal benchmark of performance to allow for comparison against other mines in the industry.
Cost curves can also be used:
- To benchmark new projects against existing operations internationally, especially during feasibility studies to see how the estimated operating costs of the new project compare with costs of competitors already existing in the industry
- As an investment decision tool during mineral project evaluation. An operation in the lowest quartile of the cost curve is likely to offer a competitive price to potential investors. Fawcett and Taylor (1985) mentioned that financial institutions are more likely to lend money to a project located in the lowest quartile of the cost curve than to one in the upper quartile
- In developing company strategy and monitoring performance to achieve the company's strategy
- In financial analysis of mergers and acquisitions
- As an indicator of the quantum of production that can be supplied at a given commodity price, as they show which operations are at risk of closing down should commodity prices become depressed at or below the given price for prolonged periods.
Basis of reporting of costs and cost curve construction
Only cash operating costs were used to construct cost curves in this study. Cash costs are costs that represent actual monetary outflow, including stripping costs in open-pit mining, direct mining and processing costs, general and administration (G&A) costs, and other onsite charges and royalties. Off-site costs and non-cash costs such as depreciation and amortization do not directly represent such outflows but are permissible deductions from revenue, the sole impact of which is to reduce the income tax liability. Ideally, cost curves should be constructed from cash operating costs as these costs generally determine the future actions of new or existing operations (Torries, 1998). For example, high cash costs may require capital costs to be incurred in procuring new technology to reduce cash operating costs. Additionally, cash costs are important because a mining company is considered to be financially viable if it is solvent in the short term by being cash positive, ensuring long-term profitability. Another reason is that total cash costs of production can be estimated fairly accurately, so that a reliable database can be developed for the construction of cost curves (Gentry and O'Neil, 1984).
Cash costs used in this study are exclusive of capital expenditure; development, and stay-in-business capital expenditure. Such other costs that are capitalized and excluded from the analysis include exploration expenditure to extend the mineral deposit already being mined and costs related to property acquisitions and mineral and surface rights. These costs were excluded because some companies do not report them on a per-mine basis. They are rather reported as a consolidated figure for the whole company, such that estimating these costs for each mine is prohibitive.
In the analysis of gold mines, production in ounces and unit cost per ounce produced were used. For platinum mines, production in tons milled and cost per ton were used for the analysis. This is because unlike gold mines, not all platinum mines are vertically integrated. Some junior platinum mining companies without smelters and refineries produce only concentrate and matte and not the final PGM product. This means that these companies have different assessment points on the cost structure and report at different stages of the mining value chain - either concentrate, matte, or refined PGMs. Comparing platinum operations basing on cost per ounces produced was also impractical because platinum producers have different prill split reporting preferences: typically as 4E or 6E. Musingwini (2009) described the prill split system as used in platinum mining and mentioned that the prill split is classified as 4E (alternatively 3E+ Au) if it reports on the elements platinum (Pt), palladium (Pd), rhodium (Rh), and gold (Au), whilst a 6E prill split (alternatively a 5E+Au prill split) reports on the elements Pt, Pd, Rh, iridium (Ir), ruthenium (Ru), and Au. In addition, platinum operations could not be compared on cost per platinum ounce produced because platinum is mined as part of a basket of metals, with each metal being priced differently. Also, base metals, which are produced as a by-product, have their own individual prices. Accordingly, the tons milled was selected as a meaningful common basis for comparison to cater for junior miners and the basket of metals produced as end product, since all companies report on tons milled and unit cost per ton milled. However, although the cost analysis of milled production providing a view of a company's performance, it disregards the effect of grade, which is a key value lever.
In the analysis of coal mines, industry cost curves were constructed at company level only. This is because most coal companies do not report operating costs for individual mines, which made the construction of industry cost curves for coal at the mine level impractical. Production for each company was the sum of the company's individual mines in tons treated, while the unit operating cost was calculated as a quotient of operating cost (revenue less operating profit) and production (tons processed).
Cost curve algorithm
Some consulting companies such as Minecost (www.minecost.com) found a niche market in compiling and selling cost curves. The cost curves from these companies are easily affordable to large corporate mining companies and consulting firms. However, for smaller companies that cannot afford to purchase these curves nor subscribe to the companies providing the cost curve service, it may be helpful to use information from annual reports published by publicly listed companies and freely available from the public domain. This paper presents a simple Microsoft Excel®-based algorithm for constructing such cost curves. The algorithm uses the concept of error bars as explained in the steps described below:
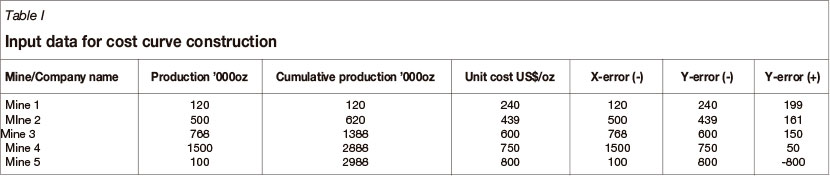
1. Compile raw data (production in tons treated or ounces produced, and cash costs per ounce produced or per ton treated) from company annual reports. For companies that do not explicitly report cash costs, this data can be calculated from revenue, operating profit, and reported production data. Sort the data on mines or companies in ascending order of unit cash costs and use the data to compile a table similar to Table I
The columns in Table I can be read from left to right as:
Mine/company name The name of minen or companyn
Production Production in tons treated or ounces produced by minen or companynCumulative production Cumulative production is calculated by adding the production of a particular minen or companyn to the total production of the previous mines or companies in the list. Mathematically, cumulative production = (production of minen) + (production of minen-1) + ...+ (production of mine1). The cumulative production forms the x-axis of the cost curve
Unit cost Unit cost of minen or companyn as reported in (or calculated from) the annual report. This forms the y-axis of the cost curve
X-error (-) Production of minen or companyn
Y-error (-) Unit cost of minen or companyn
Y-error (+) Unit cost of minen+1 or companyn+1 less the unit cost of minen or companyn, respectively.
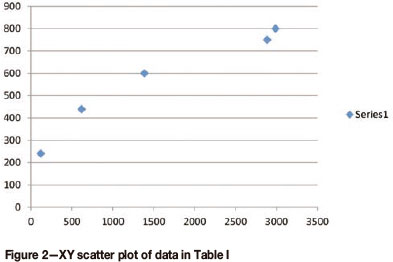
2. Use the Microsoft Excel chart wizard to create XY scatter points, from the data range of cumulative production for x-axis and unit cost for y-axis, to obtain a figure similar to Figure 2, which at this stage does not have axes titles
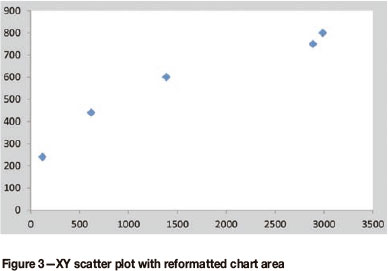
3. Delete the 'Series 1' legend and gridlines. Format the plot area and chart area with any fill colour of choice as shown in Figure 3
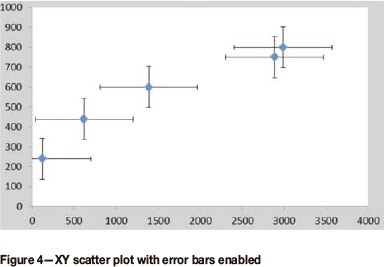
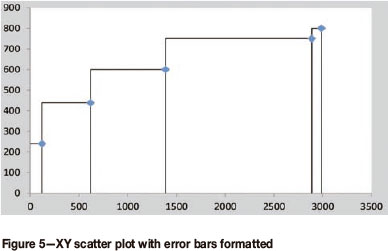
4. Click inside the plot area. On the 'Layout' menu tab, click the 'Error bars' tab and select 'Error bars with standard error'. Right-click on the x-axis, format the axis, and under 'Axis options' set 'Minimum fixed' to zero to obtain a chart similar to Figure 4
5. Select any one of the horizontal error bars in the plot area, right-click on it then select 'Format error bars' and set the following parameters for the horizontal error bars:
6. Select any one of the vertical error bars in the plot area, right-click on it, then select 'Format error bars' and set the following parameters for the vertical error bars:
7. Select the markers on the bars, right-click on them and select the option 'Format data series'. Under 'Marker options' format 'Marker type' to none, then close the dialogue box
8. Under 'Layout' menu tab, the cost curve can be formatted to one's own preferences
9. To label the bars according to the corresponding mine or company names, download Rob Bovey's XY Chart Labeller (available from http://appspro.com) and run the installation script. Close the Microsoft Excel file after installing the XY Chart Labeller. On re-opening the file the 'XY Chart Labeller' menu tab will appear on the main menu. Click on the tab and a dialogue box appears prompting the user to select the cells with the mine or company names. On completion of the labelling process, one will obtain a cost curve similar to the one indicated earlier in Figure 1.
The key principle in constructing industry cost curves is to identify and treat various cost items of each company consistently so as to compare similar items; otherwise the analysis will be inconsistent and unreliable. Hence, caution should be taken in unscrambling data from the annual reports.
A list of gold, platinum, and coal mining companies listed on the Johannesburg Securities Exchange (JSE) or listed elsewhere but with operations in South Africa was compiled. Annual reports for these companies for the 5-year period from 2007 to 2011 were obtained from the public domain and a database of producing mines was created. Owing to the way information is presented in annual reports, it was possible to construct cost curves at both the mine level and the company level for gold and platinum operations; while for coal, only company cost curves could be constructed. On the gold and platinum cost curves different font colours were used on mine names to differentiate mines belonging to different companies, while mines belonging to the same company shared the same colour.
Cash cost curves for gold mines and companies
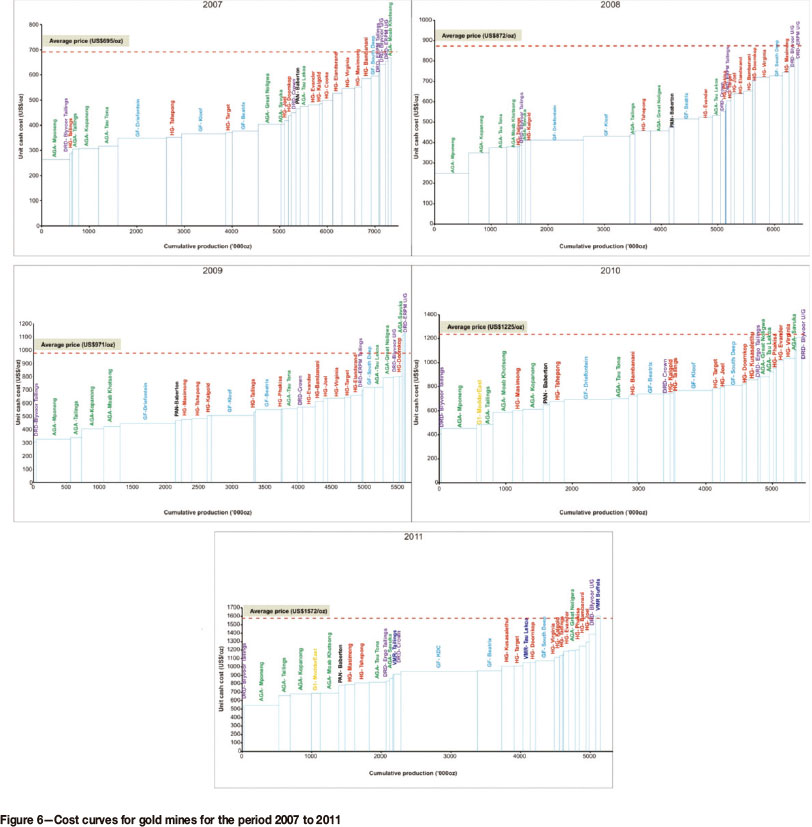
The listed gold mining companies that were considered are AngloGold Ashanti (AGA), DRD Gold (DRD), Harmony Gold (HG), Gold Fields (GF), Gold One (Gold 1), Pan African Resources (PAN), and Village Main Reef (VMR). Figure 6 shows the cash cost curves for the gold mines for the period 2007 to 2011. The average gold prices published by Kitco (2012) for the different years are indicated as the red dotted lines in Figure 6.
It is evident from Figure 6 that DRD's two underground mines, East Rand Proprietary Mines (ERPM) and Blyvooruitzicht (Blyvoor), and AGA's Savuka mine had cash costs that were almost equal to or exceeded the average gold price over the 5-year period. If other non-cash costs are considered then these operations were not generating any EVA. Some reasons, though not exhaustive, can be advanced to explain the relative positions of these mines on the cost curve. ERPM was one of the highest unit cash cost producers mainly because the pumping infrastructure was not coping with rising underground water levels and the mine was eventually placed under care and maintenance in 2009 (DRD Gold Limited, 2009). Blyvoor is a mature deep-level underground mine with a cost structure dictated by age and depth. In 2007, Savuka was reported to be the deepest mine is the world, which would naturally make it a high-cost operation, and was most prone to seismic events. The mine was affected by a serious seismic event in May 2009 which lowered its production capacity. In 2008, before the seismic event, Savuka was in the first quartile producing 66 000 ounces. However, after the seismic event in 2009 it slipped to the fourth quartile in 2009 and produced only 22 000 ounces, but as it ramped up production in 2010, it moved down the curve from the fourth to the second quartile in 2011. This shows that as a mine's production decreases its unit cost increases, confirming the concept of economies of scale since fixed costs will be covered by a larger production volume leading to lower cost per unit of production. Beyond 2011, Savuka can therefore, be expected to remain in the second quartile where it was before the 2009 seismic event.
The following general observations and associated explanations can be made from Figure 6:
- Merging infrastructure to reduce overheads and maintain production. For example, the merging of Kloof and Driefontein mines to form KDC by Gold Fields is a case in point (Gold Fields Limited, 2011)
- A cost restructuring and people transformation programme at Harmony Gold's Masimong and Tsephong mines (Harmony Gold Limited, 2008) that resulted in these mine being the company's lowest unit cost mines in South Africa since 2009
- Revitalizing mines by mining reefs below infrastructure to maintain production and extend the life of mine, for example, Harmony Gold's Kusasalethu, Doornkop, and Phakisa mines' expansion projects (Harmony Gold Limited, 2011)
- Full mechanization of operations to improve safety and productivity. The mechanization of flat-end development by Gold Fields is a case in point (Gold Fields Limited, 2011).
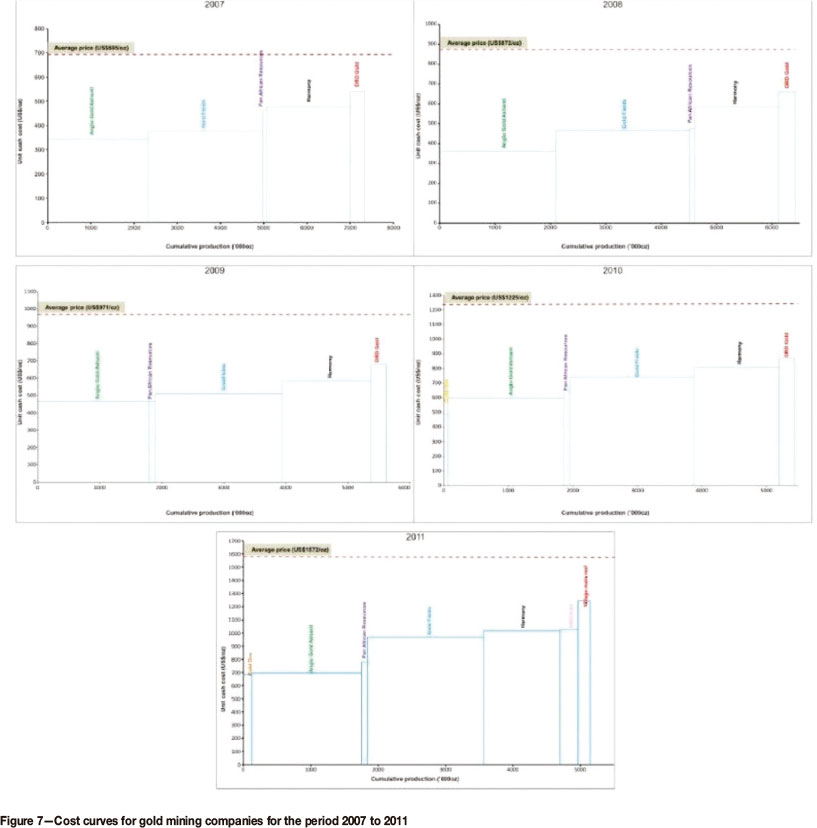
As a result of challenges facing the mining industry, the global competitiveness of South Africa's gold mining industry is declining. From the seven gold mining companies under analysis, it was shown that total production declined by 30% from 7 340 000 ounces in 2007 to 5 147 000 ounces in 2011. This is against a general increase in gold price from an average of US$695 per ounce in 2007 to an average of US$1572 per ounce in 2011 (Kitco, 2012). Notably due to these economic and technical challenges, South Africa has dropped from being the world leader in gold production in the 1970s to fifth position in 2010. Company cost curves were constructed from total production and weighted averages for unit cash cost from the operating mines in the analysis, and these are depicted in Figure 7.
From Figure 7 it can be noted that a company's total production does not significantly determine its position on the industry cost curve. Small and junior companies are not always in the high cost quartile of the curve. Junior companies such as Pan African Resources and Gold One are lower cost companies compared to Gold Fields and Harmony Gold, which are big producers; partly because the large companies have large corporate offices with larger executive staff complements than the smaller companies. These corporate head offices incur high fixed costs through high administrative costs and executives' salaries. Also, Harmony Gold tends to be a relatively high unit cost company because the company's business model has revolved around restructuring marginal and aging deep-level mines acquired from other companies. Looking into the medium term, DRD is expected to move down the cost curve because of its decisions in 2012 to dispose of Blyvoor underground mine to Village Main Reef, cease operations at ERPM underground mine, and concentrate on tailings retreatment operations. Already, the company reported a 53% increase in operating profit in August 2012, partly because of this overhauling of its operations (Business Report, 2012).
Cash cost curves for platinum mines and companies
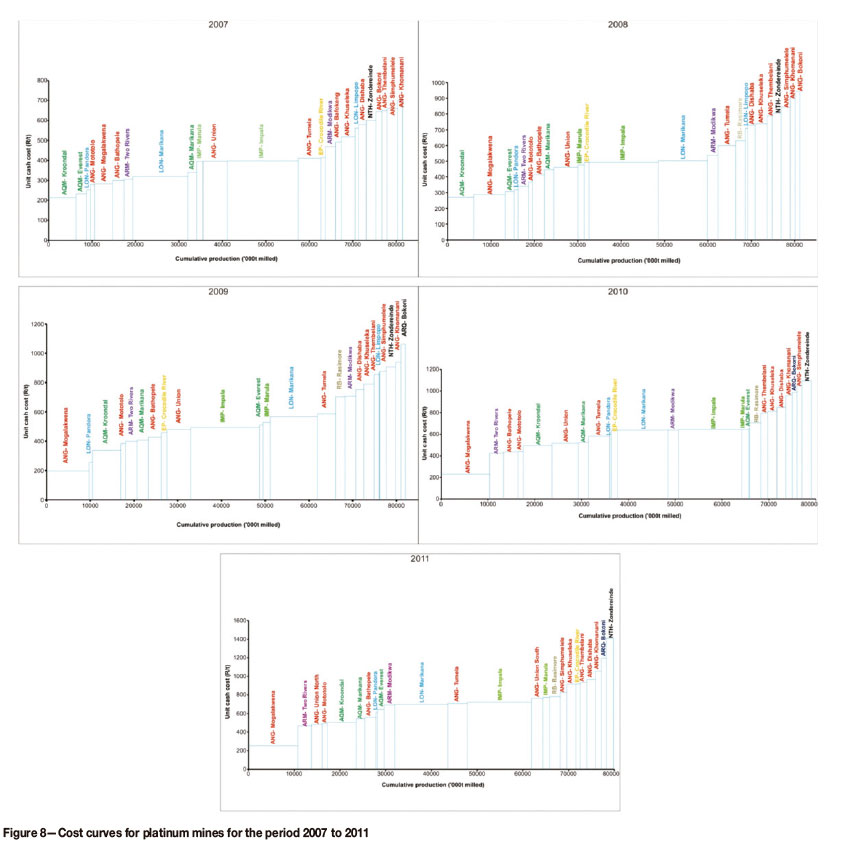
Figure 8 shows the cost curves for platinum mines for the period 2007 to 2011. It was not possible to include the average platinum price per ounce for platinum operations as was done with gold price per ounce for gold operations, because the analysis was based on tons milled and associated unit cost as previously explained. The companies with mines under analysis are African Rainbow Minerals (ARM), Anglo American Platinum (ANG), Aquarius Platinum (AQM), Eastern Platinum (EP), Anooraq Resources (ARQ), Impala Platinum (IMP), Lonmin Platinum (LON), Northam Platinum (NTH), and Royal Bafokeng Platinum (RB).
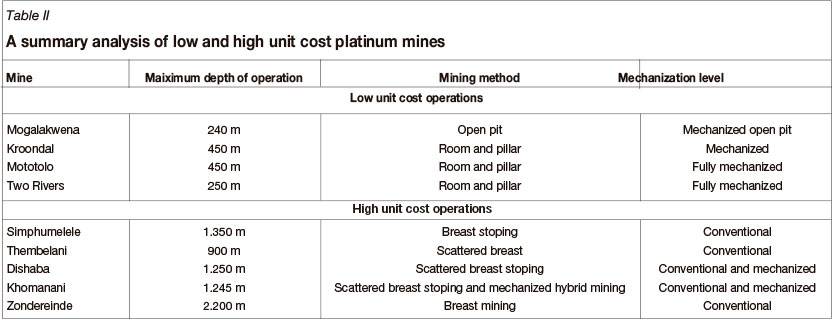
It is evident from Figure 8 that platinum mines with low production capacities tend to occupy the upper quartiles of the cost curve, while mines with high production capacities dominate the lower quartiles. Again, this trend can be attributed to the principle of economies of scale. It can also be seen that Mogalakwena, Two Rivers, Mototolo, and Kroondal mines are some of the low unit cost operations, while Zondereinde, Bokoni, Khomanani, Dishaba, Thembelani, and Simpumelele mines are among the high unit cost operations. Table II indicates why these mines are spread across the cost curve.
Table II shows that in addition to production, depth of operation, mining method, and level of mechanization also affect the cash cost performance and competitive position of platinum mines on the industry cost curve. Additionally, several other factors affected the cash cost performance of platinum mining operations and their competitive positions on the cost curve. These factors, as noted from the respective company annual reports, are:
The preceding factors collectively affected in a negative way the platinum mining sector's productivity and profitability from 2007 to 2011. The nearly stagnant platinum prices experienced in 2012 also contributed to ongoing uncertainty around the short-term profitability of the sector.
From Figure 8 it can be seen that at least 50% of Anglo Platinum's mines are in the upper quartiles of the industry cost curve, which is why the company started implementing operational review processes in 2012 to ensure that the profitability of these mining operations improves. These measures to improve profitability include mechanization of narrow-reef operations and unbundling of big mines into stand-alone operations. The aim of these measures is to improve efficiency and productivity, and ultimately reduce unit costs.
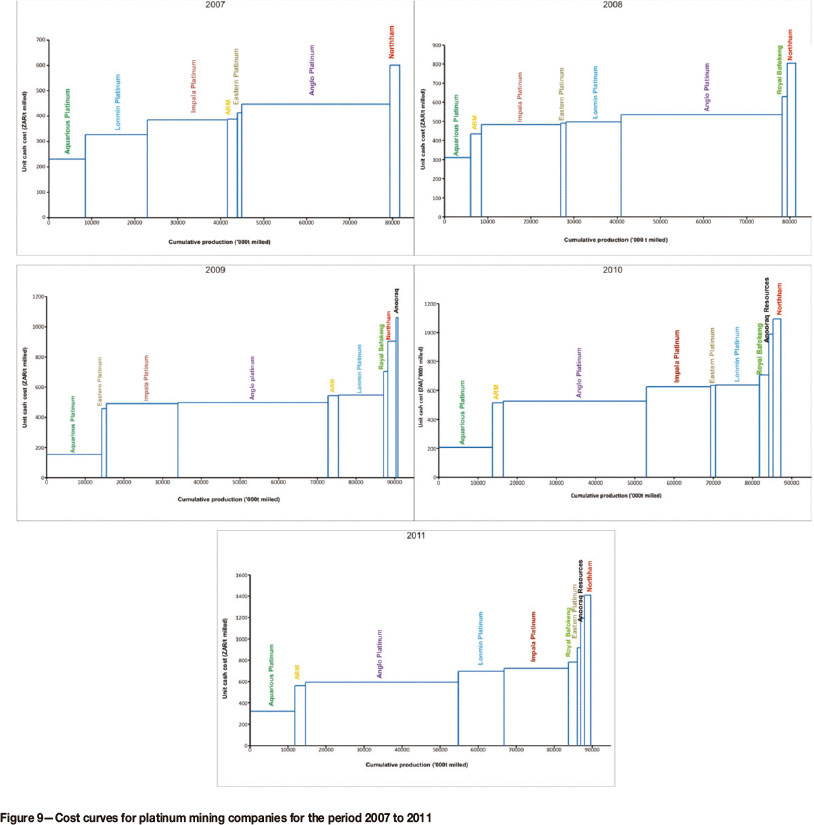
Company cost curves were constructed from total production in tons milled and weighted averages for unit cash cost from the operating mines in the analysis. These are depicted in Figure 9.
Figure 9 shows that over the period 2007 to 2011, Northam was the highest unit cost producer relative to its peers. This could be attributed to the fact that it operates the deepest platinum mine in South Africa. The impact of increasing mining depth in driving up unit costs in the platinum mines is similar to that observed in the analysis of gold mines. The progressive movement of Anglo Platinum down the cost curve for the period under review can be attributed to its initiatives to unbundle large mines into stand-alone mines, the implementation of mechanization, and down-sizing of its head and regional office staff complements by 1 150 people between 2008 and 2009 (Anglo American Platinum Limited, 2009). The review measures seem to have been prompted by the 2008 global financial downturn, which severely affected the rest of the platinum mining industry. This was because just before the global financial crisis at the beginning of 2008, the price of platinum, which had risen to over US$2 300 per ounce, dropped to below US$800 per ounce within six months, consequently squeezing the profit margins of platinum mining companies.
Cash cost curves for coal operations
Coal mining companies did not report cost data per individual mine but on a consolidated group basis. This made the determination of unit cost per individual mine and the construction of cash cost curves for coal mines impractical.
As a result, only cost curves at a company level were constructed from 2007 to 2011 (Figure 10) with some limited analysis. The coal price depends on the quality of the coal produced to suit customer specifications, such as the calorific value, ash content, and volatiles content. Therefore, the average coal price per ton could not be shown on the cost curves due to price variations from company to company and proportions of different coal products sold.
It was noted that the coal mining sector is characterized by small private companies emerging from Black Economic Empowerment (BEE) initiatives. Consequently, annual reports for the small private companies are not available in the public domain, hence their exclusion from the analysis.
Figure 10 shows that the three companies with high production capacities occupy the lower quartiles, while the three other companies with low production capacities occupy the upper quartiles of the cost curves. Again, this trend can be attributed to the principle of economies of scale. Analysis shows that there has been a general decline in total production from these companies since 2007, which impacted on the unit cost performance of most operations. This is mainly because of the 2008 global financial crisis, which resulted in some operations down-scaling production and the declining coal resources in the prominent Mpumalanga coalfield.
Conclusion
This paper has presented a simple Microsoft Excel-based algorithm for constructing industry cost curves. The algorithm can be used by individuals or small companies that cannot afford to purchase or subscribe to commercially available industry cost curves. The paper has demonstrated that industry cost curves are a useful analytical tool to provide insight into the cash cost performance of mining operations, since trends or anomalies can easily be identified. Cost curves are important because mining operations are generally 'price-takers', therefore unit cash costs act as a key differentiator of competitiveness and sustainability of operations. The paper also demonstrated that industry cost curves are most useful when comparing fungible mineral commodities where companies receive the same or similar prices for their products, otherwise cost curve analysis is done by considering tons milled and utilizing the associated cost.
From the cost curves, low and high unit cost production mines can be distinguished and mines can be easily compared. The impact of cost interventions by a mining operation or mining company is seen in its movement along the cost curve. The analysis revealed that the cash cost performance and competitive position of a South African mine on the industry cost curve was affected mainly by its production capacity, depth of operation, head grade, production profile, level of mechanization, mining method, industrial strikes, the DMR's Section 54 safety stoppages, and cost-cutting measures.
References
Anglo American Platinum Limited. 2009. Anglo Platinum Limited Annual Report 2009. http://www.angloplatinum.com/investors/reports/2009.asp [Accessed 17 January 2012] [ Links ].
Business Report. 2012. DRDGold results shine on strong gold price, overhaul. Business Report, Wednesday, 29 August 2012. [ Links ]
Chamber of Mines of South Africa. 2010. Facts and Figures. http://www.bullion.org.za/Publications/Facts&Figures2010/F%20&%20F %202011_Final.pdf [Accessed 14 March 2012] [ Links ].
CHR Metals limited. 2005. Dynamic cost curves. http://www.basemetals.com/content/reports/bm/chr/chr.pdf [Accessed, 9 January 2012] [ Links ].
Department of Mineral Resources of South Africa (DMR). 2010. South Africa's Mineral Industry 2009/2010. http://www.dmr.gov.za/publications/south-africas-mineral-industry-sami.html [Accessed 23 February 2012] [ Links ].
Department of Mineral Resources of South Africa (DMR). 2011. A benefi-ciation strategy for the minerals industry of South Africa.http://www.dmr.gov.za/publications/summary/162-beneficiation-strategy-june-2011/617-beneficiation-strategy-june-2011-.html [Accessed 26 February 2012] [ Links ].
DRD Gold Limited. 2009. DRD Gold Limited Annual Report 2009. http://www.drd.co.za/im/files/annual/ar_2009/files/DRDGOLD_AR2009.pdf. [Accessed, 11 February 2012] [ Links ].
Fawcett, D.H. and Taylor, H.N. 1985. Cost ranking studies in the mining industry. http://0-www.onemine.org.innopac.wits.ac.za/view/?d=9572742C32034672B155273F4 106982F2862C05F9F86254C2D0D3B29BCF2C759194572 [Aaccessed 16 April 2012] [ Links ].
Gentry, D.W. and O'Neil, T.J. 1984. Mine Investment Analysis. Society of Mining Engineers of American Institute of Mining, Metallurgical and Petroleum Engineers, New York, 1984. 502 pp. [ Links ]
Gold Fields Limited. 2011. Gold Fields Limited Annual Financial Report 2011. http://www.goldfields.co.za/reports/ar_dec_2011/pdf/annual_fin_report_2 011.pdf [Accessed 1 February 2012] [ Links ].
Harmony Gold Limited. 2008. 2008. Annual Report. http://www.harmony.co.za/im/files/reports/2008/files/Harmony_AR2008. pdf [Accessed 16 February 2012] [ Links ].
Harmony Gold Limited. 2011. Integrated Annual Report 2011. http://www.financialresults.co.za/2011/harmony_ar2011/downloads/ harmony_integrated_ar2011.pdf [Accessed 16 February 2012] [ Links ].
Jaguar Mining Inc. 2010. Annual Report. http://phx.corporate-ir.net/phoenix.zhtml?c=71999&p=irol-reportsannual [Accessed 26 January 2012] [ Links ].
Kitco. 2012, Charts and data. http://www.kitco.com/scripts/hist_charts/yearly_graphs.plx [Accessed 10 May 2012] [ Links ].
Mail and Guardian. 2012. Farlam commission launches into Marikana shooting. http://mg.co.za/article/2012-10-01-farlam-commission-inpects-marikana-koppies-on-day-one [Accessed 26 October 2012] [ Links ].
Mining Man Newsletter. 2012. Common mining financial terms. http://www.miningman.com/Blog/September-2010/Common-Mining-Financial-Terms-Definitions [Accessed 8 April 2012] [ Links ].
Mining Qualifications Authority (MQA). 2009. Sector Skills Plan for the Mining and Minerals Sector 2005-2010. updated 31 August 2009. http://www.mqa.org.za/siteimgs/SSP%20update%202009%20Final%20Signed%20-%20%20Submitted%2031%20Augsut%202009.pdf [Accessed 31 october 2011] [ Links ].
Musingwini, C. 2009., Techno-economic optimisation of level and raise spacing range in planning a Bushveld Complex platinum reef conventional breast mining layout. PhD thesis, University of the Witwatersrand, Johannesburg. http://wiredspace.wits.ac.za/handle/10539/8291 [Accessed 8 November 2012] [ Links ].
Rudenno, V. 2009. Mining Valuation Handbook. 3rd edn. Wrightbooks, Australia. 539 pp. [ Links ]
Torries, F.T. 1998. Evaluating Mineral Projects: Applications and Misconceptions. Society for Mining, Metallurgy, and Exploration (SME), USA. 161 pp. [ Links ]
World Mine Cost Data Exchange Inc. 2012. Cost curves. http://www.minecost.com/costcvs.htm [Accessed 9 January 2012] [ Links ].
Paper received Nov. 2012
Revised paper received Jan. 2013
© The Southern African Institute of Mining and Metallurgy, 2013. ISSN 2225-6253.

