


Services on Demand
Article
 English (pdf)
 Article in xml format
 Article references
Indicators

Related links
-
 Cited by Google
 -
 Similars in Google
Share

 Permalink
Journal of the Southern African Institute of Mining and Metallurgy
On-line version ISSN 2411-9717
Print version ISSN 2225-6253
J. S. Afr. Inst. Min. Metall. vol.113 n.4 Johannesburg Apr. 2013
PAPERS
Application of membrane technology in a base metal refinery
D.W. NelI; P. van der GrypII; H.W.J.P. NeomagusI; D. BessarabovI
IResearch Focus Areafor Chemical Resource Beneficiation, North-West University, Potchefstroom, South Africa
IIDepartment of Process Engineering, Stellenbosch University, Matieland, South Africa
SYNOPSIS
Nanofiltration (NF) has attracted much attention over the past few years due to the reduced energy consumption compared to reverse osmosis (RO) and better separation performance compared to ultrafiltration (UF). Although research has been done in the area of NF of nickel ions, sodium ions, and acid separation, not much attention has been given to the separation of high nickel concentrations from sulphuric acid streams. The use of NF for the separation of nickel and acid from a spent nickel electrolyte is an innovative process alternative for future industrial application within a base metal refinery.
In this study, the separation performance of a composite polyamide NF membrane on a spent nickel electrolyte was investigated by varying the sodium sulphate concentration in the feed (50-150 g/l), the trans-membrane pressure (35-55 bar), and cross-flow velocity (1.5-3.5 m/s), and measuring quantities such as total permeate flux, acid rejection, nickel rejection, and sodium rejection. The nickel and acid concentration in the feed were kept constant with variations between 40-60 g/l and 25-40 g/l respectively, while the temperature of the experiments was kept constant at 50°C.
The membrane was found to be very selective for nickel ions, with the rejection of nickel ions varying between 54.4% and 98.2%. The rejection of acid ions varied between -5.9% and 21.8%. The rejection of sodium ions varied between 16.6% and 72.4% at a cross-flow velocity of 2.5 m/s and sodium sulphate concentration of 50 g/l in the feed solution. An increase in trans-membrane pressure increased the rejection of nickel, sodium, and acid ions, while an increase in sodium sulphate concentration decreased the rejection of nickel and acid ions.
The total permeate flux was found to increase with an increase in trans-membrane pressure and decrease with an increase in sodium sulphate concentration. The cross-flow velocity had an insignificant effect on the total permeate flux and the rejection of nickel, sodium and acid ions.
Keywords: nanofiltration, rejection, nickel separation, acid separation, sodium separation, membrane.
Introduction
South Africa is a country known for its large mineral resources and the development originating from these resources. The Bushveld Complex situated in South Africa is the world's largest layered igneous intrusion and contains the platinum group metals
(PGMs) platinum, palladium, rhodium, ruthenium, iridium, and osmium, and gold, as well as base metals such as nickel, copper, and cobalt in economically recoverable quantities (Glaister and Mudd, 2010). The base metal mineralization associated with PGM production yields meaningful quantities of copper and nickel as by-products.
The base metal refinery is very important in the PGM cycle as it increases the PGM concentration from mined ore by a factor of 400, in comparison with concentration by flotation (20 times) and pyrometallurgical processing (20 times) (Crundwell et al., 2011). According to Crundwell et al., Anglo American Platinum Ltd produces nickel cathodes by electrowinning and purges sodium from the base metal refinery in the form of sodium sulphate at the Rustenburg Base Metals Refinery (RBMR).
Currently a nickel-rich solution from the leaching circuit is fed to the nickel electrowinning circuit at approximately 90 g/l Ni2+(aq) at a pH of around 3.5 (Crundwell et al., 2011). Energy expenses limit the recovery of nickel in the electrowinning unit to 50%; making the recycle of the spent nickel electrolyte important for profitable nickel production.
The current process configuration for the treatment of spent nickel electrolyte before it is recycled back to the leaching circuit comprises four main process units (known as the sulphur removal section) as shown in Figure 1.
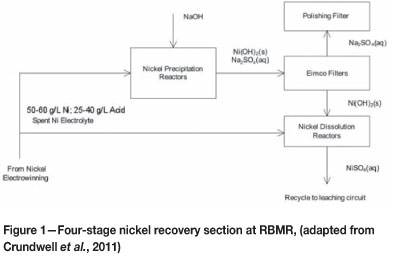
The advantages of the current process are the successful removal of excess sulphur in the form of sodium sulphate and water removal, while the main disadvantage is the addition of large quantities of caustic soda to produce a relatively cheap sodium sulphate by-product. Hofirek and Badcock (1999) discussed various process alternatives to the current process configuration. This investigation identifies and proposes membrane technology, especially nanofiltration (NF), as an innovative process alternative.
Membrane separation processes have been known for over 100 years, but industrial applications have materialized only the last 50 years (Seader and Henley, 2006). According to Cui et al. (2010) membrane processes are one of the fastest growing fields in separation technology. The future outlook for membrane separation processes is to replace more traditional separation processes to reduce capital and operational expenses.
Several membrane separation processes have already been applied successfully in the food and bio-product processing industries, to treat liquid effluent streams and to purify water on an industrial scale (Cui etal., 2010). The significant advantage of using membrane separation processes is that separation is based on a physical mechanism and not on chemical, biological, or thermal changes associated with more traditional separation processes.
Membrane processes are classified by driving force, separation size range, and feed and product phases. Pressure driven membrane separation processes such as microfiltration, ultrafiltration (UF), NF, and reverse osmosis (RO) are well established on a large scale (Richardson et al., 2002). NF is defined as 'a process intermediate between RO and UF that rejects molecules which have a size in the order of one nanometer' (Van der Bruggen et al., 2008).
CAS (2010) reported that from 1970 to 2009 filtration publications increased by 8500% while NF publications increased by 6300% from 1990 to 2009, with products to the value of US$310 million being produced from the successful application of NF. The main economic advantages of NF as purification or separation technology are reduced operating costs, reduced energy consumption, and the small environmental footprint associated with NF. Although NF research related to water purification account for the bulk of the research, Van der Bruggen et al. (2008) mention that the application range of NF has grown to provide answers to new challenges such as arsenic removal, pesticide removal, and the removal of metal ions from effluent streams.
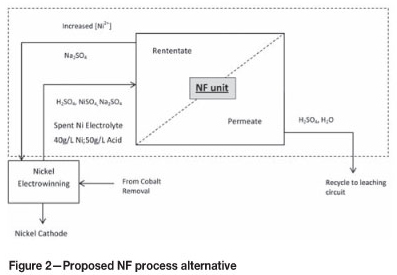
The proposed process alternative for nickel recovery from spent electrolyte, as indicated in Figure 2, replaces the four units currently necessary for nickel concentration and recovery by a single NF unit. The concentrated nickel in the retentate stream is recycled back to the nickel electrowinning tankhouse, together with the sodium sulphate to ensure conductivity within the electrowinning cells, while the permeate is recycled back to the leaching circuit to reduce the overall sulphuric acid consumption of the base metal refinery. It is clear that the proposed process alternative not only reduces capital costs, but also running costs.
The main contribution of this investigation is to demonstrate the successful application of membrane technology in a base metal refinery. This will be done by evaluating the effect of trans-membrane pressure (referred to as pressure), feed concentration, and cross-flow velocity on the separation performance of NF membranes on an industrial spent nickel electrolyte solution.
'In spite of all promising perspectives for NF, not only in drinking water production but also in wastewater treatment, the food industry, the chemical and pharmaceutical industry, and many other industries, there are still some unresolved problems that slow down large-scale application' (Van der Bruggen et al., 2008.)
According to Van der Bruggen et al., the largest industrial application of NF is the production of drinking water, while the chemical and pharmaceutical industries also apply NF successfully to reduce the environmental footprint of separation processes by saving on energy usage. Fouling hinders the application in the drinking water industry the most, while membrane instability and lifetime affect the chemical and pharmaceutical industry. Bertrand et al. (1997) discuss the application of NF to produce drinking water from flooded iron mine effluents, and mention that NF is currently employed to eliminate either organic matter or to reduce the salinity of the water.
Currently NF membrane separation processes are applied with great success in the petrochemical industry, and Ravanchi et al. (2009) believe that membrane separation processes such as NF will play an important role in the petrochemical industry.
Drioli and Romano (2001) mention that although desalination of seawater and saline water are currently the best examples of successful industrialization of NF technology, other successful applications include the preparation of Iopamidol in the pharmaceutical industry, chromium recovery in the leather industry, and treatment of textile effluents for re-use. Table I lists NF research and applications that are related to this study, and emphasises the importance of NF as future separation technology.
For NF to develop as a primary separation technology in the future there are still many technical drawbacks to overcome. The large investments in NF research, as evident in the increase in research publications and patents, will ensure that the future industrialization of NF will increase.
It can be concluded that research related to the separation of nickel from acidic streams is very scarce, and that the focus so far has been on the separation performance of NF membranes on the nickel and acid streams separately. Current research on the performance of NF membranes also focuses on a pH range of 2 to 7, while this investigation will investigate the acid separation at a pH of 1.15. This investigation address high nickel concentrations, an order of magnitude larger than the majority of nickel concentrations investigated in published NF research.
While most of the research related to NF focuses on the treatment of effluent streams from mineral and metallurgical plants, this investigation focuses specifically on the application of membrane technology within the metallurgical environment of a base metal refinery by addressing the separation of high nickel concentrations in very acidic conditions.
Experimental
Materials used
A commercially available polyamide membrane purchased from Hydranautics (a Nitto Denko company) was used in this study. The specific membrane used is confidential. Purified water used in feed solution preparation and membrane pretreatment was supplied by Immuno-Vet Services Pty Ltd. The spent nickel electrolyte solution used for the NF experiments was kindly supplied by Anglo American Platinum Ltd.
Sodium sulphate anhydrous (>99% Na2SO4), nickel sulphate hexahydrate (>99% NiSO4.6H2O), sulphuric acid (>99% H2SO4), and sodium hydroxide (1 N NaOH) were acquired from Ace Associated Chemical Enterprises. All chemicals were used as supplied without further purification.
Apparatus and experimental methodology
The standard NF set-up with all the required equipment is well described in literature (see e.g.: Ahn et al., 1999; Murthy and Chaudhari, 2009; and Tanninen et al., 2004). The experimental apparatus used in this study to generate the NF data is shown in Figure 3.
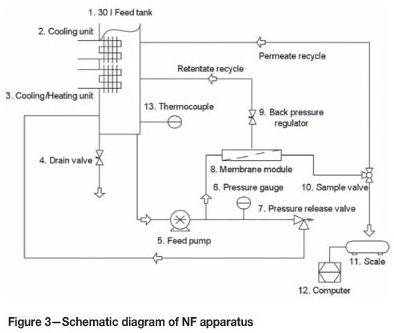
The prepared spent nickel electrolyte solution in the feed tank (1) was pumped with a high-pressure diaphragm pump (5) across the membrane module (8). A drain valve (4) enabled the drainage of the feed solution without spillages. The cooling unit (2) together with the heating/cooling unit (3) was used to keep the temperature in the feed tank (1) at the desired temperature of 50°C. The set temperature was entered into the heating/cooling unit (3). The temperature was measured via a thermocouple (13) placed in the feed tank (1), and the measured temperature displayed on the heating/cooling unit (3).
The pressure was created by the high-pressure diaphragm pump (5); the pressure was regulated with the back-pressure regulator (9) and displayed on the pressure gauge (6). A pressure release valve (7) set on 70 bar circulated the feed from the membrane module to the feed tank in order to release the pressure if it was too high.
The sample valve (10) enabled full circulation of the permeate back to the feed tank (1) or sampling. The permeate mass was measured using a mass balance (11); the weight of the sample was logged on a computer (12) at 2-minute intervals. The sample weight was used to calculate the flux. The collected permeate samples were sent to Anglo American Platinum Ltd where inductively coupled plasma (ICP) spectroscopy and atomic absorption spectroscopy analysis were used to determine the sodium and nickel concentrations, and titrations were used to determine the acid concentrations.
Membrane performance parameters
The performance of membrane separation processes depends not only on the membrane properties but also on the operational conditions (Boussu et al., 2008).
The effectiveness or performance of solvent-solute membrane separation processes is usually expressed in terms of two parameters: flux and rejection (Perry et al., 1997; Seader and Henley, 2006). Cui et al. (2010) mention that the flux is an indicator of the productivity of the membrane separation process, while the rejection is used to indicate the effectiveness.
The flux of a membrane separation process is defined as the amount of permeate per unit time per unit membrane area, and is thus an indication of how fast the permeate passes through the membrane. Flux can be expressed as volumetric, mass, or mole flux. Flux is particular to the membrane, application, operational conditions, and time (Perry et al., 1997).
The rejection or retention (R) of a membrane process is expressed by Equation [1] (Seader and Henley, 2006):
with Cp,i the concentration of the ith species in the permeate stream and Cf,i the concentration of the ith species in the feed stream.
Experimental design and planning
A traditional experimental design was followed, where the effect of the three main operating parameters (pressure, feed composition, and cross-flow velocity) for a NF unit were evaluated. Discussions with Anglo American Platinum Ltd identified pressure, cross-flow velocity, and sodium sulphate feed concentration as the main operating parameters. Considering the practical implementation of the proposed process, pressure was varied between 35 and 55 bar, cross-flow velocity between 1.5 and 3.5 m/s, and the sodium sulphate feed concentration between 50 and 150 g/l. The temperature was kept constant at a typical plant operating temperature of 50°C.
Membrane and feed solution preparation
According to Scarpello et al. (2002) a membrane must first be prepared ('broken-in') before any permeation experiments can be done. This is done to minimize irreversible membrane compaction. Membrane compaction has a large influence on flux, thus by preparing the membrane before permeation experiments the flux decline of the membrane is minimized.
The membrane was prepared by running the experimental apparatus with water for eight hours at 30 bar and 50°C. The used membrane was replaced with a new membrane after three runs. A run in this investigation was defined as the operation of the experimental apparatus with spent nickel electrolyte at all three operating pressures (35-55 bar) at a constant cross-flow velocity and sodium sulphate feed concentration. If a decline in total permeate flux was observed prior to the completion of a run, the membrane was replaced and prepared before the permeation experiments continued.
The ICP analysis of the original spent nickel electrolyte received from Anglo American Platinum Ltd was used to prepare the feed solutions to the desired sodium sulphate concentrations of 50 to 150 g/l. The solution was diluted with distilled water or sodium sulphate anhydrous was added to ensure the specified sodium sulphate concentration of 50 to 150 g/l. The nickel and acid concentrations were maintained at 60 g/l and 40 g/l respectively by the addition of nickel sulphate hexahydrate and sulphuric acid.
Experimental error and reproducibility
It took approximately 60 minutes for the experimental set-up to reach steady state. Ahn et al. (1999) assumed 120 minutes as the time to reach steady state during their investigation. The experimental set-up of Chilvumova and Thöming (2008) took 40-90 minutes before sampling could take place. For this reason, all the results are calculated after 60 minutes.
A spent nickel electrolyte solution at 50°C with a sodium sulphate concentration of 75 g/l was used to determine the reproducibility and experimental error. The experiment was repeated four times at 45 bar. The accuracy of the NF experiments was found to be approximately 3% for the nickel rejection, 6% for the acid rejection, and 10% for the total flux response.
Results and discussions
Influence of pressure
Influence of pressure on rejection
Figure 4 shows the nickel, acid, and sodium rejections over the pressure range of 35 to 55 bar at a constant cross-flow velocity of 2.5 m/s and sodium sulphate feed concentration of 50 g/l. The sodium rejections are known only at a cross-flow velocity of 2.5 m/s and 50 g/l sodium sulphate concentration.
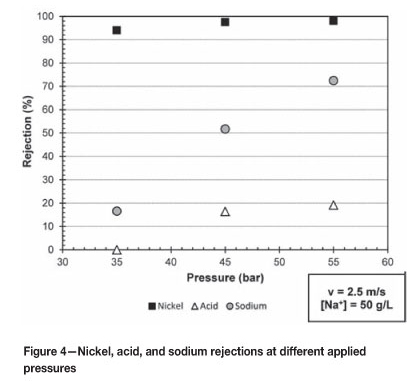
It is clear from Figure 4 that two distinct phenomena are present. The first phenomenon is that the rejection of nickel ions is higher than the rejection of sodium ions over the pressure range of 35 to 55 bar, with the rejection of acid ions being the lowest of the three ions. The first phenomenon can be best explained by the Donnan theory as outlined by Ahn et al. (1999). The separation mechanism of NF membranes is based both on steric and charge effects (Ahn et al., 1999; Murthy and Chaudhari, 2009).
According to Tanninen and Nyström (2002), the isoelectric point (IEP) of NF membranes is between 3 and 6, with the IEP defined as the pH at which the membrane charge is neutral. Hence NF membranes are positively charged when the pH is below the IEP and negatively charged when the pH is above the IEP.
The IEP for a typical Hydranautics membrane is around 3.6 (Qin et al., 2005), and with the feed solution pH varying between 1 and 1.4 the membrane charge is positive for all the experiments. The membrane will thus resist the permeation of positively charged ions. The observed rejection order, R(Ni2+) > R(Na+) > R(H+), can be explained by the steric and charge effects.
The rejection of nickel ions with a positive valence of two is higher than the rejections of both sodium and acid ions with a positive valence of one over the pressure range of 35 to 55 bar, owing to the charge separation mechanism (Ahn et al., 1999). Chaudhari and Murthy (2010) mention that the phenomenon of increased rejection due to increased electrostatic repulsion by the membrane as the valence of the ion increases is one of the common characteristics associated with NF separation. Although Mohammad et al. (2004) also observed higher nickel rejections than sodium rejections, they concluded that there exists a critical pressure and Ni2+/Na+ concentration ratio where the sodium rejections will be higher than the nickel rejections.
The diffusion coefficients of hydronium and sodium in water at 25°C are 93x10-10 m2/s and 13x10-10 m2/s respectively (Henry, 1994). The order of diffusion coefficients in water is inversely related to the rejection order. The diffusion coefficient of hydronium in water is higher than sodium, and the higher diffusion of acid through the membrane will result in a lower acid rejection than a sodium rejection; this trend is in accordance with the reported trends by Chaudhari and Murthy (2010) and Mohammad et al. (2004). Murthy and Chaudhari (2009) associate the classification based on the different diffusion coefficients as best described by the steric separation mechanism of NF membranes. Table II summarizes the valence, hydrated ion radius, and diffusion coefficients in water at 25°C for the nickel, sodium, and acid ions (adapted from Henry (1994) and Richards et al. (2011)).
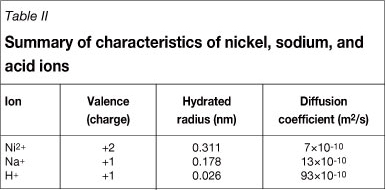
From Table II it is clear why Murthy and Chaudhari (2009) associated the diffusion coefficients of the ions with the steric separation mechanism of NF membranes; as the diffusion coefficient of the ion increases the hydrated ion radius of the ion decreases, resulting in a higher permeate flux of the ion with a smaller hydrated ion radius or higher diffusion coefficient.
The second trend seen from Figure 4 is that the nickel, acid, and sodium rejections increase as the pressure increases over the range of 35 to 55 bar. This increase in rejection as the pressure increases can be best described by the increase in repulsive forces between the positive membrane and the positive nickel, acid, and sodium ions. Other researchers (Gomes et al., 2010; Murthy and Chaudhari, 2009; Mohammad et al.; 2004) also observed this increase in the nickel, acid, and sodium rejections in their systems.
The results in Figure 4 clearly show that it is possible to recover acid from a nickel spent electrolyte solution. To improve the nickel and acid separation the experimental setup can be operated in series, with more NF membranes to increase the separation sharpness between nickel and acid. Gomes et al. (2010) recommended the same operational setup in series to improve the separation between Cr(III) ions and acid. The sodium ions can be concentrated either with the nickel ions if the system is operated at high pressures, or with the acid ions if the system is operated at low pressures.
Influence of pressure on flux
Figure 5 gives the total permeate flux over the pressure range of 35 to 55 bar at a constant cross-flow velocity of 2.5 m/s and sodium sulphate feed concentration of 50, 75, and 150 g/l.
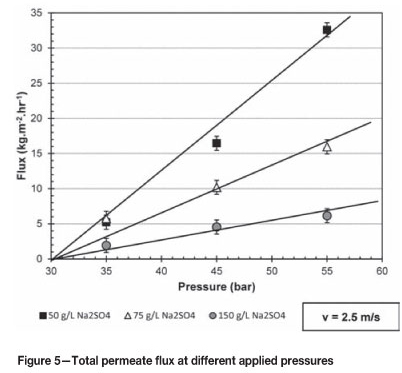
It is clear from Figure 5 as the applied pressure increases over the range 35 to 55 bar the total permeate flux increases. This phenomenon can be best described by a simplified version of the Hagen-Poiseuille equation (Gomes et al., 2010) as depicted by Equation [2] (Perry et al., 1997):

where J is the flux, R is the resistance factor, ΔΡ is the transmembrane pressure and Δπ is the trans-membrane osmotic pressure. According to Gomes et al. (2010) the resistance factor is a function of the dynamic viscosity inside the membrane pores, membrane thickness, pore radius, and additional resistance due to concentration polarization, and fouling.
Assuming that the resistance factor stays constant during the experiments as pressure and sodium sulphate concentration in the feed vary, the osmotic pressure of the spent nickel electrolyte is estimated to be around 30 bar as indicated on Figure 5. Nyström et al. (1995) and Ahn et al. (1999) observed the same linear increase in permeate flux as the pressure increased in their respective investigations.
Assuming that the osmotic pressure is 30 bar and independent of the sodium sulphate concentration, the calculated resistance factor (R) for 50, 75 and 150 g/l sodium concentrations are 1.30, 0.64, and 0.25 kg.m-2.h-1.bar-1 respectively. From the Hagen-Poiseuille equation outlined by Gomes et al. (2010) the resistance factor is inversely proportional to the viscosity of the solution. Jones and Talley (1933) mention that there exists a strong relationship between concentration and viscosity. Abdulagatov et al. (2005) found that the viscosity of sodium sulphate solutions increases with an increase in concentration. This explains the decrease in the resistance factor as the concentration of sodium sulphate increases, thus from Equation [2] the lower permeate flux can be explained from either a viscosity or an osmotic pressure perspective. From the study by Rodrigues et al. (2010) the direct proportional dependence between osmotic pressure and viscosity for sodium sulphate solutions can be verified.
Influence of cross-flow velocity
Influence of cross-flow velocity on acid rejection
Figure 6 gives the acid rejections over the cross-flow velocity range of 1.5 to 3.5 m/s at a constant pressure and sodium sulphate feed concentration of 50 g/l (a), 75 g/l (b), and 150 g/l (c).
From Figures 6 (a) to (c) it is clear that the cross-flow velocity in the range of 1.5 to 3.5 m/s has no significant effect on the acid rejections at 35 and 55 bar respectively. The same phenomenon in Figures 6 (b) and (c) is evident with the exception of a slight increase in the acid rejection at 3.5 m/s and 45 bar; this can be attributed to the experimental error in acid rejection being 6.1% and the variance in pressure varying between ±2 bar.
The Reynolds numbers associated with 1.5, 2.5, and 3.5 m/s are 5 800, 9 600, and 13 500 assuming that the density and viscosity of the feed solution are the same as water at 20°C. The flow is fully developed turbulent flow when the Reynolds number is above 4 000 in closed conduits (Welty et al., 2008), thus the flow over the membrane is fully developed turbulent flow, resulting in the conclusion that the effect of concentration polarization is insignificant at cross-flow velocities above 1.5 m/s (Koyuncu, 2002). It is expected that the cross-flow velocity will have an effect on the acid rejection when the cross-flow velocity is below 0.6 m/s, with the resulting flow over the membrane being laminar flow. A cross-flow velocity of 0.6 m/s is equivalent to a Reynolds number of 2 300; below a Reynolds number of 2 300 the flow is laminar according to Welty et al. (2008).
Koyuncu (2002) observed the same effect of cross-flow velocity on colour removal rejections from salt solutions by NF. Auddy et al. (2005) studied the effect of cross-flow velocity on NF of dye solution experiments, and they concluded that by increasing the cross-flow velocity the resistance of the membrane surface to permeate decreased due to an increase in forced convection, and observed the same response as in this investigation.
Influence of cross-flow velocity on nickel rejection
Figure 7 gives the nickel rejections over the cross-flow velocity range of 1.5 to 3.5 m/s at a constant pressure and sodium sulphate feed concentration of 50 g/l (a), 75 g/l (b), and 150 g/l (c)
From Figure 7 (a) and (b) it is clear that the nickel rejections at a cross-flow velocity of 1.5 and 2.5 m/s are the same, with a slight decrease in nickel rejections at 3.5 m/s being attributed to fouling affecting the nickel rejection instead of the higher cross-flow velocity. The same phenomenon in Figure 7 (c) is evident with the exception of a slight decrease in the nickel rejection at 2.5 m/s and 45 and 55 bar; which can again be attributed to fouling starting at the membrane surface area because the nickel rejections were higher when the membrane was replaced before the cross-flow velocity increased to 3.5 m/s.
The insignificant effect of cross-flow velocity at 1.5 to 3.5 m/s is due to the flow over the membrane area being fully developed turbulent flow, resulting in concentration polarization having an insignificant effect.
Ahn et al. (1999) also observed that by varying the cross-flow velocity the rejection of nickel ions in a multi-salt system stayed constant, while Peeva et al. (2004) noticed that the cross-flow velocity did not have a significant effect on organic solvent NF experiments.
Influence of cross-flow velocity on sodium rejection
Figure 8 gives the sodium rejections over the cross-flow velocity range of 1.5 to 3.5 m/s at a constant pressure of 45 bar and sodium sulphate feed concentration of 50 g/l.
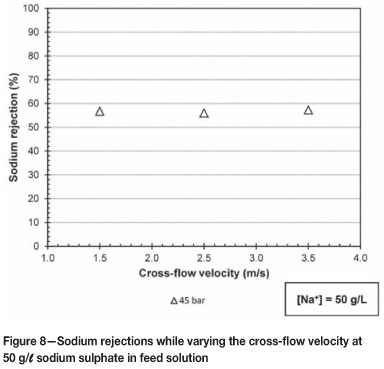
From Figure 8 it is clear that influence of cross-flow velocity on the sodium rejection is insignificant at 45 bar and 50 g/l sodium sulphate feed solution as the cross-flow velocity increases over the range of 1.5 to 3.5 m/s.
The insignificant effect of cross-flow velocity at 1.5 to 3.5 m/s is due to the flow over the membrane area being fully developed turbulent flow, resulting in the effect of concentration polarization being minor.
Influence of cross-flow velocity on flux
Figure 9 gives the total permeate flux over the cross-flow velocity range of 1.5 to 3.5 m/s at a constant pressure and sodium sulphate feed concentration of 50 g/l (a), 75 g/l (b), and 150 g/l (c).
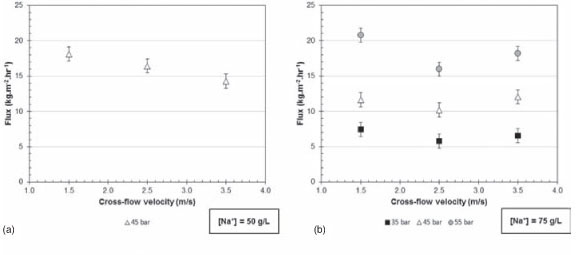
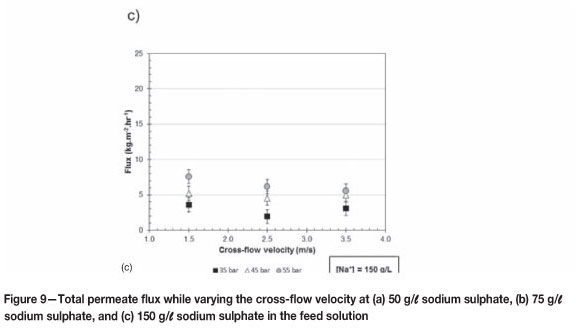
From Figure 9 (a) and (c) it is clear that the cross-flow velocity in the range of 1.5 to 3.5 m/s has no significant effect on the total permeate flux at 35, 45, and 55 bar when the experimental error is acquainted for. The same phenomenon in Figure 9 (b) is evident for 35 and 45 bar, but not for 55 bar. From Figure 9 (b) it is clear that the total permeate flux decreases when the pressure is 55 bar and the cross-flow velocity 2.5 m/s, and then increases as the cross-flow velocity is increased to 3.5 m/s; the decrease from 1.5 to 2.5 m/s could be due to fouling starting to effect the total permeate flux. After the lower total permeate flux was observed at 2.5 m/s and 55 bar as indicated in Figure 9(b), the membrane was replaced, resulting in the flux increasing to 3.5 m/s. This phenomenon can be best explained by the existence of fouling at 2.5 m/s.
Again, the insignificant effect of cross-flow velocity at 1.5 to 3.5 m/s is due to the flow over the membrane area being fully developed turbulent flow, resulting in the effect of concentration polarization being eliminated.
Murthy and Choudhary (2011) observed that increasing the cross-flow velocity increased the total permeate flux, and attributed this to concentration polarization being reduced by a higher mass transfer coefficient at the higher cross-flow velocities. Koyuncu (2002) observed the same phenomenon.
Thus from the results in Figures 7 (b and c) and 9 (b) the conclusion can be made that the high cross-flow velocities of this investigation did not prevent fouling; Mánttári et al. (2002) reached the same conclusion.
Influence of concentration
Influence of concentration on acid rejection
Figures 10 and 11 give the acid rejections as the applied pressure increases over the range of 35 to 55 bar at 1.5 and 2.5 m/s respectively. Figure 10 shows the effect of varying the sodium sulphate feed concentration at 75, 100, 125, and 150 g/l, while Figure 11 shows the effect of 50, 75, and 150 g/l sodium sulphate concentrations.
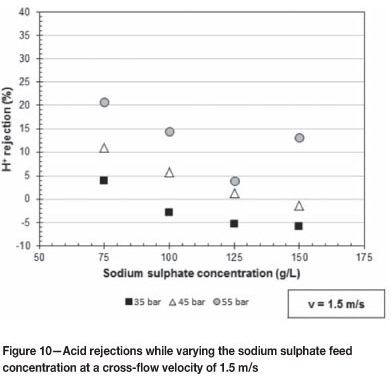
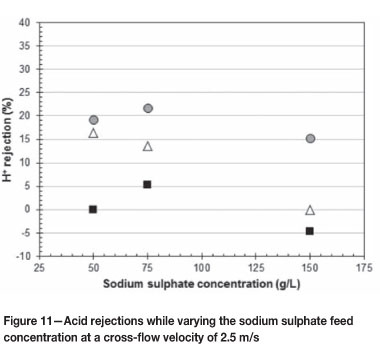
The trend seen from Figure 10 is that as the sodium sulphate concentration in the feed solution increases the rejection of acid decreases over the pressure range 35 to 55 bar at 1.5 m/s. The Donnan effect becomes less effective with the increasing sodium sulphate concentration in the feed solution (Koyuncu, 2002). The smaller Donnan effect results in the permeation of more positively charged hydronium ions, which results in the acid rejection decreasing as the sodium sulphate concentration increases. The high acid rejection at 55 bar and 150 g/l sodium sulphate in Figure 10 can be treated as an outlier, with the pressure most likely being higher than 55 bar.
The cross-flow velocity has an insignificant effect on the rejection of acid. Thus the same trend as in Figure 10 is expected for Figure 11. From Figure 11 the decrease in acid rejection as the sodium sulphate concentration increases is evident only at a pressure of 45 bar. The higher acid rejections at 75 g/l sodium sulphate concentration and pressures of 35 and 55 bar can be attributed to the applied pressure for some experimental runs varying between ± 2 bar.
Influence of concentration on nickel rejection
Figures 12 and 13 give the nickel rejections as the applied pressure increases over the range of 35 to 55 bar at 1.5 and 2.5 m/s respectively. Figure 12 shows the effect of varying the sodium sulphate feed concentration at 75, 100, 125, and 150 g/l while Figure 13 shows the effect of 50, 75, and 150 g/l sodium sulphate concentrations.
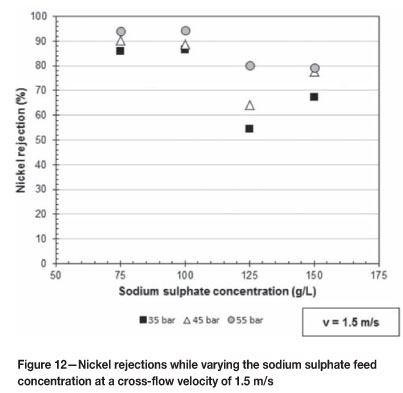
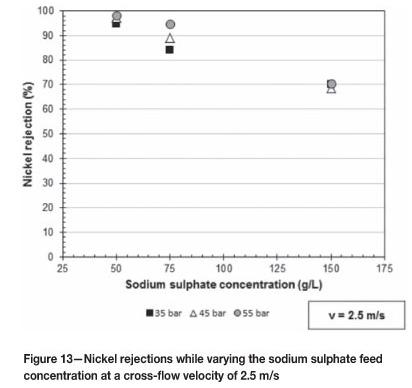
From Figure 13 it is clear that as the sodium sulphate concentration in the feed solution increases the rejection of nickel decreases over the pressure range 35 to 55 bar at 2.5 m/s. The same phenomenon was also expected for Figure 12. The reason for the lower nickel rejections at 125 g/l sodium sulphate (Figure 12) as compared to 150 g/l can be attributed to the higher nickel concentration, being around 60 g/l nickel in the 125 g/l feed solution compared with 50 g/l nickel in the 150 g/l feed solution. Murthy and Chaudhari (2009) also observed lower nickel rejections as the nickel concentration in the feed solution increased.
Richards et al. (2011) mention that the rejection of nickel ions is dependent on pH. As the sodium sulphate concentration in the feed solution increased the pH of the feed solution also increased. The force of the positive charge on the membrane becomes slightly lower as the pH increases towards the IEP of the membrane, thus resulting in lower nickel rejections. This phenomenon was also observed by Chilvumova and Thöming (2008).
Murthy and Choudhary (2011) explained that as the feed concentration increases the concentration of the negatively charged sulphate ions at the membrane surface will increase, resulting in the shielding effect of the membrane charge by the negatively charged ions becoming stronger. This results in a decrease in the membrane repulsion forces on the positively charged nickel ions and thus decreasing nickel rejections.
Mohammad et al. (2004) observed that the nickel rejections increased to a maximum before decreasing as the nickel and sodium concentrations in their investigation increased.
Influence of concentration on flux
Figures 14 and 15 give the total permeate flux as the applied pressure increases over the range of 35 to 55 bar at 1.5 and 2.5 m/s respectively. Figure 14 shows the effect of varying the sodium sulphate feed concentration at 75, 100, 125, and 150 g/l while Figure 15 shows the effect of 50, 75, and 150 g/l sodium sulphate concentrations.
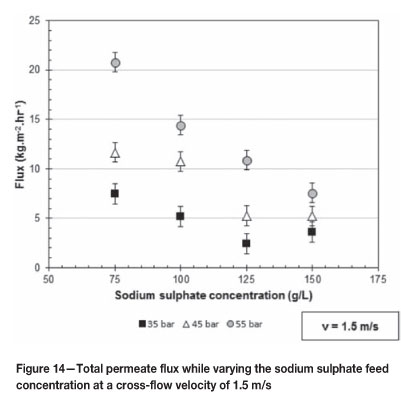
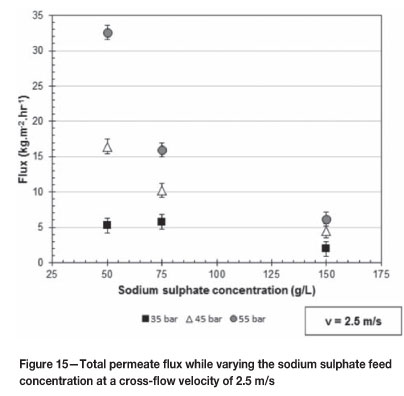
From both Figures 14 and 15 it is clear that as the sodium sulphate concentration in the feed solution increases the total permeate flux decreases. This phenomenon is as expected. The decrease in total permeate flux is due to the increased osmotic pressure of the feed solution as the sodium sulphate concentration of the feed solution increases. This phenomenon was also observed by both Koyuncu (2002) and Gomes et al. (2010), and can be described by the Hagen-Poiseuille equation as outlined by Equation [2].
Conclusions and recommendations
It can be concluded that the NF membrane separation process can be used to separate nickel, acid, and sodium ions from a spent nickel electrolyte solution.
The membrane was found to be very selective for nickel ions, with the rejection of nickel ions varying between 54.4% and 98.2%. The rejection of acid ions varied between -5.9% and 21.8%. The rejection of sodium ions varied between 16.6% and 72.4% at a cross-flow velocity of 2.5 m/s and sodium sulphate concentration of 50 g/l in the feed solution. An increase in pressure increased the rejection of nickel, sodium, and acid ions while an increase in sodium sulphate concentration decreased the rejection of nickel and acid ions.
The total permeate flux was found to increase with an increase in pressure and decrease with an increase in sodium sulphate concentration in the feed solution. The cross-flow velocity had an insignificant effect on the total permeate flux and the rejection of nickel, sodium, and acid ions.
To demonstrate the feasibility of the application of membrane technology in a base metals refinery, the flux should be as high as possible to ensure productivity, while the rejection of nickel and sodium should be as high as possible and the rejection of acid as low as possible to ensure separation efficiency. The effect of pressure, cross-flow velocity, and sodium sulphate concentration in the feed solution on the main objective is summarized in Table III.
From the summary in Table III it can be concluded that the NF separation process should be operated at high pressures to ensure a high overall productivity (high total permeate flux) and high efficiency (better separation between nickel and sodium from acid) and low sodium sulphate concentrations in the feed. The effect of cross-flow velocity is insignificant when the flow over the membrane is fully developed turbulent flow.
The use of NF for the separation of nickel and acid from a spent nickel electrolyte is an innovative process alternative for future industrial application. Recommendations for furthering the development of this process alternative would require pilot-plant studies to identify practical drawbacks of this process alternative and a full economic evaluation on the possible implementation of the NF process in the metallurgical environment of a base metal refinery.
Acknowledgements
The authors would like to thank Anglo American Platinum Ltd for financial and technical assistance.
References
Abdulagatov, I.M., Zeinalova, A., and Azizov, N.D. 2005. Viscosity of aqueous Na2SO4 solutions at temperatures from 298 to 573 K and at pressures up to 40 MPa. Fluid Phase Equilibria, vol. 227. pp. 57-70. [ Links ]
Ahn, K.-H., Song, K.-G., Cha, H.-Y., and Yeom, I.-T. 1999. Removal of ions in nickel electroplating rinse water using low-pressure nanofiltration. Desalination, vol. 122. pp. 77-84. [ Links ]
Al-Zoubi, H., Hilal, N., Darwish, N.A., and Mohammad, A.W. 2007. Rejection and modelling of sulphate and potassium salts by nanofiltration membranes: neural network and Spiegler-Kedem model. Desalination, vol. 206. pp. 42-60. [ Links ]
Auddy, K., De, S., and DasGupta, S. 2005. Performance prediction of turbulent promoter enhanced nanofiltration of a dye solution. Separation and Purification Technology, vol. 43. pp. 85-94. [ Links ]
Bertrand, S., LemaItre, I., and Wittmann, E. 1997. Performance of a nanofiltration plant on hard and highly sulphated water during two years of operation. Desalination, vol. 113. pp. 277-281. [ Links ]
Boussu, K., Vandecasteele, C., and Van der Bruggen, B. 2008. Relation between membrane characteristics and performance in nanofiltration. Journal of Membrane Science, vol. 310. pp. 51-65. [ Links ]
CAS (Chemical Abstracts Service - a division of the American Chemical
Society). 2010. Nanofiltration shows promise in the quest for pure water. http://www.cas.org/File%20Library/News/NanoChemResRep12092010.pd [Accessed 17 Sep. 2012].
Chaudhari, L.B. and Murthy, Z.V.P. 2010. Seperation of Cd and Ni from multicomponent aqueous solutions by nanofiltration and characterization of membrane using IT model. Journal of Hazardous Materials, vol. 180. pp. 309-315. [ Links ]
Chen, S., Hsu, B., Ko, C., and Chuang, P. 2008. Recovery of chromate from spent plating solutions by two-stage nanofiltration processes. Desalination, vol. 229. pp. 147-155. [ Links ]
Chilvumova, E. and Thöming, J. 2008. Nanofiltration of bivalent nickel cations -model parameter determination and process simulation. Desalination, vol. 224. pp. 12-17. [ Links ]
Crundwell, F.K., Moats, M.S., Ramachandran, V., Robinson, T.G., and Davenport, W.G. 2011. Extractive Metallurgy of Nickel, Cobalt and Platinum-Group Metals. Elsevier, New Yorkr. [ Links ]
Cui, Z.F., Jiang, Y., and Field, R.W. 2010. Fundamentals of pressure-driven membrane separation processes. Membrane Technology. Cui, Z.F. and Muralidhara, H.S. (eds.). Elsevier, New York. p. 1-10. [ Links ]
Drioli, E. and Romano, M. 2001. Progress and new perspectives on integrated membrane operations for sustainable industrial growth. Industrial & Engineering Chemical Research, vol. 40. pp. 1277-1300. [ Links ]
Glaister, B.J. and Mudd, G.M. 2010. The environmental costs of platinum-PGM mining and sustainability: Is the glass half-full or half-empty? Minerals Engineering, vol. 23. pp. 438-450. [ Links ]
Gomes, S., Cavaco, S.A., Quina, J., and Gando-Ferreira, M. 2010. Nanofiltration process for separating Cr(III) from acid solutions: experimental and modelling analysis. Desalination, vol. 254. pp. 80-89. [ Links ]
Henry, V.K. (ed.). 1994. CRC Handbook of Thermophysical and Thermochemical Data. CRC Press Inc., Boca Raton. [ Links ]
Hofirek, Z. and Badcock, R.F.W. 1999. Selection of alternative methods of sulphur removal and disposal at RBMR. Mine Metallurgical Managers' Association Circular 2/99. (MMMA), Johannesburg. pp. 35-67. [ Links ]
Jones, G. and Talley, S.K. 1933. The viscosity of aqueous solutions as a function of the concentration. Journal of the American Chemical Society, vol. 55, no. 2. pp. 624-642. [ Links ]
Koyuncu, I. 2002. Reactive dye removal in dye/salt mixtures by nanofiltration membranes containing vivylsulphone dyes: effects of feed concentration and cross flow velocity. Desalination, vol. 143. pp. 243-253. [ Links ]
Manttari, M., Puro, L., Nuortila-Jokinen, J., and Nyström, M. 2000. Fouling effects of polysaccharides and humic acid in nanofiltration. Journal of Membrane Science, vol. 165. pp. 1-7. [ Links ]
Mohammad, A.W., Othaman, R., and Hilal, N. 2004. Potential use of nanofiltration membranes in treatment of industrial wastewater from Ni-P electroless plating. Desalination, vol. 168. pp. 241-252. [ Links ]
Murthy, Z.V.P. and Chaudhari, L.B. 2009. Rejection behaviour of nickel ions from synthetic wastewater containing Na2So4, NiSo4, MgCl2 and CaCl2 salts by nanofiltration and characterization of the membrane. Desalination, vol. 247. pp. 610-622. [ Links ]
Murthy, Z.V.P. and Choudhary, A. 2011. Separation of cerium from feed solution by nanofiltration. Desalination, vol. 279. pp. 428-432. [ Links ]
Nyström, M., Kaipia, L., and Luque, S. 1995. Fouling and retention of nanofiltration membranes. Journal of Membrane Science, vol. 98. pp. 249-262. [ Links ]
Peeva, L.G., Gibbins, E., Luthra, S.S., White, L.S., Stateva, R.P., and Livingston, A.G. 2004. Effect of concentration polarisation and osmotic pressure on flux in organic solvent nanofiltration. Journal of Membrane Science, vol. 236. pp. 121-136. [ Links ]
Perry, R.H., Green, D.W., and Maloney, J.O. (eds.). 1997. Perry's Chemical Engineers' Handbook. 7th edn. McGraw-Hill, New York. [ Links ]
Qin, J., Oo, M.H., and Conigilio, B. 2005. Relationship between feed pH and permeate pH in reverse osmosis with town water as feed. Desalination, vol. 177. pp. 267-272. [ Links ]
Ravanchi, M.T., Kaghazchi, T., and Kargari, A. 2009. Application of membrane separation processes in petrochemical industry: a review. Desalination, vol. 235. pp. 199-244. [ Links ]
Richardson, J.F., Harker, J.H., and Backhurst, J.R. 2002. Particle Technology and Separation Processes. Coulson & Richardson's Chemical Engineering, vol. 2. Butterworth-Heineman, Oxford. 5th edn. 1183 pp. [ Links ]
Richards, L.A., Richards, B. S., and Schafer, A.I. 2011. Renewable energy powered membrane technology: salt and inorganic contaminant removal by nanofiltration/reverse osmosis. Journal of Membrane Science, vol. 369. pp.188-195. [ Links ]
Rodrigues, C., Cavaco MorAo, Pinho, M.N., and Geraldes,V. 2010. On the prediction of permeate flux for nanofiltration of concentrated aqueous solutions with the thin-film composite polyamide membranes. Journal of Membrane Science, vol. 346. pp. 1-7. [ Links ]
Scarpello, J.T., Nair, D., Freitas dos Santos, L.M., White, L.S., and Livingston, A.G. 2002. The separation of homogeneous organometallic catalysts using solvent resistant nanofiltration. Journal of Membrane Science, vol. 203. pp. 71-85. [ Links ]
Seader, J.D. and Henley, E.J. 2006. Separation Process Principles. Wiley, New York. 2nd edn. [ Links ]
Tanninen, J., Manttari, M., and Nyström, M. 2006a. Acid separation with nanofiltration - effect of electrolyte strength and Donnan forces. Desalination, vol. 199. pp. 253-255. [ Links ]
Tanninen, J., Manttari, M., and Nyström, M. 2006b. Nanofiltration of concentrated acidic copper sulphate solutions. Desalination, vol. 189. pp. 92-96. [ Links ]
Tanninen, J. and Nyström, M. 2002. Separation of ions in acidic conditions using NF. Desalination, vol. 147. pp. 295-299. [ Links ]
Tanninen, J., Platt, S., Weis, A., and Nyström, M. 2004. Long-term acid resistance and selectivity of NF membranes in very acidic conditions. Journal of Membrane Science, vol. 240. pp. 11-18. [ Links ]
Van der Bruggen, B., Manttari, M., and Nyström, M. 2008. Drawbacks of applying nanofiltration and how to avoid them: a review. Separation and Purification Technology, vol. 63. pp. 251-263. [ Links ]
Visser, T.J.K., Modise, S.J., Krieg, H.M., and Keizer, K. 2001. The removal of acid sulphate pollution by nanofiltration. Desalination, vol. 140. pp. 79-86. [ Links ]
Welty, J.R., Wicks, C.E., Wilson, R.E., and Rorrer, G.L. 2008. Fundamentals of Momentum, Heat, and Mass Transfer. 5th edn. Wiley, New York. [ Links ]
Paper received Feb. 2013
Revised paper received Feb. 2013.
© The Southern African Institute of Mining and Metallurgy, 2013. ISSN2225-6253
Paper written on project work carried out in partial fulfilment of B. Eng (Chem. Eng. specialization in Mineral Processing)

