


Serviços Personalizados
Artigo
 Inglês (pdf)
 Artigo em XML
 Referências do artigo
Indicadores

Links relacionados
-
 Citado por Google
 -
 Similares em Google
Compartilhar

 Permalink
Journal of the Southern African Institute of Mining and Metallurgy
versão On-line ISSN 2411-9717
versão impressa ISSN 2225-6253
J. S. Afr. Inst. Min. Metall. vol.113 no.3 Johannesburg Mar. 2013
PLATINUM CONFERENCE 2012
A practical approach to plant-scale flotation optimization
A. Harris; L. Venkatesan; M. Greyling
Anglo American Platinum
SYNOPSIS
Decision-making regarding plant-scale reagent dosage regimes and air rates is a topic of ongoing investigation and high importance. The current work explains some techniques that have proven useful in deciding on plant-scale flotation operating regimes. Specific focus has been placed on the reagents: frother and depressant, as well as some discussion around the control of air rate and froth depth.
Air rate has been selected based on its effects on the froth phase. Froth velocity and froth height above the cell lip are the two variables measured and used to select the operating air rate. Pulp level is then adjusted to increase or decrease mass pull.
A technique has been developed using the Anglo Platinum Bubble Sizer on an industrial flotation cell to determine the relationship between bubble size and frother concentration. This technique has been extended to measure the equivalent frother concentration or frothabilities of various streams on a rougher bank. A mass balance for frother was performed successfully, and this provided a better understanding of the way frother moved in the rougher bank. With this knowledge, more informed decisions can be made about frother addition required in subsequent flotation stages.
For depressant, a new protocol for deciding on dosage rate has been developed. The depressant dosage should be based on the amount of fresh feed material reporting to a bank. Currently 400 g per ton of fresh feed has been assumed a reasonable starting point, with promising results. Improved froth stability and grades were observed. There is scope for more accurately defining the optimal dosage rate.
Importantly, the combined effect of changing the chemistry and the hydrodynamics together has been demonstrated. A significant upward shift in the grade-recovery relationship for a cleaner bank was observed.
Keywords: flotation optimization, air rate, reagents, frother, froth depth, depressant.
Introduction
Increasing energy costs over the last five years have significantly increased the cost of platinum concentrate smelting at Anglo American Platinum. In addition, increasing concentrate masses being produced will require the construction of additional smelter capacity by 2015 to process these concentrates. Both of these result in significant increases in operating costs and capital investment.
As such, a reduction in concentrate mass pull presents a significant opportunity for savings of capital and operating expenditure for the company. In addition, in UG2 processing, a reduction in chromite content of concentrates will result in significant energy savings in the smelter. However, this reduction in mass pull and chrome must not come at the sacrifice of platinum group mineral (PGM) recovery.
With this aim in mind, a metallurgical team was assembled to develop a methodology for plant-scale flotation optimization.
The focus areas for flotation optimization were:
Air rate
The current paper presents the work done on air rate, froth depth, frother, and depressant.
Theory
Air rate
Air is a very important variable in flotation control and operation because it affects both the pulp and the froth phase. Vera et al. (1999) investigated the effect of air rate on the collection zone rate constant and froth zone recovery of a copper rougher ore. Under the assumption that the cell behaves as a continuously stirred tank reactor (CSTR), they showed that the relationship between the overall rate constant and froth depth is linear, with the y-intercept representing the collection zone rate constant. This relationship is illustrated in Figure 1.
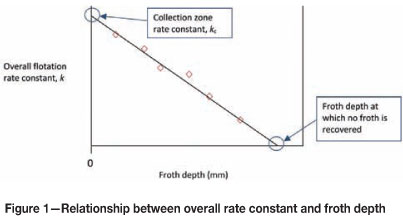
From this relationship the froth zone recovery (Rf) can be calculated as:
In this way, the froth and the pulp phases can be decoupled.
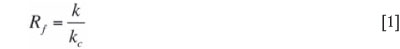
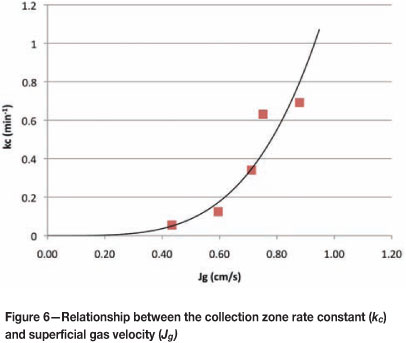
Figure 2 shows the relationship of kc (the collection zone rate constant) and Rf with air rate.
It can be seen that for both chalcopyrite and pyrite that, with increasing air, kc increases and Rf decreases. This implies improved pulp kinetics and deteriorating froth zone recovery. Therefore there is a trade-off between the performance of the froth phase and the pulp phase.
This trade-off makes it difficult to decide on the optimum air rate for a cell. Hadler and Cilliers (2009) found that there exists an optimum air rate that gives improved grade and recovery. This optimum corresponded with a peak in air recovery for a cell. Air recovery is the 'fraction of air entering a cell that overflows the cell lip as un-burst bubbles' and can be used as a proxy for froth stability (Hadler and Cilliers, 2009).
According to Zanin et al. (2009): 'froth recovery is obviously related to the froth stability: stable froths ensure high froth recoveries, while froths showing rapid bubble collapse and volume variation are responsible for lower froth recoveries.' Tsatouhas et al. (2006) found that froth zone recovery significantly limited the overall cell recovery of valuable minerals. Thus stable froths are desirable in flotation.
Frother
Frother is present in flotation slurries in trace amounts. Because it is effective in trace quantities, it is difficult to manage and deciding on a dosage rate is often based on past experience. A further complicating factor is that process water returning to the plant contains certain quantities of residual frother (Finch et al. 2006).
Frother has two main purposes in flotation. In the pulp phase it reduces bubble size by preventing bubble coalescence, and in the froth phase it increases froth stability (Laskowski, 2004).
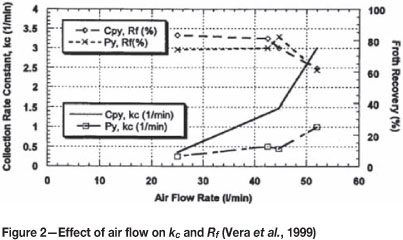
The effect of frother on bubble size has been well documented, as shown by Grau et al. (2005) and Laskowski (2004). There exists a large variety of experimental methods to measure the bubble size, as illustrated by Chen et al. (2001). The University of Cape Town had developed the UCT Bubble Sizer, which uses photographic images to determine bubble size (O'Connor et al., 1990). In the case of our work, the Anglo Platinum Bubble Sizer (APBS) developed by Stone Three Technology, which measures bubbles on industrial flotation cells, was used.
The APBS works by maintaining an unbroken column of water from deep within the flotation cell where the bubbles are generated (Figure 3). The bubbles rise up the collection tubes and into the viewing pane, where images are taken using a digital camera. These images are then analysed using imaging software developed exclusively by Stone Three.
It is known that frother prevents bubble coalescence in the pulp phase and there exists a critical concentration of frother called the critical coalescence concentration (CCC). This is the concentration of frother at which any further increase in frother concentration has no effect on the bubble size (Grau et al., 2005). This relationship is shown in Figure 4.

Grau et al. (2005) found that the CCC for any given frother can be treated as a material constant.
The relationship between bubble size and frother concentration was described mathematically by Comley et al. (2002), who showed that there is an exponential decay relationship between bubble size and frother concentration. This can be simplified into the form:
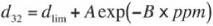
where:
dlim = limiting bubble size, typically bubble size at concentration >> CCC
A, B = parameters from fitting with least-squares regression
d32 = Sauter Mean Bubble Diameter (mm)
ppm = bulk frother concentration (ppm).
On an industrial scale, the aim is to dose sufficient frother to ensure that the CCC is surpassed in the cell. This condition gives the smallest possible bubbles in the cell and maximizes the bubble specific surface area available to particles for attachment. Any dosage higher than the CCC will have no further reducing effect on bubble size and therefore has no further benefit to the pulp phase kinetics.
Extra frother (above the CCC dosage) can be added to improve froth stability. Wiese et al. (2011) found that increasing frother in a laboratory flotation cell increased froth stability (as indicated by water recovery) for all froths under three different depressant dosage conditions.
Measuring the amount of frother in flotation slurries is critical for deciding how much frother should be added at different points in the circuit. Techniques for measuring frother concentration in slurry have proven difficult, although a number of attempts have been made. 'For the one hundred years of flotation there has been no convenient, on-site method of determining frother concentration' (Finch et al., 2006).
Hadler et al. (2005) determined the amount of non-adsorbed frother in a laboratory flotation cell by using a total organic carbon analyser.
Tsatouhas et al. (2005) used gas chromatography to measure frother in two separate industrial rougher/scavenger circuits. They found that the bulk of the frother leaves in the tailings streams, with 5-10 per cent reporting to the concentrate streams.
Gelinas and Finch (2007) used a colorimetric technique to determine the amount of frother in slurries at various sites. They had success in measuring concentrations of alcohol and polyglycol around the circuit, and performed a mass balance exercise to account for their behaviour around the circuit. They found that frother concentrated in the cleaner circuit and that a significant proportion of frother remained in the tails.
A non-analytical method of determining frother concentration in a laboratory was developed by Weber et al. (2003). They determined frother concentration by correlating gas hold-up with the known CCC.
Depressant
Depressant is used to prevent floatable gangue from entering the froth phase where it dilutes the valuable minerals in the concentrate. It also indirectly influences the performance of the froth phase. Froth stability depends on the amount and nature of the particles in the froth (Zanin et al., 2009). Hence, depressant can have a significant destabilizing effect on the froth by preventing floatable gangue from entering the froth phase (Farrokhpay, 2011). This effect is particularly pronounced with platinum ores, where the valuable mineral is present in trace amounts.
Wiese et al. (2011) found that increasing depressant dosage on Merensky ore in a laboratory flotation cell resulted in decreased froth stability due to the removal of froth-stabilizing floatable gangue particles. In addition, it was found that at depressant dosages of >300 g/t, naturally floatable gangue in a Merensky ore could be completely depressed. In a separate experiment, Wiese et al. (2012) found that a depressant dosage of 500 g/t completely depressed natural floatable gangue in a Merensky ore.
Results and discussion
Air rate
Decoupling the pulp and froth phase
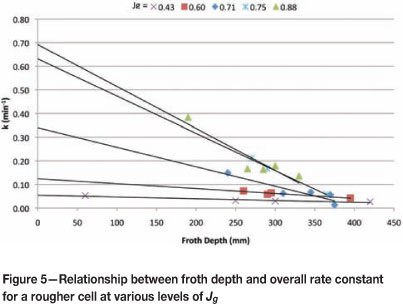
Work was done at Waterval Retrofit Concentrator in Rustenburg in 2010 on a primary rougher cell to compare the effect of superficial gas velocity (Jg) on the pulp and froth phases. The rougher line was treating exclusively Merensky ore. A series of Jg levels were tested at different froth depths and the results were used to determine the relationship between overall rate constant and froth depth, as shown by Vera et al. (1999).
From these results (Figure 5) it can be seen that k increases with Jg. It can also be seen from the y-intercepts that collection zone rate constant increases with Jg. This is summarized in Figure 6, which shows that collection zone kinetics improve exponentially with increasing air rates.
These values of kc were then used to calculate the froth recovery for each Jg and froth depth, as shown in Figure 7.
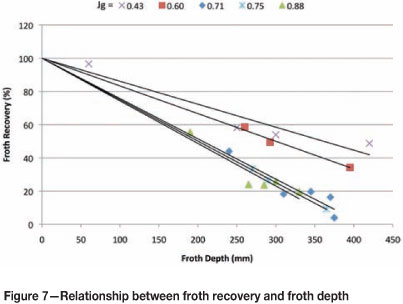
Figure 7 shows that froth recovery decreases with increasing Jg. This confirms the notion that excessive air can destabilize froth and result in poor froth performance. This work shows that the froth and pulp can be successfully decoupled on an industrial scale using the techniques described by Vera et al. (1999).
In addition, it reinforces the idea that there is a trade-off between the froth and the pulp phases with respect to air rate. Too high an air rate can destroy froth stability, and too low an air rate can be detrimental to pulp kinetics.
Effect of air rate on grade and recovery
In industry, the primary variables available for control of flotation performance are air rate and froth depth. From the results discussed above we can see two extremities of control philosophy emerging: either keep froth depth constant and use air rate to control mass pull, or keep air rate constant and use froth depth to control mass pull.
The choice of which philosophy to use is not entirely a black-and-white decision. There are many shades of grey in between these two extremes, and fixing either of these variables is not a sensible thing to do when there is constantly changing feed, as is the case with the vast majority of plants.
It is, however, possible to investigate the effect of these parameters on flotation performance (in terms of grade and recovery) and use these results to make sensible decisions about the ranges in which we operate.
The work discussed above yielded plots of concentrate grade against froth depth for various air rates. The effect of froth depth on concentrate grade for three air rates is shown in Figure 8.
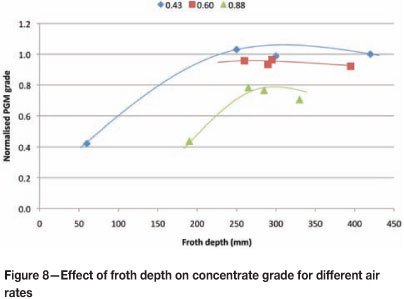
It can be seen from Figure 8 that as the air rate is increased, the concentrate grades achieved decrease. At a froth depth of more than 250 mm, the grades achieved for the Jg 0.43, 0.60, and 0.88 cm/s were 1, 0.9, and 0.75 g/t respectively. In addition, the effect of froth depth on grade is negligible for froth depths greater than 250 mm. A froth depth of 200 mm for the highest air rate Jg = 0.88) yields a normalized grade of around 0.42 g/t - significantly lower than was achieved at deeper froths (around 0.75 g/t). At the lowest air rate (Jg = 0.43), a normalized grade of 0.42 g/t is achieved at a very shallow froth depth of around 60 mm. These results imply that grade is relatively insensitive to froth depth above a certain depth, and that air rate has a detrimental effect on grade.
Further test work of the effect of air rate on concentrate grade was done at Waterfall Retrofit Concentrator in 2012. Two different density conditions were tested: a pulp SG of 1.33 and 1.49. The ore being processed was UG2. Results are shown in Figure 9.
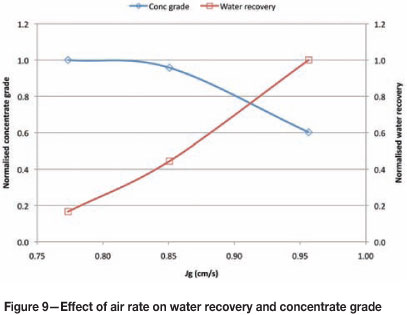
Figure 9 shows that for both density conditions, increasing air rate has a detrimental effect on concentrate grade. Figure 9 also shows the water recovery for both conditions. It can be seen that water recovery exhibits the opposite trend to grade. It has been widely reported (Hay and Roy, 2010) that water recovery corresponds directly with entrainment, and in the case of UG2 ore entrainment results in significant amounts of chrome reporting to the concentrate stream.
Work was done at Amandelbult UG2 no. 2 Concentrator in 2012 on the first rougher cell to determine the effect of air rate on chrome entrainment. Five different air rates were tested. In addition, concentrate percentage solids was measured to give an idea of the amount of water being recovered per unit concentrate mass. The results are shown in Figure 10.
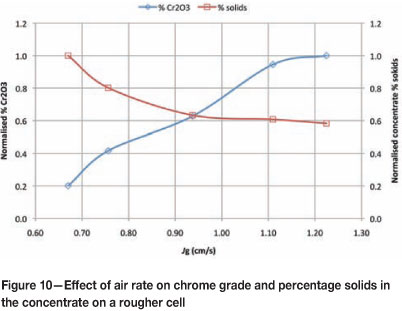
Figure 10 shows a very strong dependence of chrome grade on air rate. The normalized chrome grade increased from 0.2 per cent to 1 per cent with a change in Jg from 0.67 to 1.22 cm/s. The opposite trend can be observed in normalized percentage solids in the concentrate, where the same change in Jg resulted in a drop from 1 per cent to 0.58 per cent solids. This confirms the strong relationship between air rate, water recovery, and chrome entrainment. An additional concern of having low-density concentrates is the reduction in cleaner residence times due to larger volumetric flows feeding forward.
At this point, the question of trade-off between grade and recovery becomes important. Increasing air rate will result in improved recovery in the majority of cases. However, the challenge for a metallurgist is to find the point at which grade is excessively compromised for a marginal improvement in recovery.
Work was done at Waterfall Retrofit Concentrator in 2012 in an attempt to clarify the effect of air rate on grade and recovery of PGMs. Three air rates were tested on the first rougher cell and the ore treated was exclusively UG2. The results are presented in Figure 11.

Figure 11 shows once again the strong detrimental effect that a high air rate has on normalized 4E grade. It can be seen that increasing the air rate from 0.79 cm/s to 0.87 cm/s resulted in a drop in normalized 4E grade from 0.7 g/t to 0.35 g/t, for a marginal normalized recovery improvement from 0.95 per cent to 1.0 per cent. From this data it can be said that an air rate of around 0.79 cm/s gives the best compromise between grade and recovery.
The above data was gathered at a fixed froth depth. If the froth depth is now used to adjust the mass pull upwards, there is little risk of grade compromise (refer to Figure 8), as long as the minimum 'safe' froth depth has been determined.
Selecting air ranges on a plant
As previously stated, fixing air rate is not recommended, as plant feed is nearly always variable. However, it should be relatively safe to assume that this optimum air rate should not deviate far from a spot measurement (assuming no major changes in operating regime such as reagent suite/dosage, comminution mechanisms, feed rate, feed density etc.). This being the case, we can set sensible limits for the air operating range.
Most sites make use of manonometers to measure air entering a flotation cell. These instruments are generally unreliable and at best give only a relative indication of the amount of air entering a cell.
The only way to reliably know the amount of air entering a flotation cell is to physically measure it with some kind of probe. The APBS can be used to measure Jg and bubble size in an industrial flotation cell.
It is impractical to physically measure Jg each time an air rate is changed on a plant. However, it is possible to generate linear calibration curves for the cells on the plant. These curves relate the actual measured Jg value to the air rate number measured by the manonometers in the plant. An example of this is shown in Figure 12.
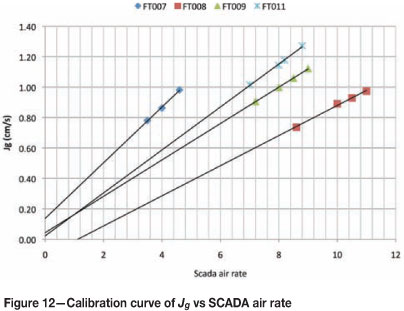
This calibration graph allows the metallurgist to choose the specific Jg at which to operate each cell. In addition, the slope of these curves represents the sensitivity of the actual Jg to the SCADA air rate. Steeper curves indicate a more sensitive response to the SCADA air rate i.e. the change in Jg on FT007 will be greater than that on FT008 for a unit change in SCADA air rate. The metallurgist now has control over the Jg going into the cell and can recommend acceptable ranges for operation (SCADA air rates) based on Jg measurements.
An example of this is shown in Figure 13.
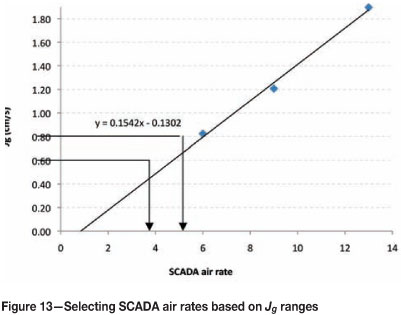
If the aim is to run between 0.6 and 0.8 cm/s, the corresponding SCADA numbers can be estimated directly from the calibration graph (around 5-6) as shown above, or calculated more accurately from the equation of the trend line.
Frother
Measuring bubble size vs. frother concentration using the Anglo Platinum Bubble Sizer
The APBS has proved to be quite robust in providing a measurement of the bubble size in an industrial flotation cell. The inherent design and operation is analogous to essentially bubbling air through a column of water, using the flotation cell as the bubble generating device. Laskowski (2003) used an open top Leeds flotation cell to generate bubbles and the UCT Bubble Sizer to perform bubble size measurements, which were used to measure the CCC for a series of frothers.
Hence a technique analogous to Laskowski (2003) was then tested in industrial cell using the APBS to measure the effect of frother concentration on bubble size. The procedure was as follows:
Figure 14 shows the bubble size versus frother concentration relationships for SASFROTH 200. The test work was performed on various sites, including the Waterval UG2 Concentrator and Amandelbult UG2 no. 2 Concentrator. All the float cells used at different sites were Outokumpu 70 m3 tank cells.
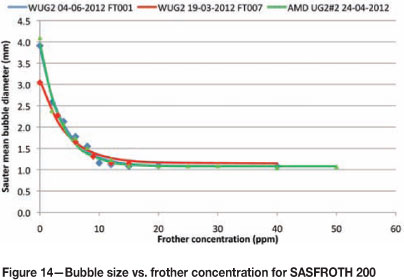
At Waterval UG2, the technique was applied on different days and on the first two rougher cells on either bank, using SASFROTH 200. The results obtained were very similar. In addition, the technique was applied to the first rougher cell at Amandelbult UG2 no. 2, which showed very similar results, in fact almost identical to the result obtained at Waterval UG2 Concentrator on 4 July 2012.
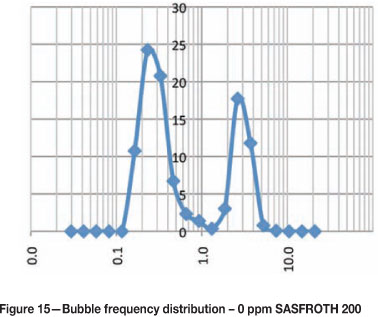
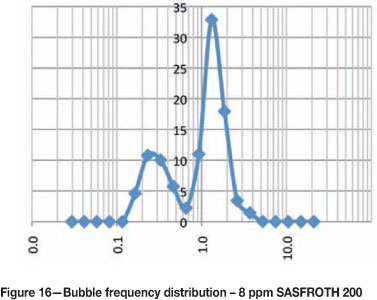
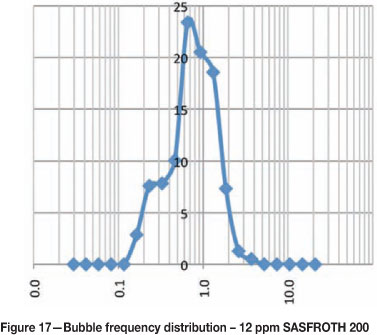
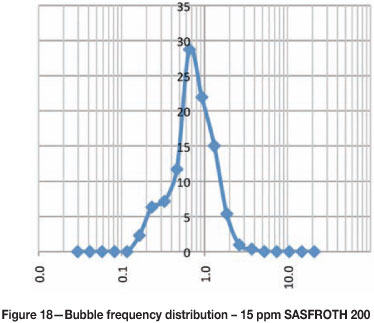
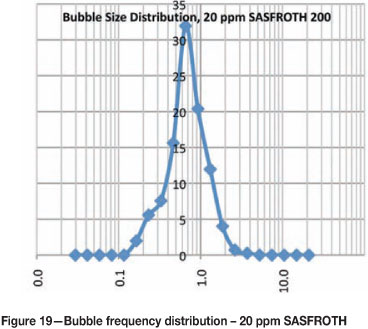
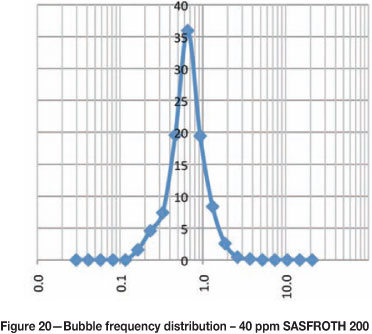
Bubble size frequency distributions at different frother concentrations
Figures 15-20 show the frequency distribution of the bubbles at different frother concentrations. These distributions are similar to those reported by Nesset et al. (2010). Initially, at zero frother concentration, the frequency distribution is bimodal, and as frother concentration increases the frequency distribution approaches a normal distribution.
Using bubble size to measure frother concentration
Various techniques have been used to predict and measure frother concentration. These include total organic carbon, gas chromatography, and colorimetric techniques, which are direct analytical methods. Weber et al. (2003) used an indirect method of measuring frother, by correlating a property of frother, i.e. the effect on gas hold-up, to the concentration of frother.
Comley et al. (2002) showed that the relationship between bubble size and frother concentration could be fitted with an exponential decay relationship. Hence, for an unknown concentration of frother in solution, the bubble size could be measured and accurately translated back to a frother concentration. This could be done provided the bubble size versus. frother concentration relationship was known for that particular frother and the bubble size was in the decay portion of the curve. This technique uses a property of frother in the pulp or liquid phase as a proxy for frother concentration.
However, it is also known that dissolved salts can have a similar effect to frother in the pulp phase by preventing bubble coalescence. Kracht et al. (2009) showed that at a concentration of 0.4 mol/l NaCl produced the same bubble size distribution as 10 ppm MIBC. However, this effect is at high concentrations of salt, and the process water measurements in current plants indicate approximately 0.04 mol/l in equivalent NaCl concentration. In addition, it has been shown by Finch et al. (2006) that a small portion of frother - approximately 1 ppm - returns in the process water. This implies that measuring frother concentration directly using bubble size on a plant scale is not trivial. However, what is valuable is whether or not frother should be dosed, based on its effect on the pulp phase. In addition, the measurement of frother concentration using the bubble size correlation is essentially a measure of the equivalent frother concentration based on its effect on bubble coalescence. This will be referred to from now on as 'frothability'.
Measuring frothability using the APBS
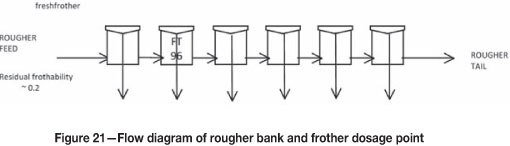
A survey of a rougher bank at Amandelbult UG2 no. 2 (Figure 21) was completed and samples were taken of the feed, concentrate, and tails. These samples were filtered and the filtrate was separated without contamination, and prepared for measurements of frothability. Each stream had to be diluted with potable water to bring the frothability to within the decay portion of the bubble size-frother concentration relationship. Thereafter, by multiplying by the dilution ratio, the actual frothability was determined (Figures 22 and 23). A mass balance was then performed for the frothability to see if it was conserved around the bank to test for data consistency. All concentrations have been normalized relative to the rougher feed concentration after the addition of frother.
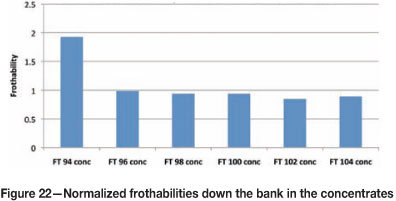
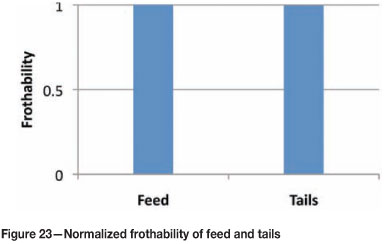
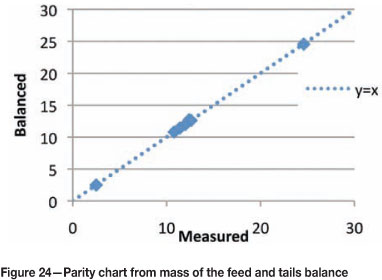
The parity chart in Figure 24 shows that the data is consistent from the mass balance, which implies that the frothability was conserved in the rougher bank. The measurement of the process water in the plant indicated a residual frothability of 0.2 relative to the feed. This implies that the process water does affect bubble coalescence to some degree, indicating that residual frother could be present, which agrees with measurements made by Finch et al. (2006). The frothability of the concentrates showed an increase in the first concentrate by a factor of 2 relative to the feed, and thereafter down the bank the frothability was close to that of the feed. In addition, the frothability of the tails was almost unchanged relative to the feed, and this agrees with the findings of Finch et al. (2006), that the bulk of the frother leaves in the tails.
This information is very useful in setting reagent dosages downstream. This information, in conjunction with the CCC, will provide an estimate of the minimum amount of frother that needs to be dosed in downstream flotation banks.
Depressant
Depressant dosage
Depressant is dosed to improve the upgrading of concentrate streams. Deciding on the optimal depressant dosage in mainstream and cleaner flotation applications is not a trivial task, and because of this there is very little consistency with regards to depressant dosage regimes from site to site. In industry, reagent dosages are usually based on the feed tonnage to the plant for simplicity of consumption monitoring.
In cleaning circuits, the mass flows of the streams are often 20-100 times smaller than those of the main stream. Despite this, dosage of reagents to these sections is still based on the plant feed tonnage and not the feed to the specific area in question. This being the case, it is not surprising that reagents in the cleaning section are often dosed in excess.
Recent work by Wiese et al. (2011, 2012) has shown that depressant dosages of between 300 g/t and 500 g/t can depress all floatable gangue in a Merensky ore. It must be highlighted that this was established on a rougher feed type sample. Very little literature exists on depressant dosages in cleaner applications. Using 400 g/t as a basis for deciding on depressant dosages has proven valuable at a number of UG2 sites.
Cleaner feed rates were measured manually off the mainstream rougher cells. The dry tonnage feeding forward to the cleaning circuit was then calculated and used to dictate the amount of depressant required in the subsequent flotation stage based on 400 g/t of fresh feed reporting to that bank.
A typical example of this method is shown in Figure 25.
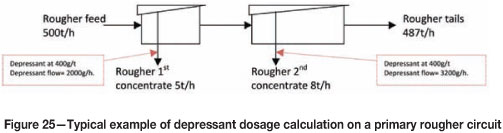
In the vast majority of cases it was found that depressant was being dosed well above 400 g/t of fresh feed entering the bank. Excessive depressant has detrimental effects on froth stability and results in very unstable froths, which require excessive air rates to generate reasonable froth overflow. This effect is illustrated in Figure 26.
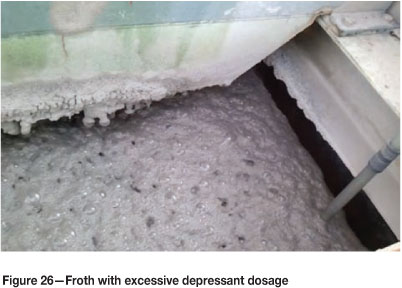
Figure 26 shows small unstable bubbles in the froth with bubbles bursting on the surface of the froth.
When depressant was reduced on the same cell along with air rate adjustment, the effect was dramatic, and is illustrated in Figure 27.
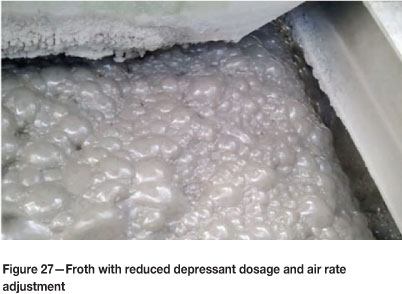
Figure 27 shows a more stable froth, with large, loaded bubbles and very few bursting bubbles.
Combined effect of air, depressant, and frother on primary cleaners
Using this philosophy for depressant and frother management as described in the previous section, work was undertaken at Waterfall UG2 Concentrator in Rustenburg in 2012.
The frother balance described in the preceding section indicated that the concentration of frother in the water feeding forward to the cleaner bank was above the CCC, and therefore no extra frother was required for management of the bubble size in the pulp phase. This being the case, frother dosage to the bank was stopped.
Measurements of the flow rates feeding to the cleaner bank were taken manually, and a calculation based on 400 g/t of fresh feed resulted in a 60 per cent reduction of depressant dosage.
Once both reagent changes had been made, the air profiles for the bank were re-assessed and the bank was surveyed. The effect of the changes on the grade-recovery curve of the cleaner bank is shown in Figure 28.
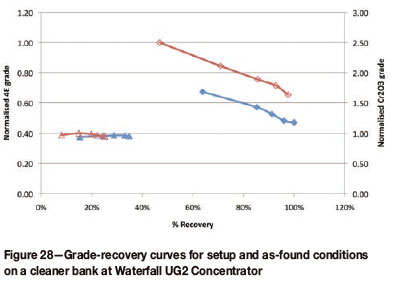
Figure 28 illustrates the combined effect of reagent and air rate adjustment. The changes resulted in a significant upward shift of the grade-recovery curve. In addition, Cr2O3 recovery has been reduced.
The changes made improved the combined concentrate grade from the bank by 34 per cent. Concentrate mass pull was reduced by 23 per cent and volumetric flow rate was reduced by 28 per cent. The reduced mass pull from this bank will contribute towards reducing the overall plant mass pull, which is one of the primary objectives of this work. In addition, the reduced volumetric flows feeding forward will increase the residence time in subsequent flotation stages.
Furthermore, these benefits are achieved with reduced depressant and frother dosages, which represent additional benefits in terms of cost savings to the plant.
Conclusions
Techniques for deciding on plant-scale flotation operating parameters have been developed. Specific emphasis has been placed on frother dosage, depressant dosage, and air rate. These techniques have proven to be fairly robust and repeatable across various UG2 concentrators.
It has been established that concentrate grade is very sensitive to air rate. As such, it has been suggested that air rate be controlled within a narrow range. The 'optimal' air rate has been selected by evaluating its effect on the froth phase in terms of froth velocity and froth height above the lip.
Indications from the current work show that froth depth has very little effect on the concentrate grade below a certain depth, but improves froth recovery. As such, it is suggested that froth depth should be used to control mass pull.
A technique for measuring the relationship between bubble size and frother concentration has been developed using the Anglo Platinum Bubble Sizer. The measurement has proven to be repeatable and reproducible. In addition, using this relationship and the technique, equivalent frother concentrations or frothabilities of the various streams in a rougher bank have been determined. This technique, in conjunction with a mass balance, allowed the measurement of the amount frother reporting to downstream flotation banks in the plant. This measurement, in conjunction with the CCC, provides a minimum dosage requirement to ensure pulp phase effects are satisfied downstream, and any additional amount beyond the minimum will be to ensure that the froth phase is satisfied.
Dosing depressant based on 400 g/t of fresh tonnage feeding a section has been trialled. In most cases it was found that depressant was being dosed in excess of this level. Reducing the depressant dosages to cleaner banks has resulted in more stable, manageable froths. Dosing at 400 g/t was used as a starting point - there is scope for determining a more rigorous optimum dosage for each specific cleaner application.
When these techniques were combined on a cleaner bank, the overall result was extremely positive. A significant upward shift in the grade-recovery curve was obtained, as well as reduced concentrate mass, chrome recovery, and volumetric flows in the concentrate stream.
This new protocol for optimizing flotation hydrodynamics and chemistry simultaneously has proven to give good results and is simple and fast to implement on site.
References
Chen, F., Gomez, C.O., and Finch, J.A. 2001. Bubble size measurement in flotation machines, Minerals Engineering, vol. 14. pp. 427-432. [ Links ]
Comley, B.A., Harris, P.J., Bradshaw, D.J., and Harris, M.C. 2002. Frother characterisation using dynamic surface tension measurements. International Journal of Mineral Processing, vol. 64. pp. 81-100. [ Links ]
Farrokhpay, S. 2011. The significance of froth stability in mineral flotation - A review. Advances in Colloid and Interface Science, vol. 166. pp. 1-7.
Finch, J.A., Gelinas, S., and Moyo, P. 2006. Frother-related research at McGill University. Minerals Engineering, vol. 19. pp. 726-733. [ Links ]
Gelinas, S. and Finch, J. 2007. Frother analysis: some plant experiences. Minerals Engineering, vol. 20. pp. 1303-1308. [ Links ]
Grau, R.A., Laskowski, J.S., and Heiskanen, K. 2005. Effect of frothers on bubble size. International Journal of Mineral Processing, vol. 76. pp. 225-233. [ Links ]
Hadler, K., and Cilliers, J.J. 2009. The relationship between the peak in air recovery and flotation bank performance. Minerals Engineering, vol. 22. pp. 451-455. [ Links ]
Hadler, K., Aktas, Z., and Cilliers, J.J. 2005. The effects of frother and collector distribution on flotation performance. Minerals Engineering, vol. 18. pp. 171-177. [ Links ]
Hay, M. and Roy, R. 2010. A case study of optimising UG2 flotation performance. Part 1: Bench, pilot and plant scale factors which influence Cr2O3 entrainment in UG2 flotation. Minerals Engineering, vol. 23. pp. 855-867.
Kracht, W. and Finch, J.A. 2009. Bubble break-up and the role of frother and salt. International Journal of Mineral Processing, vol. 92. pp. 153-161. [ Links ]
Laskowski, J.S. 2004. Testing flotation frothers. Physicochemical Problems of Mineral Processing, vol. 38.pp. 13-22.
Laskowski, J.S., Tlhone, T., Williams, P., and Ding, K. 2003. Fundamental properties of the polyoxypropylene alkyl ether flotation frothers. International Journal of Mineral Processing, vol. 72. pp. 289-299. [ Links ]
Leja, J. 1982. Surface Chemistry of Froth Flotation: Reagents and mechanisms. 2nd edn. Rao, S.R. (ed.). Kluwer Academic/Plenum Publishers, New York. [ Links ]
Melo, F. and Laskowski, J.S. 2006. Fundamental properties of flotation frothers and their effect on flotation. Minerals Engineering, vol. 19. pp. 766-773. [ Links ]
Nesset, J.E., Zhang, W., and Finch, J.A. 2010.Predicting the Sauter mean bubble size (d32) from key operating variables for mechanical, forced-air flotation machines. Presentation to the AMIRA P9O Meeting,, 18 November 2010.
O'Connor, C.T., Randall, E.W., and Goodall, C.M. 1989. Measurement of the effects of physical and chemical variables on bubbles size. International Journal of Mineral Processing, vol. 28. pp. 139-149. [ Links ]
Tsatohaus, G., Grano, S.R., and Vera, M. 2006. Case studies on the performance and characterisation of the froth phase in industrial flotation circuits. Minerals Engineering, vol. 19. pp. 774-783. [ Links ]
Vera, M.A., Franzidis, J.P., and Manlapig, E.V. 1999. Simultaneous determination of collection zone rate constant and froth zone recovery in a mechanical flotation environment. Minerals Engineering, vol. 12, no. 10. pp.1163-1176. [ Links ]
Weber, T., Gomez,C.o., and Finch, J.A.2003. A frother concentration meter. Proceedings of the 35th Annual Meeting of the Canadian Mineral Processors, 21-23 January 2003. pp. 639-652. [ Links ]
Wiese, J., Harris, P., and Bradshaw, D. 2011. The effect of the reagent suite on froth stability in laboratory scale batch flotation tests. Minerals Engineering, vol. 24. pp. 995-1003. [ Links ]
Wiese, J. and Harris, P. 2012. The effect of frother type and dosage on flotation performance in the presence of high depressant concentrations. Minerals Engineering, http://dx.doi.org/10.1016/j.mineng.2012.03.028 [ Links ]
Zanin, M., Wightman, E., Grano, S.R., and Franzidis, J.P. 2009. Quantifying contributions to froth stability in porphyry copper plants. International Journal of Mineral Processing, vol. 91. pp. 19-27. [ Links ]
© The Southern African Institute of Mining and Metallurgy, 2013. ISSN 2225-6253.
This paper was first presented at the 5th International Platinum Conference 2012, 18-20 September 2012, Sun City, South Africa.

