


Services on Demand
Article
 English (pdf)
 Article in xml format
 Article references
Indicators

Related links
-
 Cited by Google
 -
 Similars in Google
Share

 Permalink
Journal of the Southern African Institute of Mining and Metallurgy
On-line version ISSN 2411-9717
Print version ISSN 2225-6253
J. S. Afr. Inst. Min. Metall. vol.113 n.3 Johannesburg Mar. 2013
PLATINUM CONFERENCE 2012
Case studies of simultaneous mining and mineral processing optimization applied to platinum and nickel operations
S. Burks
Whittle Consulting
SYNOPSIS
This paper develops the themes explored by the authors at the Fourth International Platinum Conference1. Optimization techniques can be used to significantly increase the value of mining businesses by enabling better long-term planning decisions. Open pit and underground mine design, mine scheduling, cut-off grade and blending, stockpiling, and the linking of these to flexible elements of the metallurgical recovery processes are all evaluated together. Transport or sale of intermediate products and the requirements of the product metal markets can also be considered. Experience shows that net present value (NPV) can potentially be increased by 5-35 per cent or more, usually even before the expenditure of significant amounts of project capital.
The case studies presented include:
► An existing operation with multiple open pits and PGM concentrators linked to offsite downstream processing facilities, and with infrastructure constraints for which the scheduling of current operations and the potential for expansion were investigated
► An existing operation with an integrated portfolio of mines, concentrators, smelter, and refinery, for which the various possible sources of ore for processing were prioritized to match the downstream process plant constraints and the product markets
► An underground operation in Zimbabwe for which the optimum mining width was calculated and expansion plans were evaluated
► An underground mine with many separate mining sections, for which a revised schedule was developed aiming to keep the shaft system and processing plant at capacity with the highest net value material available at any time throughout the life of mine.
In the concluding section of the paper, a few brief notes are included suggesting how the strategic recommendations from enterprise optimization studies may be implemented by the owner's team.
Keywords: simultaneous optimization, mining, mineral processing, platinum, nickel.
Introduction
Many software packages exist to optimize various parts of a mining business in isolation. However, it is rare for companies to optimize all parts of their operation or portfolio simultaneously. In the past ten years, Whittle
Consulting has focused on expanding the boundaries of integrated optimization, concentrating on issues faced by large and complex mining and processing operations. Using advanced techniques, an integrated geological, mining, processing, transport and product model can be constructed. This is manipulated mathematically to optimize the values of those variables that are considered negotiable. Utilizing this procedure, it is possible to develop long-term plans that maximize the value of large geological and technical plant asset portfolios. Realizable improvements in net present value (NPV) of the business in the range 5-35 per cent have been demonstrated in many cases.
This methodology is very suitable to be applied to the platinum group metal (PGM) and related sectors of the mining industry. Since the previous paper by Whittle and Burks was presented1, several optimization studies of PGM and nickel operations or projects have been completed in a number of different locations. In this paper, the author uses multiple case studies to illustrate how a different suite of optimization techniques in each case could be used to identify significant overall value addition.
The paper concludes with a short section suggesting some of the action items needed to implement the recommendations of this type of study. These are relevant to all potential users of this type of approach. Of the four case studies, one of the owners' teams implemented most of the recommendations made over several years using methodology and computational methods described by Whittle and Whittle2,3, two of the others followed some recommendations, and the fourth operation is still considering the proposals made.
A reminder - what is enterprise optimization?
Enterprise optimization can help to solve the production schedule challenges of mining and processing operations with multiple pits, mining faces and underground mines, multiple metal or mineral products, stockpiling and blending opportunities, and alternative processing options. The combination of these features creates significant long-term planning and analytical problems and opportunities that often exceed the capabilities of commercially available mining optimization software. The principles and challenges were described in more detail by Whittle in 20044.
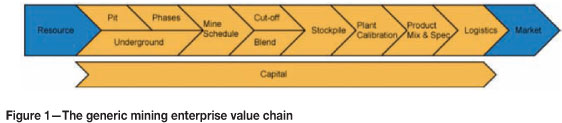
Simultaneous optimization aims to address all steps in the value chain and all assets in the enterprise portfolio together, and does this while also considering all time periods of the planned operation. This is a crucial additional complexity differentiating mining from other businesses. An orebody is a depleting resource; when we decide what to mine and process in one period, we constrain the available options for all future periods.
Figure 1 illustrates the point. There is little or nothing that any enterprise can do to improve the resource in the ground or the international market for the products, but all the other steps illustrated in the figure can potentially be optimized.
Enterprise optimization concentrates on optimizing the NPV of businesses. NPV is the sum of discounted cash flows, normally calculated or forecast annually. It reflects the time value of money and is considered to be a metric for planning and measuring the performance of any business that will be understood and appreciated by executive management, shareholders and other investors, and all stakeholders.
Philosophically, many mining businesses struggle to identify clear and consistent objectives. For example, maximizing metal production, maximizing life of mine, minimizing costs, maximizing resource recovery from the ground, maximizing metal recovery from ore mined, and maximizing utilization of equipment are all often cited as being key objectives for operations. However, it is difficult to rank these against each other, and some of them conflict. Enterprise optimization therefore focuses on a single objective: to maximize the economic value of the business.
Application of optimization principles to the case studies
The four case studies selected for this paper provided diverse optimization challenges in several links of the production value chain, and therefore are used here to illustrate the flexible nature of the mechanisms and techniques applied. In all cases, the names of the operation, the parent mining company, and the location have been withheld intentionally. Unfortunately, since the analyses in each case identified operational strategies that could affect the valuation of the operation and all of the parent companies are publicly owned, this is a sensitive issue. Specific results could also not be provided in this paper, which focuses on describing the approach and mechanisms tested in each case and on the broad trends of the results.
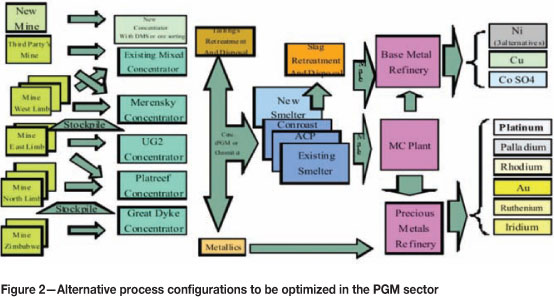
In the case studies, the optimization work was applied to a portion or, in one case, the whole of the typical value chain common throughout the industry. This is illustrated in Figure 2.
Case study 1
Description of the task
This work was carried out with the author's participation for a large producer of nickel and platinum, and related mainly to one specific operating mine5. This mine operates seven open pits, all within approximately fifteen kilometres of each other, and which feed two concentrator plants. Open pit mining is carried out using conventional blasting, load and haul methods, and ore and waste are both transported out of the pits using large dump trucks. The ore is crushed and can then be transported and fed to either of the two milling and flotation plants. The flotation concentrate containing PGMs and base metals is transported to one of a number of possible smelters for further processing.
The main objectives set for this enterprise optimization study were:
To facilitate deferral or minimization of capital expenditure for the next 3 to 5 years
Methodology
The approach described here was also followed in the other case studies dealt with later, and therefore will be described only once.
Phase 2: Scenario planning based on the current planned size of operation
This operation supplies a significant percentage of the PGMs and nickel produced by the parent company in a sulphide concentrate that is then smelted and refined in offsite facilities. These currently have a fixed capacity, and due to mineralogical and other constraints the downstream facilities have to limit the percentage of concentrate and metal they can accept in feed from this mine. Phase 2 of the enterprise optimization exercise worked within these limits and used updated commercial parameters from the latest official business plan to determine the optimum mining rates, concentrator schedules, and processing practices for each year of the projected life of mine. Specific scenarios considered included:
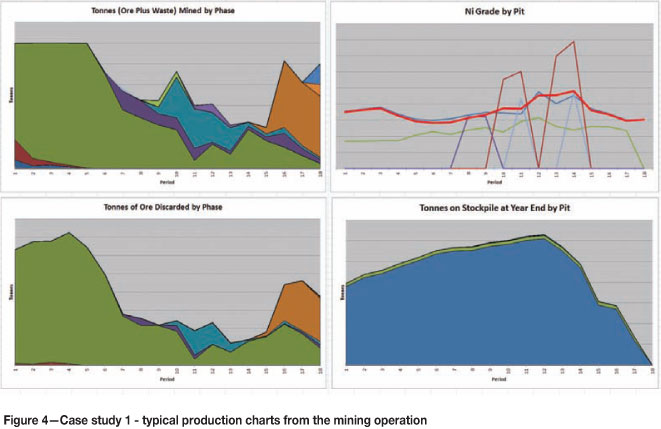
In this phase of the work approximately 30 Prober runs were completed over a six-week period, the output of each of which consisted of over 50 tables and 70 charts illustrating trends in the key operating parameters, as well as providing an overall financial analysis of the effect of changes in the input settings. A few typical charts illustrating trends annually over the life of mine are shown in Figures 4 and 5, taken at random from two runs completed for this case study.
Some common general principles of enterprise optimization studies can be observed in these charts:
Figure 5 shows that the major influence on value at this operation is the PGM content, and the average grade can be seen declining gradually during the period studied in order to bring forward both net undiscounted cash and discounted cash flow as much as possible to the early years of the operation. The charts showing base metal (nickel and copper) grades do not exhibit the same trend, partly because of downstream base metal refinery capacity constraints, but mainly because the value of the base metals is subordinate to that of the PGM content
Phase 3: Scenario planning including possible expansions
The final phase of work on this study utilized a modified resource block model provided by the operation, investigated the likely impact of possible expansion of concentrator, smelter, and refinery processing facilities on the mining operation, considered different possible mining durations, and ensured that production was maintained between defined limits each year to prevent major in-process inventory swings from year to year. It was completed in approximately one month. The results of this portion of this work are speculative and sensitive, and so are not illustrated in this paper.
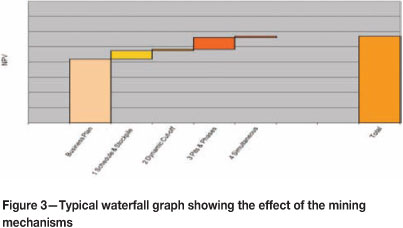
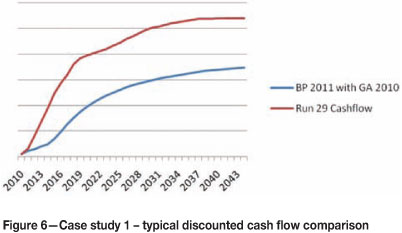
In total, the three phases of work on this study took over five months to complete, with over seventy Prober runs being completed. A cumulative cash flow chart from one of the interim reports is produced in Figure 6 with the monetary scale intentionally omitted6. This illustrates the typical profile of enterprise optimization study results, with significant cash flow improvements in the first years and a much flatter profile later. In this specific case, Figure 3 provides guidance about which of the six 'mining' mechanisms contributed to the overall potential NPV improvement.
In addition, processing flexibility, product optimization, logistics optimization, and capital expansion optimization also generated improvements. All of these mechanisms were set up to comply with practical constraints, limits, and operational parameters that were already being applied by the existing operation or the project teams considering potential expansions.
Case study 2
Scope of study
This work was carried out with the author's participation for an operation producing PGMs and base metals in Zimbabwe from an underground mine positioned on the Great Dyke7. Referring to Figure 1, all of the enterprise optimization mechanisms other than the first two steps of pit optimization can be applied to any form of mineral mining and processing enterprise, not simply to those operations and projects based on open pits.
The Great Dyke is a lopolithic geological structure extending for 550 km across much of Zimbabwe along a strike of about N10°E. It is between 4 km and 11 km wide, and contains layered ultramafic intrusions that support a number of economically viable PGM mines and processing plants operated by several different companies. Because the mining operations are normally shallow and grades are comparable with those across the Bushveld Complex in South Africa, the Great Dyke has been the focus of expansion and enterprise extension plans for a number of mining companies in the past few years.
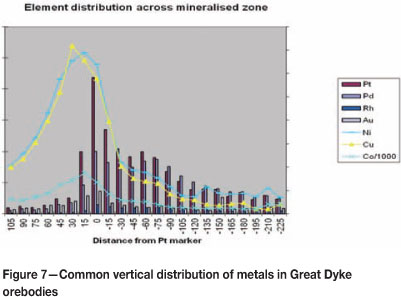
Most operations based on the Great Dyke mine a single reef in which the vertical thickness of the main mineralized zone is normally about 2 to 3 m. This reef usually extends across the Great Dyke from east to west, outcropping on both sides of the Dyke and dipping to a depth of several hundred metres in the centre of the E-W section. As can be seen in Figure 6, there is often a displacement of the peak values of base metals (nickel, copper, and cobalt) and platinum group metals (platinum, palladium, rhodium, and gold, constituting 3PGM+Au) considered vertically through the reef. The point at which the platinum grade peaks is defined in Figure 7 as the 'Pt Marker'. The base metal distribution is skewed towards the hangingwall, and base metal value peaks 15-45 cm above the platinum peak. The palladium peak, on the other hand, occurs about 30 cm below the platinum peak. There is a very rapid decline in PGM grades above the Pt marker, but a long tail of PGM value below the marker. Consequently the typical mine on the Great Dyke is faced with two challenges: first, determining the optimum stoping height (vertical thickness) and second, deciding how far above the platinum peak to mine in order to pursue base metal values.
In case study 2, the owner's team therefore set a number of objectives for the enterprise optimization study within the overall context of maximizing NPV:
As with the other case studies, work commenced with a kick-off meeting, data collection, and preparation of a base case. For this study, collection of technical and cost parameters for the underground mining operation was particularly important, but the whole list of data collected is relevant and represents what is typically required:
Once again, the optimization work done was done taking into account the practical technical constraints and limits specified by the owner's team in advance or as the work progressed.
Qualitative description of the results of case study 2
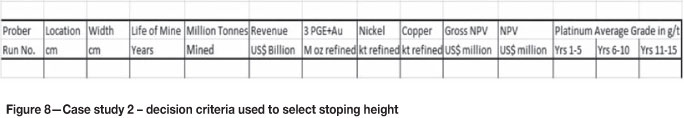
Following the preparation, review, and approval of a base case, the basic data input model was used to prepare Prober runs for a range of stoping heights (constant mining width then used for all levels of the mine in each case, rather than trying to vary the stoping height at different levels), and the usual range of tables and graphs was produced for each run. A summary table of results was also generated, which was used to rank the options. This took into account the possibility of needing to purchase additional low-profile mining equipment for some of the narrower mining widths, and also considered a number of technical issues, such as the different extraction factors and support requirements needed if a decision was to be made to change from current mining practices. Figure 8 shows the headings of the summary table. As with most operations, in case study 2 the owners' team wished to consider other factors as well as NPV before reaching a decision. The table facilitated this and a decision was made to be recommended to the mine's executive management team.
There is less flexibility in an underground operation than there is in open pits, and the basic Lerchs-Grossman algorithm for maximizing undiscounted cash flow and determining the outer shell boundaries of an open pit cannot be applied to an underground mine. However, the base case did still include scheduling and cut-off grade optimization to a limited extent. The overall shaft capacity limited production in this case and was therefore the major bottleneck inhibiting further NPV improvements in the initial cases studied, particularly as it would be difficult to reject or stockpile low-grade ore underground or separate it from higher-grade ore before sending it up the main shaft. However, individual production half-levels and the development stopes had some flexibility in capacity, and there were definite opportunities for cheap de-bottlenecking of some sections of the processing plant. Following determination of the optimum mining width (this term is used synonymously with 'stoping height'), investigations of NPV for the current operational production capacity focused on:
Figures 9 to 11 compare the production profiles of three optimization runs with similar input parameters. For each set of three graphs, the same scales have been applied (i.e. the major graduations on the y axis represent the same quantities) to make the comparisons as realistic as possible without actually showing the projected production figures.
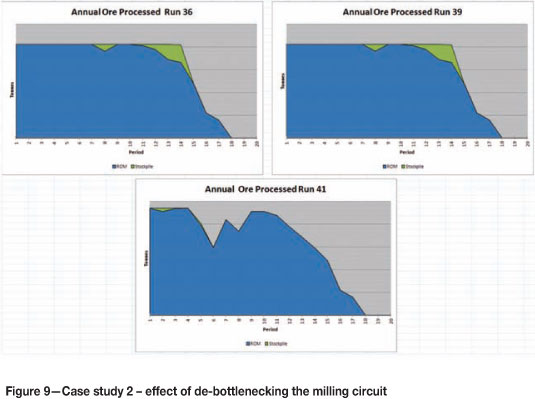
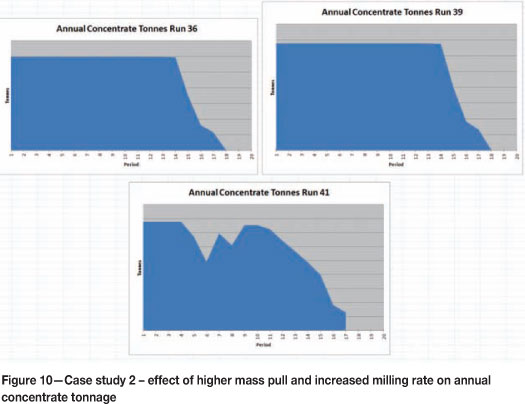
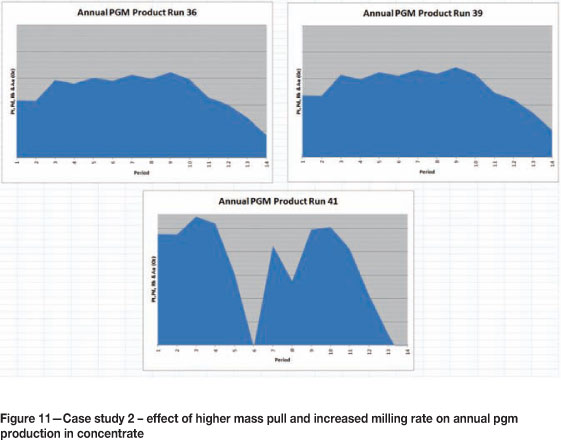
Figure 9 shows that run 36 and run 39 applied the same maximum annual ore feed capacities to processing, whereas run 41 included de-bottlenecking of the milling circuit. For a small outlay of capital it was expected that the plant would be able to process slightly more ore each year without sacrificing recovery in the flotation circuit. Run 41 therefore showed increased processing capacity in most years, and also identified that the underground development plan would be unable to match the ore requirement for processing in some years.
Figure 10 shows that in runs 39 and 41 a higher concentrate mass pull was used in the optimization model in comparison with Run 36. Run 39 produced more concentrate at a lower grade than run 36; run 41 retained the lower grade and higher recovery of run 39 but produced even more concentrate in the early years of the schedule due to the faster milling rate. Since the operation was processing a finite amount of ore, the overall quantity of concentrate generated in run 41 over the whole life of mine was the same as in run 39.
Figure 11 illustrates that both of these mechanisms advanced the rate of production of PGM and hence also of cash. The scale used has been manipulated to make it easier to see the differences between the graphs, and the vertical scale does not originate from zero. Run 39 generated slightly more PGMs every year than run 36 due to the higher mass pull enhancing the recovery in the flotation circuit. This is a viable strategy for most PGM producers as long as the downstream smelter capacity is sufficient to handle the extra concentrate. Run 41 produced considerably more PGMs in most of the first ten years of the schedule, after which production dipped sharply. The higher processing rate in this run would cause PGM recovery to drop and more metal to be discarded to the tailings dam, but would also enable faster production of PGMs contained in increased amounts of concentrate.
The final portion of this study looked at a potential expansion of current operations, involving development of two additional adjacent orebodies and either expansion of the current plant or construction of a new plant. The technical and cost data available to prepare these scenarios for the optimizer were somewhat preliminary, so none of the results can be reported here. However, in principle the model was established to test how to prioritize the existing and new mining operations, and also to determine how large the new plant should be to produce the optimum NPV.
Case study 3
Scope of study
The third case study in which the author assisted relates to a significant underground mining operation of a large nickel and PGM producer8. This operation extracts ore via a single large shaft but operates approximately twenty half-levels as discrete business areas (i.e. defined mining sections for which production and cost reports are generated), and currently schedules mining from these using a complex yet relatively unsophisticated spreadsheet-based model aiming to produce a blended mixture of ore from many locations, each of which has different contained minerals and diverse metal content. This enables the downstream concentrators to produce a consistently suitable feedstock for smelting. At this operation, this is crucial to achieve satisfactory metallurgical and cost performance in the smelter, avoid damage to the refractories, and ensure that environmental emissions (e.g. sulphur dioxide) remain within the approved limits. The model is used for both short- and long-term planning.
Historically, the model has worked well, but was facing challenges in forecasting utilization of the shaft hoisting capacity in every year of the latest business plan, which incorporated preliminary plans to increase hoisting capacity.
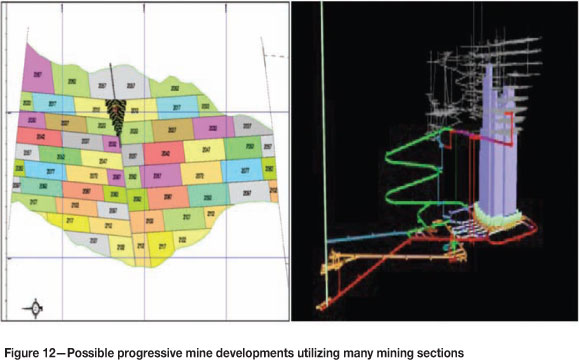
Figure 12 illustrates possible mine structures in the PGM and nickel industries. The main shaft location is shown near the centre of the diagram on the left, with half levels identified on either side. In the PGM industry this would typically be a plan view of an incline shaft with the half levels proceeding down dip from top to bottom on the diagram. However, depending on the size and shape of the orebody this principle could also be applied to a steeply-dipping orebody and a vertical shaft, for example as shown in the right hand diagram in Figure 12. Ideally, the operation would like to produce from all open sections of the mine at full capacity to keep unit costs down, and also fill the shaft hoisting capacity with the best ore available in order to facilitate optimized cash generation. However, the more open mining areas there are, and the more mineralogical or other constraints are imposed on the ore to be hoisted for processing, the more difficult this scheduling challenge becomes.
In this case the scope of work was to assess the current life-of-mine plan by replicating it to produce a consultant's base case, then to provide proof of concept for possible future optimization work by testing several of the standard enterprise optimization mechanisms.
Qualitative description of the results of case study 3
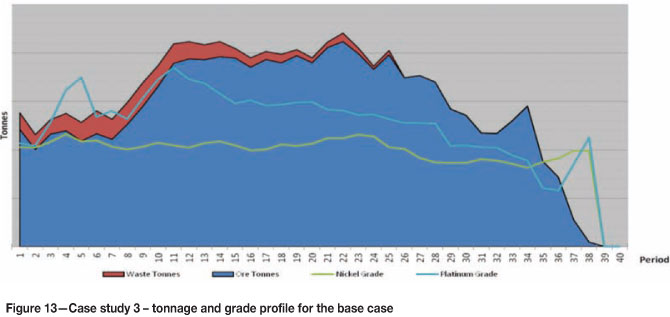
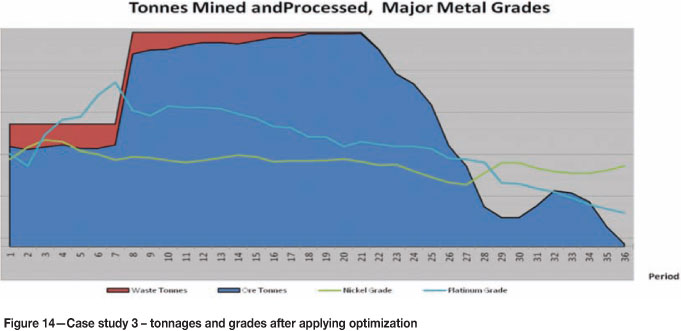
The base case was developed using the existing financial model and life-of-mine (LOM) plan, including all twenty of the selected mining sections. Current and planned hoist limits were applied as appropriate, then mine development time and cost, mining and processing recoveries and costs for each section, as well as downstream cost and revenue data applying to ore processed from any section were applied to generate a LOM schedule by section and for the overall operation. The overall tonnage and grade profile for the mine is shown in Figure 13. A declining grade profile can be seen clearly even in the mine's business plan, on which this base case is closely modelled. The next steps were:
Figure 14 uses the same vertical scale as Figure 13 and shows the effect of these changes. Tonnage hoisted achieves the maximum possible each year, resulting in a slight decrease in the time to exhaust the defined orebody. Nickel grade peaks earlier and at a higher level than previously. Both of these changes would result in cash flow being brought forward.
Case study 4 Scope of study
This was a portfolio optimization carried out on behalf of a major producer of nickel with by-product PGMs, which was refreshed on a number of occasions to enable the owner to update the overall business plan for the combined operations3. Since this work took place over several years, the description here is limited to a brief overview rather than a description of successive phases of the work.
The company in question operated a large open pit and three underground mines at the time, with the ore mined from these being supplemented by ore purchased from small operations operated by others and potentially also from low-grade stockpiles. The mining operations were dispersed over a sufficiently large geographic area to make it essential for each main operation to have its own sulphide ore concentrator. There were therefore three concentrators in operation, each treating a variable blend of feedstocks and with different flow sheets, metallurgical performance, and cost structures. The concentrate from these plants was transported to a central smelter and a refinery capable of producing final base metal products and small quantities of PGMs in intermediate products to be refined by others. The capacity of the smelter exceeded that of the refinery, necessitating some sale of smelter matte.
In addition to current operations, the owner was considering development of an additional open-pit mine and two new underground operations. These would mine and process a mix of sulphide ore amenable to conventional metallurgical processing and some material for which pressure leaching at the refinery was being considered as an alternative to smelting.
In summary, it was therefore possible to apply all ten of the enterprise optimization mechanisms to this portfolio of operations and projects, both at an individual operational level and across the whole production and value chain.
The results illustrated in this report are from an intermediate stage of investigation and do not necessarily represent the final outcome. Broadly, however, the objective was to prepare an overall global optimization for the entire operation, using input data from the latest block models, pit and mine designs, process design criteria and capacity limits, and commercial forecasts, all supplied by the owner's team. The following issues specifically needed to be addressed in order to achieve the optimum solution:
The overall solution in this case was influenced to the greatest extent by the refinery and smelter constraints, therefore the trends illustrated commence from the end of the process and work back towards the mining operations.
The complexity of the computational linear programming (LP) problem in this case was explained as follows2: 'The optimiser controlled 37 mining sequences, 37 material types with 16 grade attributes, through 18 processing paths, to produce potentially 16 different concentrates with 52 attributes (representing the detailed outcomes of the various downstream options) to produce potentially 14 products.
'The optimiser controlled mining rate and location, cut-off grade and stockpiling, choice and calibration of concentrator, blending of concentrates into downstream plant, production volume mix and specification, over the 30 year planning horizon within the business constraints specified.
'The optimiser typically took about twenty steps between hypercubes to find an NPV local maximum from an initial randomfeasible schedule. Each step required the solution of aroundfour LPs with an average of 500,000 variables, 100,000 constraints and 200,000 non-zeroes. Each sample took about two hours in a 3GHz Pentium 4. Approximately sixty per cent of this time was spent in solving the LPs.
'After between 100 and 200 samples, the top ten results had NPVs within 0.1% of each other, which provided sufficient confidence that the global maximum NPV had been identified. This model, which was optimized a number of times, was generally run on four to eight PC's simultaneously to minimise elapsed time.'
Trends observed in case study 4
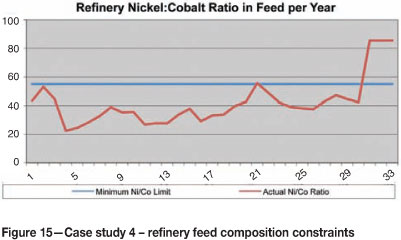
Figure 15 shows an observation that could have encouraged more than one possible outcome. The optimizer had been given the freedom to maximize revenue from the refinery without many constraints. In this instance nickel was the greatest contributor to revenue, so the selected schedule encouraged mining of ore and production of concentrate with the highest possible content of nickel. The nickel refining capacity of the refinery was not infringed, but the amount of cobalt fed to the circuit would have exceeded the cobalt removal and refining capacity. The possible corrective action here could be to change the ore mix to reduce the percentage of cobalt in refinery feed, or alternatively to de-bottleneck the small cobalt processing circuit.
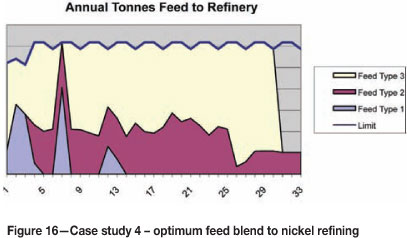
As well as there being several possible nickel products for sale, the refinery could potentially accept three different feedstocks: smelter matte, concentrate, or mixed sulphide precipitated from a low-pressure leach process. The optimizer was able to determine the best mix of these three feed materials each year of the LOM schedule while still complying with the overall capacity limit for the tonnage to be fed to the refining circuit. As can be seen in Figure 16, the blend proposed varied from year to year.
As mentioned earlier, the portfolio included several mines and concentrators operated by the owner that could also buy in flotation concentrate from third parties. The grade, Ni:S ratio, and MgO content of the concentrate blend fed to the smelter needed to be controlled both for technical reasons and in the interests of increasing cash flow. Figure 17 illustrates the optimized concentrate production profile for one of the smaller mines. The concentrate from this operation had a very low MgO content and MgO:Fe ratio, whereas some of the other concentrates had much higher MgO:Fe ratios. Since the smelter had a technical requirement to keep MgO:Fe ratio in feed beneath a specified minimum, the optimum schedule shown in Figure 17 proposed reserving some of the concentrate from this operation for several years before using it as smelter feed. This would probably require this operation to be idled for several years, which could clearly present some practical problems for the operators. The net benefit would have to be measured against the operational issues before taking a decision about this.
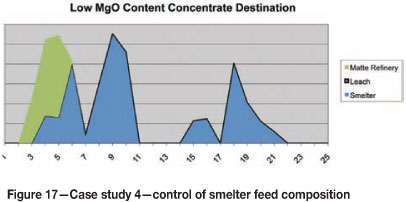
Figure 18 includes two charts showing how the optimization process balanced mine production with concentrator capacity. On the left-hand side, the graph shows ore feed from two open pits to a concentrator with a planned expansion in year 7 of the schedule. As can be seen, the optimum tonnages from each pit to the concentrator varied considerably from year to year and the ore mining capacity of the two pits matched or exceeded the plant capacity. The right-hand side chart, in contrast, shows a situation in which two underground mines were unable to keep a shared concentrator fully supplied with ore feed. In practice there would usually be an attempt to transfer ore from one concentrator to another, but in this instance the optimizer rejected this due to the distance between them and the ore transport costs.
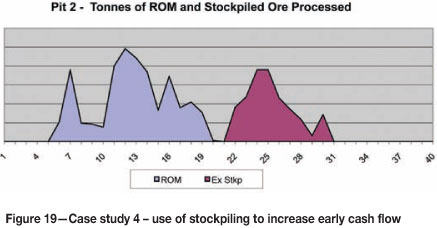
Figure 19 shows the typical application of the stockpile optimization mechanism. Higher value ore (due to grade, mineralogy, strip ratio, or a combination of these factors) from one of the open pits was processed in the early part of the schedule, with lower grade ore being reclaimed slowly later at the rate consistent with available downstream processing capacity each year.
Conclusion - implementation of recommendations
The case studies in this paper tested the capabilities of enterprise optimization in many different ways, and in each case some innovative and frankly surprising or counter-intuitive results were produced. The work was carried out for organizations of different levels of complexity operating in diverse cultural environments. Notwithstanding this, the author generally encounters similar issues each time a study is presented, and the conclusions need to be considered by the owners' team for possible implementation. The potential barriers to implementation are quite numerous. However, observation of the four case studies discussed here suggests that the following generic approach to implementation could be reasonably successful in most cases:
The potential implementation team needs to be involved in the initial framing of the scope of work and objectives of the optimization study. This includes participation in the initial kick-off meeting.
The owner should appoint a single point of contact to manage data transfer, ensure participation of a core team throughout the study, and liaise with the operations management team concerning the progress and the results. This person and other core team members should attend an optimization course or workshop to ensure that they understand the basic principles and mechanisms.
The participants in the owner's core team must be representative of all departments throughout the full range of the operations and any expansion projects. This is crucial, because decisions made by any single department cannot be made in isolation since they have an impact on the performance and optimum operating conditions of other departments. This also applies to operating divisions of a large enterprise.
At the end of the study phase of the optimization work, the results need to be presented to executives and also the management team likely to be responsible for implementing the recommendations, in a format that is familiar to the owner and with potential benefits clearly identified. The recommendations need to be in compliance with all constraints and limits set by the owner's team and must be practicable to implement. The biggest potential wins should be identified at this point and if possible prioritized for implementation first. If these are successfully implemented and the gains can clearly be seen, further implementation of lesser benefits will be much easier to motivate.
The recommendations will in most cases not be based only on NPV. Although the sole objective function for enterprise optimization is maximization of discounted cash flow, this does not mean that it is impossible or even difficult to produce tables and charts tracking other metrics (e.g. cost per ounce of PGMs produced) that may be of interest to the owner's management team and which may be used by executives from time to time to support presentations to analysts and investors. These other stakeholders in the operation need to be convinced of the benefits of the proposals.
Having decided which recommendations may be appropriate to be adopted, the owner's team will usually need to put in place a change management exercise. This is likely to be a challenging phase and is beyond the scope of this paper to discuss, but if done well it could result in the great majority of the identified potential benefits being realized.
References
1. Whittle, G. and Burks, S. Simultaneous mining and mineral processing enterprise optimization for the platinum industry. Fourth International Platinum Conference - Platinum in Transition 'Boom or Bust'. Southern African Institute of Mining and Metallurgy, Johannesburg, 2010. pp. 329-338.
2. Whittle, J. and Whittle, G. Global long-term optimisation of very large mining complexes. APCOM 2007. Proceedings of the 33rd International Symposium on Application of Computers and Operations Research in the Mineral Industry, Santiago, Chile, 24-27 April 2007. Magri, E.J. (ed.). pp. 252-260. [ Links ]
3. Whittle, G. Confidential enterprise optimisation study reports, presentations and optimisation output worksheets, Case study 4. Whittle Consulting, Melbourne, 2004-2005. [ Links ]
4. Whittle, G. Global asset optimisation. Orebody Modelling And Strategic Mine Planning Conference, Perth, Australia, 2004. Pp. 361-365. [ Links ]
5. Burks, S. Confidential enterprise optimisation study reports, presentations and optimisation output worksheets, Case study 1 phases 1 to 3. Whittle Consulting, Johannesburg, 2010-2011 [ Links ]
6. Hanson, N, Hodson, D., and Mullins, M. Skin analysis in the selection of final pit limits. Strategic Mine Planning Conference, Perth, Australia, 2001. pp. 129-132. [ Links ]
7. Burks, S. Confidential enterprise optimisation study reports, presentations and optimisation output worksheets, Case study 2. Johannesburg, 2010-2011 [ Links ]
8. Peevers, R. Confidential enterprise optimisation study reports, presentations and optimisation output worksheets, Case study 3. Grass Valley, CA, 2010-2011. [ Links ]
© The Southern African Institute of Mining and Metallurgy, 2013. ISSN 2225-6253.
This paper was first presented at the 5th International Platinum Conference 2012, 18-20 September 2012, Sun City, South Africa.

