


Services on Demand
Article
 English (pdf)
 Article in xml format
 Article references
Indicators

Related links
-
 Cited by Google
 -
 Similars in Google
Share

 Permalink
Journal of the Southern African Institute of Mining and Metallurgy
On-line version ISSN 2411-9717
Print version ISSN 2225-6253
J. S. Afr. Inst. Min. Metall. vol.113 n.3 Johannesburg Mar. 2013
PLATINUM CONFERENCE 2012
Case study on quantitative risk modelling to obtain a realistic risk-adjusted project valuation
G.R. Lane; M. Terblanche; G. Meyer; N. Sasto
Cyest Corporation
SYNOPSIS
A large opencast gold mining company in Africa had just completed a feasibility study for an expansion of the operations. A traditional net present value project valuation methodology had been used that showed a very positive net present value (NPV). The project team had conducted a qualitative risk assessment that identified and logged all potential project risks and had subjectively incorporated 'risk' via the discount rate and other assumption contingencies around gold price expectations, operating parameters, etc.
Management requested that an independent quantitative risk modelling approach be adopted to obtain a better understanding of the impact of risk on the overall project valuation and confidence level in the final valuation.
A detailed project valuation model was configured in the Cyest Carbon Modelling Technology platform, and the stochastic modelling module used to perform the Monte Carlo simulations.
Analysis of historical operational performance data relating to actual achievements versus planned and budget determined the historical variability of the underlying parameters as well as variance to budget. This was done at a detailed level for mining rates and costs, processing rate, costs and recovery, and other operational efficiency measures.
External market assumptions relating to gold price, exchange rate, and inflation were modelled and the dependency between them modelled using a copula.
This case study will demonstrate the approach taken to building and populating the quantitative risk model and the overall results of the Monte Carlo simulation.
The final valuation demonstrated that the project had a 44 percent probability of an NPV less than zero i.e. a 44 percent chance of project finance loss.
Keywords: risk modelling, project valuation, NPV.
Introduction
This paper describes, using a case study, the use of a quantitative risk modelling approach for a capital project valuation. This approach was used to obtain a realistic assessment of the expected variability and confidence limits in the project valuation, as well as the downside risk of the project, i.e. a net present value (NPV) less than zero). Management strategies to mitigate risk could then also be assessed in terms of risk and reward.
The name of the mining house and project have not been included in this case study as the client did not wish it to be mentioned. The actual project valuations have been excluded, but the variability, probability distributions, and associated risk outputs have been included to explain the principles and outputs from the exercise.
The client is a major African-based opencast gold mining operation that had just completed a feasibility study for a major expansion project. The expansion would not only increase the milling capacity of the plant but would create the ability for the mine to process varying size distribution of materials, which would allow flexibility to treat material more optimally by removing blending constraints. The project team had conducted a traditional NPV project appraisal that showed a very positive project valuation.
The client requested an independent assessment of project valuation that incorporated a quantitative assessment of the underlying project risks associated with the operational, project, and external price parameters. The client required a quantitative view on the risk and return of the expansion on the mining operation.
Cyest were employed to carry out quantitative risk modelling of the project to determine the risk-adjusted NPV, the project downside risk, value-at-risk, and impact of different risk mitigation strategies.
Incorporating risk into a project valuation
For most mining projects, a large amount of upfront capital investment is required to establish the mine, with the resulting cash flow from the mine being realized in some instances only years later once the project has been implemented and the mine is operational.
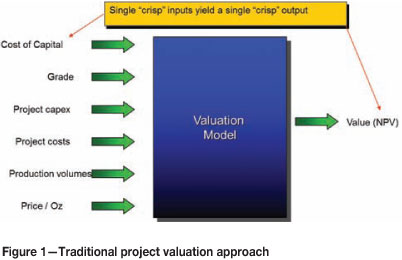
The decision to invest the capital generally would require a valuation of the project to be done to assess the return on the project expressed as NPV, internal rate of return (IRR), payback, profitability index (PI) etc. Profitability index is the amount of nett return for every unit of capital investment  . This would generally require a study to be carried out to design the technical and operational aspects of the mine and a mathematical model built and populated with the project variables to do a financial valuation. This valuation would require the mining parameters and operational parameters such as expected production rate, grade, operating costs and recoveries, the quantities surveyors' capital estimate, and assumptions around expected prices and other global financial assumptions.
Uncertainty in all of these underlying variables associated with capital, operating the mine, and external market assumptions, leads to project risk. In addition, subjectivity around all project assumptions may also lead to an unrealistic NPV due to optimistic or pessimistic assumptions.
Kahneman and Tversky (1979) mention a systemic fallacy in planning and decision-making whereby people underestimate costs, completion times, and risks of planned actions, whereas they overestimate the benefits. This is referred to as 'optimism bias' or 'strategic misrepresentation', where the former is a cognitive predisposition found in most people to judge future events more positively than their experience warrants. The latter, when forecasting the outcome of projects, is where planners may deliberately and strategically overestimate benefits and underestimate costs in order to increase the likelihood of their projects being approved when there is competition for limited funding. The latter is deliberate, the former is self-deception, but in both instances the results are the same - inaccurate valuations.
Techniques for assessing risk
This paper is not intended to research all possible techniques for assessing and incorporating risk into a project valuation. Therefore it will only make mention of the techniques known to the authors in their experience and the rationale for choosing the quantitative approach explained in this case study.
The following are techniques that could be utilized:
Qualitative risk assessment- This approach is widely used as part of the enterprise risk management methodology adopted by most major companies around the world. This involves a risk assessment process where all risks are identified, and depending on the methodology employed, these are assessed and assigned weightings using different qualitative measures (impact, likelihood, cost etc.). These risks are then prioritized and managed as part of the project by assigning them to risk owners and managing the mitigation steps such that the likelihood and impact are managed. This assessment is generally very subjective and based on individual and collective experience, and does not include a quantitative view of the overall impact on the project valuation
This process is repeated many thousands of times. Computer software has made this technique available to most business users. A quantitative risk model calculates the impact of the uncertain parameters on the project outcomes such as NPV, profit, and other metrics. Such a model can help management quantify the impact of uncertainty of the underlying variables and the consequences of different mitigation decisions. For example, if the project is dealing with uncertain market demand, commodity pricing, and variability in production and materials costs at the same time, it can be very difficult to estimate the impacts of these factors on the NPV. Monte Carlo simulation in essence analyses thousands of 'what-if' scenarios, often yielding surprising insights into what can go right, what can go wrong, and what we can do about it.
This quantitative approach was therefore adopted for this investigation for its explicit modelling of the underlying risks and the ability to quantify the risk and variability in the output variables.
Case study: quantitative risk modelling for a gold mining expansion project
Background
An opencast mining operation in Africa had just completed a feasibility study for a major expansion project that included an increase in the milling capacity of the plant. This included being able to process varying size distribution of materials, which would allow flexibility to treat material more optimally by removing blending constraints. The project team had conducted a traditional NPV project appraisal that showed a very positive project valuation.
The company executive management requested that an independent project valuation be undertaken that also incorporated a quantitative view of the underlying project risks and how these impacted the project valuation and confidence level in the valuation.
Cyest Corporation has had 10 years of experience with economic modelling in the mining industry and has been working with this client doing modelling for many years, and therefore was requested to perform the quantitative risk modelling exercise.
Quantitative risk modelling approach adopted
The project team had undertaken a traditional NPV-based project valuation where the underlying production, operational, capital, and external market assumption variables were combined into a mathematical model to generate a cash flow forecast that was discounted using an agreed hurdle rate to calculate an NPV.
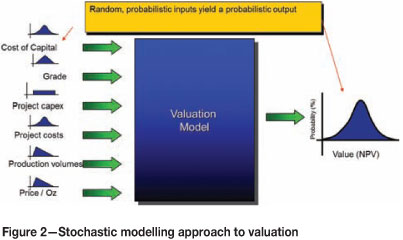
Cyest Corporation recommended to the company a stochastic or Monte Carlo simulation modelling approach. This would take into account the variability and uncertainty in the underlying assumption variables for the project and result in a probability-adjusted project valuation that would also give a view on downside risk (NPV<0) and allow confidence limits to be determined.
The uncertainty in the external market assumptions around gold price, exchange rate, and inflation would be modelled using a copula, which is an actuarial term for the non-linear relationship modelling technique used to model the dependency between these three variables.
The modelling methodology
A mathematical model of the underlying dynamics of the mining and processing activities was built to accurately depict the cash flow from the operation taking into account the operating parameters.
This model was built in Cyest's object oriented modelling platform, called the 'Carbon Modelling Technology'. The stochastic module was utilized to carry out the Monte Carlo simulation.
A monthly model was built for the life of mine in real money terms (i.e. in today's money) and excluded any tax calculations. The final output of the model was a discounted cash flow (DCF).
The following were operational inputs into the model:
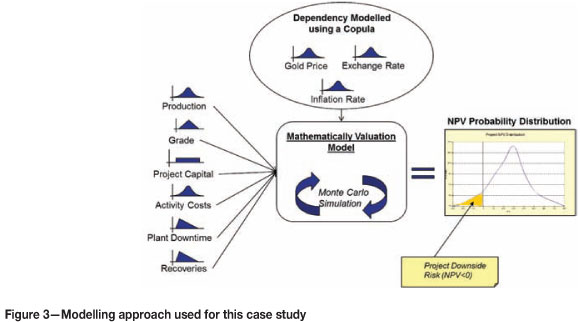
The following external market parameters were modelled using a copula which is an actuarial technique that models the dependency and non-linear relationship between these variables:
Determining variability and uncertainty in all project variables
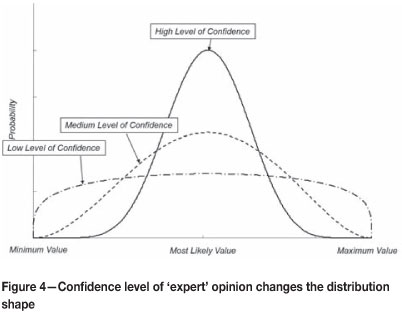
The stochastic nature of the inputs includes uncertainty or level of confidence (where information is lacking) and natural system variability (i.e. the variability in plant recovery factor or grade etc.).
The methodology adopted to determine the probability distributions were a combination of the following:
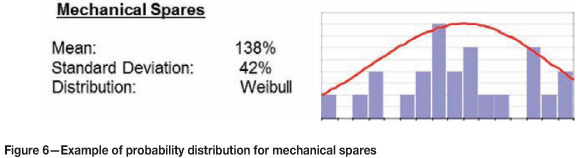
Cost parameters
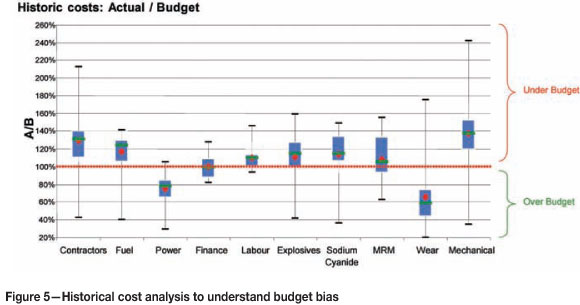
Historical analysis was done on all the activity costs for both mining and processing to understand the following:
The following statistical models were fitted to the data where applicable using statistical curve-fitting software:
- Lognormal
- Pareto
- Weibull
- Gamma
- Paralogistic
- Normal
- Inverse Gaussian.
The process to determine the best models to use was as follows:
An example probability distribution is shown in Figure 6. The results showed that generally costs have been under-budgeted and the actuals showed significant variability relative to the budgeted amount.
Operating parameters
The expansion of this operation did not introduce any new technology or mining techniques, and therefore the current performance parameters relating to variability in production rate, grade, recoveries, and plant throughput were deemed to be a representative proxy for the performance variability of the underlying variables after expansion.
The same technique as described for all costs was adopted for the operating parameters.
The results showed that head grade, tonnages, and recovery have been over-budgeted, but to a far less degree to costs, and depict a much higher degree of predictability (low variation relative to budgeted numbers).
External market assumptions
The external market assumptions were modelled as follows: Interest and inflation rate
The Hull-White model (HWM) was utilized to simulate the short rate and inflation rate for the US dollar and South African rand.
The HWM is a single-factor, no-arbitrage yield curve model in which the short-term rate of interest is a random factor or state variable. By no-arbitrage, it is meant that the model parameters are consistent with the bond process implied in the zero coupon yield.
The model assumes that the short-term rate is normally distributed and subject to mean reversion. The mean reversion parameters ensure consistency with the empirical observations that long rates are less volatile than short rates. The use of the normal distribution affords a good deal of analytical tractability, thereby resulting in very fast computation times relative to competing no-arbitrage yield curve models.
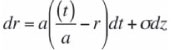
where
r: short-term interest rate
a: rate of mean reversion
![]() : long-term rate
: long-term rate
ς: volatility parameter
z: Brownian motion
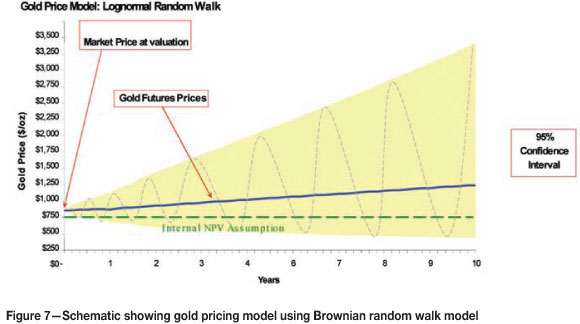
Commodity prices
The geometric Brownian random walk model was selected to model the gold price in US dollars.
A considerable amount of evidence has been produced to demonstrate that in a highly competitive and organized market, price changes will be close to random. The empirical results indicate considerable support for the random walk model of gold prices. The price reflects all the available information available to participants in the market and all changes in the price are independent of any past history of the price.
In order for the model to be no-arbitrage, the model was calibrated to the futures prices as at the valuation date. The volatility was estimated using historical gold price movements.
The gold futures prices generally depicted a linear relationship between price and term, and this was used as the extrapolation model. This effectively assumes that the relationship between risk-free rate, convenience yield, and storage costs (NACC) will continue to exhibit the relationship by term.
Exchange rate
The modelling exercise was undertaken in US dollars as this was the dominant currency for most of the underlying cash flows. Therefore an exchange rate model was not required.
Dependence between the economic market ariables
A Gaussian copula was used to model the dependence between the economic factors.
Results from the exercise
The model ran 10 000 iterations for each simulation run and the results were analysed.
The results of the simulations show the risk-adjusted valuation of the current operation as well as the impact of expanding the operation and the likely range of NPV results. This would allow management to assess the effects of the expansion on the risk as well as the upside potential.
In order to practically assess the level of risk associated with the project, some measures were used that can intuitively and theoretically capture the risks that management are concerned about.
Three measures of risk were therefore chosen which, while they may not be completely 'coherent' in the mathematical sense (Artzner et al., 1999), provide intuitive quantification of the risks associated with the mine.
These are:
In summary the results were as follows.
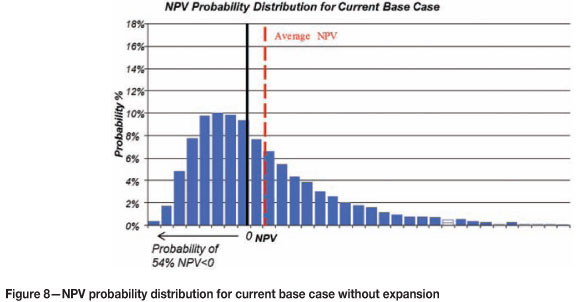
Current base case
The base case scenario (status quo do nothing case) for the existing life of mine was first analysed using the Monte Carlo simulation model.
This yielded a probability distribution with the most likely NPV. What was very interesting was that the probability of the NPV being negative was 54.5 percent based on the simulation model.
This was quite a shock to the executive, who had not previously appreciated the extent of the downside risk of the current operations.
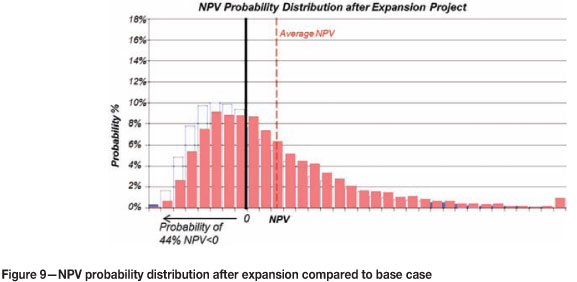
Expansion project
The results from the simulation exercise on the operation, including the expansion project, showed a shift of the NPV to the right (i.e. higher NPV), thereby showing an increase in the probability of the operation making a profit and decrease in the probability of making a loss.
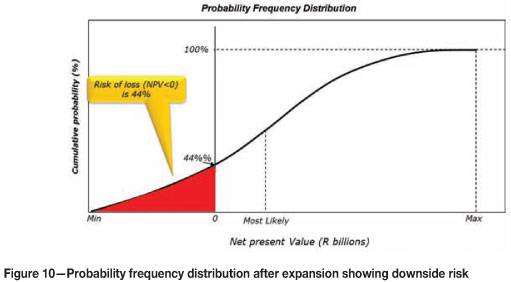
The most likely NPV showed an increase of 126 percent from the original base case and a reduction in downside risk (NPV<0) to 44.1 percent.
This demonstrated that the expansion will create value without incurring any additional risk (actually reducing risk).
Comparison to the project team's traditional valuation approach
When comparing the most likely NPV achieved compared to the 'single value' NPV calculated by the project team, it became apparent that the most likely NPV from the simulation was 28 percent higher than what the project team calculated.
The project team had taken a very optimistic view on all the operational parameters that they could control, such as production rate, costs, efficiencies, capital, and recoveries. This probably showed a level of optimism bias as explained earlier in this paper. When it came to the assumptions around market parameters such as gold price, inflation etc., the team had taken a very pessimistic view, as far as to say that the gold price assumption used was even lower that the forward-looking hedged gold price. This pessimistic view on the external market assumptions resulted in an overall lower NPV.
What was not apparent from the traditional NPV approach, though, was that the project had a 44 percent chance of an NPV below zero and therefore project financial failure. This came as quite a shock to the project team and management of the operation and was deemed too risky.
Risk mitigation through management interventions
The NPV of the base case and expansion project make no allowance for the management interventions that could be taken to limit downside risk. In terms of risk mitigation, management actions can limit losses by either shutting down or adjusting cut-off grade according to the economic environment.
Excluding these two strategies can seriously overestimate the risk and underestimate the rewards of the project.
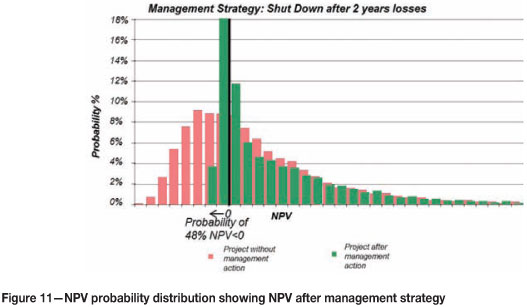
Mitigation strategy - shut-down period
The strategy of shutting down the mine after making two annual consecutive cash-flow losses was modelled. The shutting down costs were modelled, and it was assumed that all fixed costs would continue for a further year after shut-down.
This resulted in a significant increase in the NPV of the project by 24 percent. Interestingly, the value-at-risk reduced significantly, but the probability of the NPV being less than zero actually increased to 48 percent.
The reason for this increased downside risk is that while the management strategy has prevented small losses from turning into large ones (i.e. shut the mine after 2 years of loss), it also then excludes the possibility of recovery. The additional 4.7 percent of downside risk represents the scenario that after two years of losses, the project could actually have recovered to make an eventual profit if the management intervention had not been adopted.
But the effect of this management strategy is more accurately depicted by the 99 percent value-at-risk. Intuitively, the management strategy has reduced the risk of large losses. There may still be negative NPVs, but their impact in terms of severity has been reduced by shutting down the mine after two years of loss.
Figure 11 shows this dynamic very well, where the NPV probability distribution shows a high probability of NPV below zero but a much smaller magnitude of negative NPV.
This analysis highlights the need for a risk measure that captures the tail of the risk. In this case, the VAR measure is much more effective in capturing the reduction in risk as a result of the management strategy.
Running this strategy for the current operations (i.e. base case before expansion) also increased the NPV, with similar results for VAR and downside risk.
Mitigation strategy - reserve flexing
A reserve flexing strategy was applied where the cut-off grade, and therefore average grade mined, is adjusted based on the gold price. In the model it was assumed that this could be done only once a year and that capital expenditure was also adjusted.
This strategy showed a 3 percent increase in the NPV and a very slight reduction in the probability of the NPV being less than zero.
Mitigation strategy - hedging the gold price
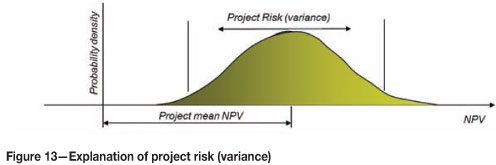
An attribution analysis of the underlying variables to understand how the variability in these variables contributes to the overall NPV risk (variability in NPV) showed that the largest contributor was the variability in the gold price (Figures 12 and 13).
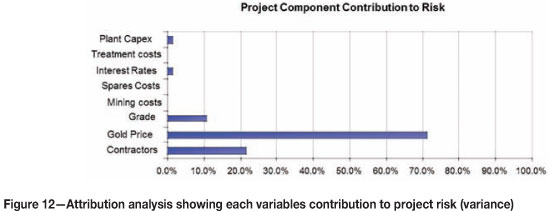
Interestingly, the second largest contributor was contractor costs, and reflects the historical actual versus budget bias experience. In the past, the actual costs for contractors have been on average 44 percent higher than budgeted and with a very large variability.
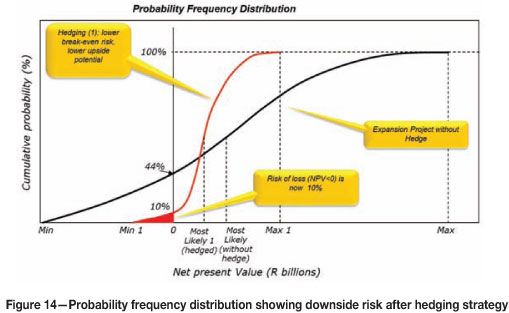
Therefore, due to the operation and expansion project having almost 50 percent chance of having an NPV less than zero and with the largest contributor to this variability being the gold price, a hedging strategy may be an appropriate mitigation strategy.
Running this strategy resulted in a reduction in the NPV of only 5 percent but reduced the probability of the NPV being below zero to only 10 percent. Obviously this strategy locks in the gold price, so that any gold price upside, and therefore upside in NPV, is also not realized.
If the operation did not have a probability of the NPV being negative, then it would be better to allow the variability in the gold price so as to also realize any upside potential.
Final conclusion
With the uncertainty (i.e. risk) surrounding projection of cash flows and economic market assumptions, traditional NPV-based project valuations using 'single figure' input assumptions have tended to use a 'conservative' approach to determining inputs. This conservatism tends to be subjective and in general unquantifiable.
In this case study the project team had derived a positive NPV for the expansion project that they deemed to also realistically represented the risks via the discount rate and other project input assumptions.
The quantitative risk modelling approach, using Monte Carlo simulation, assisted management to understand quantifiably the impact of the underlying risks on the project valuation. This approach allowed a more objective set of input variables, and modelled explicitly the uncertainty and therefore the risks associated with these variables.
This approach actually yielded a NPV 28 percent higher than that done by the project team, mainly due to their pessimistic view on the external market assumptions that were out of their control. But this exercise demonstrated that the expansion project had a probability of an NPV less than zero of 44 percent, which the client deemed to be too high.
Different management strategies to mitigate this risk were simulated to test the impact on the most likely NPV and downside risk of the project (NPV<0). This demonstrated that management interventions to limit the downside risk before and when they occur can significantly reduce the likelihood of an NPV less than zero.
This exercise also highlighted that in some instances a gold hedging strategy makes sense to limit downside risk, which in this case reduced the risk of project failure from 44 percent to 10 percent, but this also removes the potential for upside exposure. It is often argued that shareholders in a gold mining company expect exposure to the external market factors such as gold price, and therefore removing this exposure may destroy shareholder value.
This exercise was able to quantify to the client the actual risks associated with the operation in monetary terms so that the most appropriate investment decision could be made taking all assumptions and mitigation strategies into account.
Acknowledgements
The authors would like to thank the client and project team for allowing the Cyest team access to conduct this quantitative risk modelling exercise, to the people that work at Cyest who have the intellect and conceptual abilities to be able to solve complex modelling problems such as this, and Nathan Sasto, who managed this project.
References
Artzner, P., Delbaen, F., Eber, J., and Heath, D. 1999. Coherent measures of risk. Mathematical Finance, vol. 9, no. 3. pp. 203-228. [ Links ]
Ballington, I.R., Bondi, E., Hudson, J., Lane, G., and Symanowitz, J. 2004. A practical application of an economic optimisation model in an underground mining environment. Ore Body Modelling and Strategic Mine Planning, Perth, November 2004. Australasian Institute of Mining and Metallurgy.
Ballington, I.R., Smith, G.L., Lane, G.R., and Hudson, J. 2005. The systemic interdependency of closure decisions at shaft level. First International Seminar on Strategic vs. Tactical Approaches in Mining, Sandton, South Africa, September 2005. [ Links ]
Black, F. and Scholes, M. 1973. The pricing of options and corporate liabilities. Journal of Political Economy, vol. 81. pp. 637-654.
Bondi, E. Applying modelling and simulation technology to add value in the mine planning environment. Cyest Corporation, internal white paper. 2002.
Dimitrakopoulos, R.G. and Abdel Sabour, S.A. 2007. Evaluating mine plans under uncertainty: Can the real options make a difference? Resources Policy, doi:10.1016/j.resourpol.2007.06.003
Flyvbjerg, B., Mette, K., Holm, S, and Buhl, S.L. 2005. How (in)accurate are demand forecasts in public work projects? The case of transportation. Journal of the American Planning Association, vol. 71, no. 2. pp.131-146.
Hudson, J.H.K., Maynard, M., and Kloppers, B. 2008. The application of economic modelling to enhance decision-making at Lonmin. Third International Platinum Conference 'Platinum in Transformation', Sun City, South Africa, 5-9 October 2008. Southern African Institute of Mining and Metallurgy, Johannesburg, 2008. pp. 343-348.
Kahneman, D. and Tversky, A. 1979. Intuitive prediction: Biases and corrective procedures. Management Science, vol. 12. pp. 313-327.
Kaufmann, R., Gadmer, A., and Klett, R. introduction to dynamic financial analysis. ASTIN Bulletin, vol. 31, no. 1. pp. 213-249. [ Links ]
Lane, G.R., Sasto, N., and Bondi, E. 2007. Economic modelling and optimisation application in the mining Industry. MRM Conference, September 2007. Southern African Institute of Mining and Metallurgy, Johannesburg.
Lane, G.R., Hudson, J.H.K., and Bondi, E. 2006. Implementation of an economic model at Gold Fields Limited. Journal of the Southern African Institute of Mining and Metallurgy, vol. 106, no, 12. pp. 807-812. [ Links ]
Merton, R.C. 1973. Theory of rational option pricing. Bell Journal of Economics and Management Science, vol. 4, no. 1. pp. 141-183.
Neely, J. E. and De Neufville, R. 2001. Hybrid real options valuation of risky product development projects. International Journal of Technology, Policy and Management, vol. 1, no. 1. pp. 29-46. [ Links ]
Shafiee, S., Topal, E., and Nehring, M. Adjusted real option valuation to maximise mining project value - A case study using Century Mine. Project Evaluation Conference, Melbourne, Australia, 21 - 22 April 2009. [ Links ]
Smith, J.E. and Nau, R.F. 1995. Valuing risky projects: option pricing theory and decision analysis. Management Science, vol. 41, no. 5. pp. 795-816.
© The Southern African Institute of Mining and Metallurgy, 2013.
ISSN 2225-6253. This paper was first presented at the 5th International Platinum Conference 2012, 18-20 September 2012, Sun City, South Africa.

