


Serviços Personalizados
Artigo
 Inglês (pdf)
 Artigo em XML
 Referências do artigo
Indicadores

Links relacionados
-
 Citado por Google
 -
 Similares em Google
Compartilhar

 Permalink
Journal of the Southern African Institute of Mining and Metallurgy
versão On-line ISSN 2411-9717
versão impressa ISSN 2225-6253
J. S. Afr. Inst. Min. Metall. vol.113 no.2 Johannesburg Fev. 2013
Determination of the degree of thermal exposure to the lower head of the Three-Mile Island Unit 2 nuclear reactor using metallography
G.F. Vander Voort
Consultant
SYNOPSIS
The accident at Unit No. 2 of the Three Mile Island nuclear reactor (TMI-2) on 28 March 1979 was the worst nuclear accident in US history and crippled the nuclear industry. An international Vessel Investigation Project was formed to assess the integrity of the vessel. However, it was not possible to remove specimens from the lower head until January-March 1990. Fourteen of the fifteen specimens removed by electrical discharge machining were from under the debris pile that accumulated on the lower head due to melting of approximately 19 000 kg (45%) of the core. Specimens were previously cut from the lower head of a cancelled reactor of very similar size and design destined for Midland, Michigan. These specimens were subjected to controlled heating cycles with peak temperatures from 800°C to 1100°C for periods of 1 to 100 minutes. The initial study qualitatively compared the structures in the 15 specimens from TMI-2 to the control specimens from the Midland lower head. The writer used the same specimens and employed microindentation hardness traverses, electron microprobe analysis, and selective etching followed by quantitative metallography (by image analysis) to obtain a far more detailed description of the thermal exposure experienced.
Keywords: Three-Mile Island nuclear reactor, quantitative metallography.
Introduction
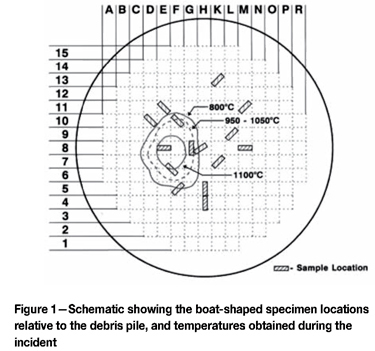
The accident at Unit 2 of the Three Mile Island nuclear power station (TMI-2) began at about 4 am on 28 March 1979 - it was the worst nuclear accident in the USA. In 1987, the Nuclear Regulatory Commission proposed formation of a joint international programme, the Vessel Investigation Project (VIP), to study the incident. Members included representatives from Belgium, Finland, France, Germany, Italy, Japan, Spain, Sweden, Switzerland, the UK, and the USA. Of course, actual examination of specimens from the reactor could not start until the vessel was defueled and the debris on the lower head was mapped, sampled, and removed. In 1988, MPR Associates Inc. of Alexandria, Virginia, was hired to remove metallurgical test specimens from the lower head using a remote-controlled electrical-discharge machining device designed for the purpose and to work under water - 39 feet (11.9 m) of radioactive water was in the vessel after the vessel was cleaned. This work started at 7 am on 30 January 1990 and ended at 11 am on 1 March 1990 (working 24 h/day, 7 days/week). Fifteen 'boat-shaped' specimens were removed from the lower head; four of these were located at in-core penetrations. Fourteen in-core nozzles and two in-core guide tube sections were also removed, but were not examined by the writer.
The boat-shaped specimens contained the ER308L stainless steel cladding and the ASTM A533 Grade B plate materials to a depth close to mid-thickness (the head could not be breached as the radioactive water would escape). The boat specimens measured about 70 x 165 x 65 mm deep, and their location and coding is shown in Figure 1.
Experimental procedure
To help determine the temperature attained by each boat specimen sample during the accident, the lower head of a very similar reactor built by Babcock & Wilcox for Midland, Michigan (but cancelled after the accident) was obtained. The lower head steel for both TMI-2 and Midland was made by Lukens Steel, and both were 5 inches thick and weld clad on the inside with a 3/16 inch (4.8 mm) thick layer of ER308L stainless steel. The main difference was in the stress relief time: at 607°C: 50 h for TMI-2 and 23.8 h for the Midland head.
Specimens from the Midland reactor were heated to 800, 900, 950, 1000, 1050, and 1100°C and held for 1, 10, 30, and 100 minutes.
Specimens cut from the boat specimens were examined (after decontamination) at Argonne National Laboratory and at the Idaho Falls National Engineering Laboratory. Slices from each boat specimen were hardness tested to a depth of about 40-50 mm below the cladding surface. Rockwell testing was used, but as the results spanned two scales, they were converted to Vickers to simplify plotting. Hardness testing revealed that specimens F-10, E-8, G-8, and E-6 were heated high enough during the accident to re-austenitize the steel, which formed a higher hardness structure upon cooling after the reactor was flooded with water.
Two of the abovementioned boat specimens, G-8 and E-6, had to be ground through the cladding to an unknown depth below the interface during contamination, so few measurements could be made on two of the four specimens that saw the highest temperatures. When the microstructures were examined, a 'dark feathery band' was observed at the weld metal-base metal interface, on the base-metal side. This band was present on specimens removed from the Midland reactor head. It was observed on some of the TMI-2 boat specimens, but not on F-10 and E-8. A study of the control specimens revealed that this band began to dissolve upon reaching 900°C for 10 minutes. Carbides at the interface of the delta ferrite-austenite phases in the cladding went into solution after 100 minutes at 1000°C or after 10 minutes at 1100 °C. In this temperature range the morphology of the delta ferrite changes.
Although some measurements were made of the prior-austenite grain size in the base metal, starting near the interface, the writer concentrated on measuring the changes in microstructure in the cladding as it experienced the highest temperatures. Two features can be seen to change with temperature and can be quantified using standard quantitative metallographic procedures: the amount, spacing, and morphology of the delta ferrite in the cladding and the carbides associated with the delta ferrite. Consequently, specimens were etched with modified Murakami's reagent (90-100°C for up to 4 minutes) to darken the delta ferrite selectively, and the standard Murakami's reagent was used to darken the carbide (60-90 seconds at room temperature). The weld metal did contain a substantial inclusion content, which would be detected along with the darkened delta ferrite or carbides.
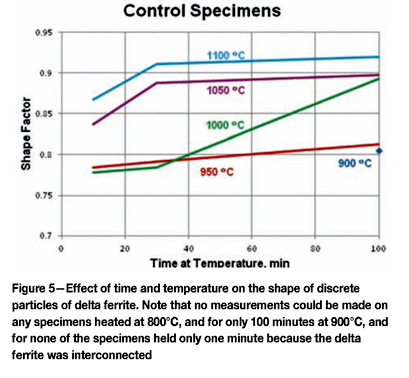
Consequently, measurements were made of the volume fraction of the inclusions to subtract this value from the volume fraction of carbides and delta ferrite. With increasing temperature, the initial lacy, interconnected delta ferrite structure starts to break up into discrete particles that start to go into solution and spheroidize with time and temperature. So, for certain specimens, the mean shape (sphericity = 4πΑ/Ρ2) factor was determined. The mean free path (mean edge-to-edge spacing in 360°) was also measured, as this distance changed with temperature and time.
Results
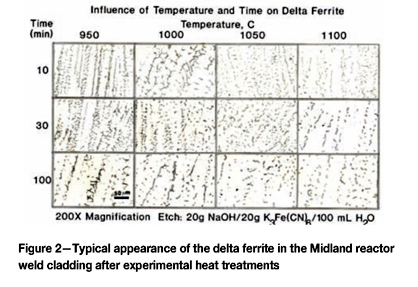
As a base point, measurements began with the lower head of the Midland reactor in the as-fabricated condition. Figure 2 shows the effect of temperature and time on the control specimens from the lower head of the Midland reactor.
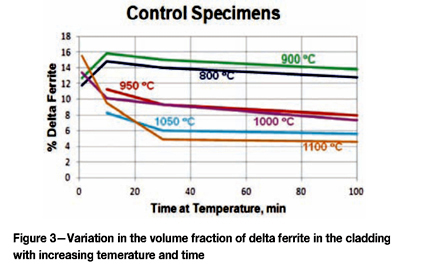
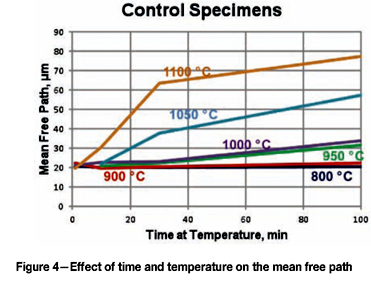
Quantitative measurements were made of the volume fraction of delta ferrite in the cladding after etching with modified Murakami's etch at room temperature for about 2 minutes. For specimens heated high enough, and held long enough to break up the lacy, interconnected morphology of the as-fabricated delta ferrite, the mean free path was measured as well as the sphericity shape factor (4πΑ/Ρ2). Figure 3 shows how the volume fraction of delta ferrite decreased with time at temperature. Note that heating at 800°C and 900°C increased the amount of delta ferrite, but with heating at 950°C and above, the delta ferrite content decreased. Figure 4 shows the effect of temperature and time on the mean free path, the mean edge-to-edge spacing between discrete particles, while Figure 5 illustrates the change in sphericity with time and temperature.
One of the initial steps taken by the VIP team was to test the hardness of specimens going from the 308L cladding across the interface and into the A533 Gr B base metal, using two Rockwell scales. This data was converted to Vickers hardness for ease of plotting. The writer decided to do actual Vickers tests, using a low load (300 g force) to assess the hardness variations with more sensitivity due to the smaller indent size. Figure 6 shows the data comparing two different Midland as-received specimens to the TMI-2 K-13 specimen. K-13 was chosen as it was well away from the debris pile and should reflect the initial, pre-incident condition in the TMI-2 lower head. The only significant difference between the Midland as-received and the K-13 specimen would be the difference in stress relief time, 23.8 h for the Midland head and 50 h for the TMI-2 head. Note that the hardness profiles are quite similar. We observe a rapid increase in hardness at the interface, followed by a drop in hardness in the adjacent heat-affected zone. These changes are due to carbon in the base metal diffusing to the cladding and forming carbides, which depleted the adjacent base metal of carbon. K-13 was decarburized more than the Midland specimens.
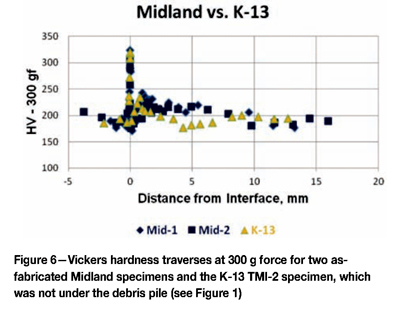
Figure 7 shows similar Vickers traverses comparing the as-fabricated Midland specimens to the traverses for E-8 and F-10, near the centre of the debris pile and expected to experience the highest temperatures.
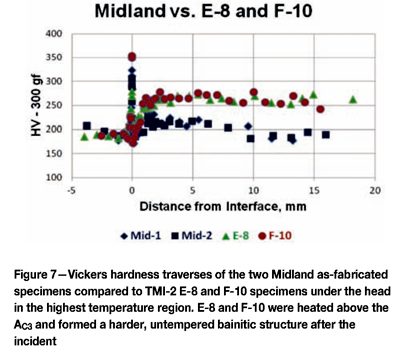
Note that the hardness in the heat-affected zone of the A533 GrB head was much higher than the normal base hardness (180-200 HV in the head more than 10 mm below the cladding-base metal interface. The A533 GrB head below the cladding, after the decarburized zone (from about 1 mm and below) was in the range of 250-270 HV for both E-8 and F-10. This clearly shows the the temperature in this region was above the upper critical temperature for A533 GrB.
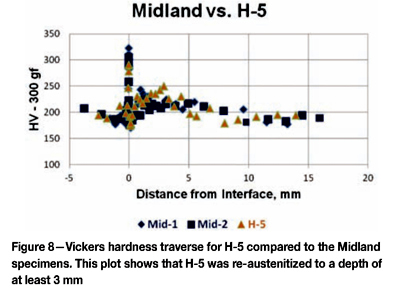
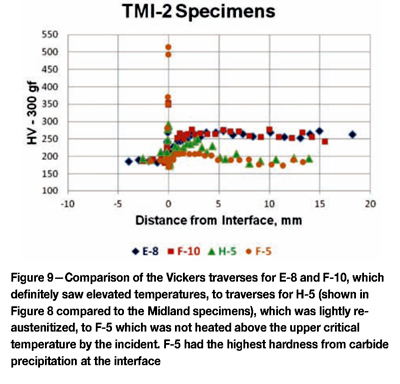
Figure 8 shows a Vickers travers on H-5, compared to the Midland as-fabricated specimens. Note that higher hardnesses were obtained from a depth of approximately 1 mm to 3 mm below the interface, indicating this region did become re-austenitized during the incident. Figure 9 compares the Vickers hardness traverses for E-8 and F-10, which saw the highest temperatures, and H-5, which was lightly re-austenitized, and F-5 which was not heated above the upper critical. F-5 exhibited the highest hardness at the interface from carbide precipitation, most likely during the stress relief operation, not exclusively from the incident.
Because of the very high hardness at the cladding-base metal interface and the lower hardness in the immediate heat-affected zone, specimens were analysed using a Cameca electron microprobe analyser (EMPA) using full quantitative analysis with the beam adjusted to be approximately 1 x 10 µm in width parallel to the cladding surface. Figure 10 shows a detailed analysis of the carbon content starting in the cladding, where it is rather variable (depending upon the beam hitting carbides), to the cladding side of the interface, where it strikes the 'dark 'feathery' region discussed in the Argonne and Idaho Falls reports. Here the carbon content reached 1.6 wt%, but just slightly into the base metal the carbon content was zero, except for one spot, to a depth of 0.4 mm. This is due to carbon diffusion during the stress relief operation at 607°C. Figure 11 shows the carbon profile of the Midland specimen (Figure 10) compared to that of K-13, which was unaffected by the incident. The difference here is 23.8 h vs 50 h stress relief. The profiles are similar, although K-13's peak carbon in the cladding at the interface was about 1.5%, slightly lower than the Midland specimen, but K-13 exhibited less decarburization of the HAZ. Figure 12 compares the carbon profile of E-8 to the Midland specimen. Note that E-8 had a peak carbon content of about 0.85 wt%, almost half that of the Midland specimen, but it exhibits decarburization in the HAZ somewhat worse than the Midland specimen. The cladding in E-8 is significantly more enriched in carbon than Midland or K-13 the specimens.
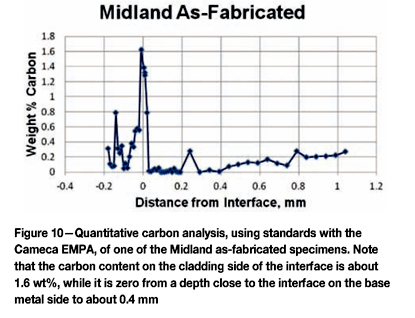
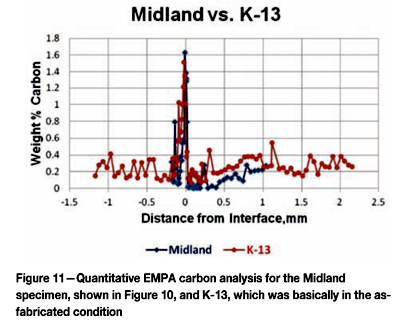
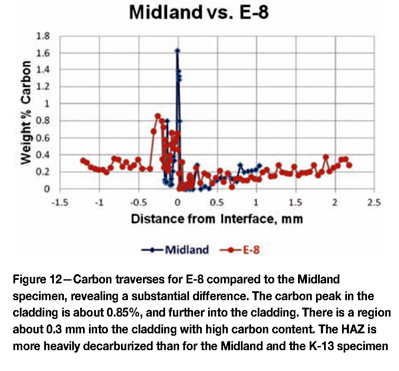
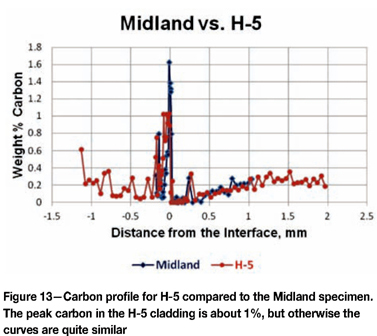
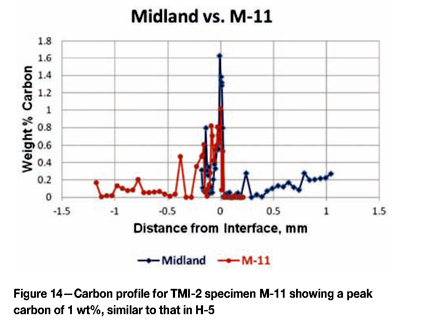
Figure 13 shows the carbon profile for H-5 compared to the Midland specimen. The peak carbon in the cladding is lower at 1 wt%, but there is again more carbon in the cladding than in the Midland specimen. In the HAZ, both specimens gave nearly identical results, even with increased carbon at a depth of about 0.25 mm. Figure 14 shows a carbon profile for M-11 compared to the Midland specimen. M-11 reached a peak of about 1% carbon, like H-5. Again, it has a higher overall carbon content in the cladding. There was a total loss of carbon in the HAZ adjacent to the interface, but the carbon analyses were not continued to the desired depth.
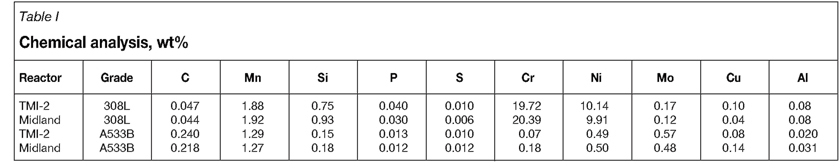
It should be noted that the TMI-2 head had a slightly higher carbon content than the Midland head. Table I gives the chemical analysis of the A533 Gr B plate and 308L cladding for TMI-2 and Midland.
As for the control specimens, all of the reactor specimens were selectively etched using a variety of reagents to reveal the overall microstructure, and to selectively darken either the delta ferrite or the residual carbides in the cladding. Quanititative measurements were made using an image analyser.
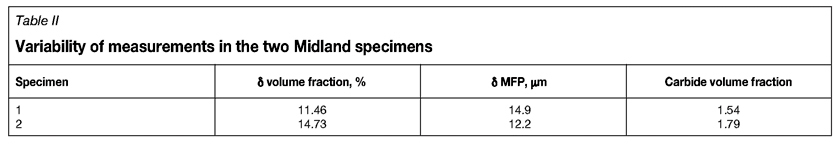
These measurements were compared to the trends in Figures 3-5 to obtain an estimate of the maximum temperature experience by each specimen. Table II shows test results for the two Midland specimens as a comparison. The measurements were the volume fraction and mean free path of the delta ferrite in the cladding using modified Murakami's reagent and the volume fraction of the carbides in the cladding using electrolytic ammonium hydroxide. These measurements were affected somewhat by detection of non-metallic inclusions in the cladding, mainly slag particles. Table III gives data for the TMI-2 boat specimens.
As can be seen comparing Tables II and III, only TMI-2 specimen K-13 is really similar in all respects to the Midland specimens.
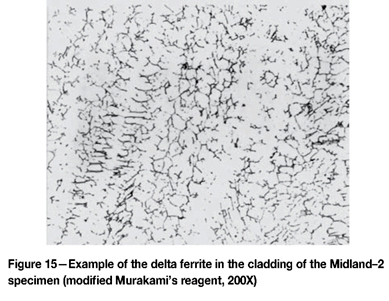
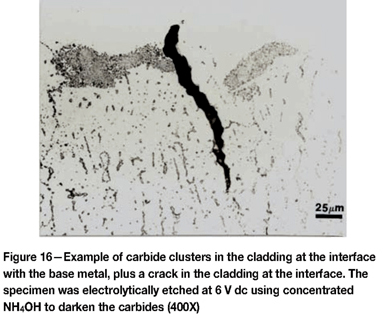
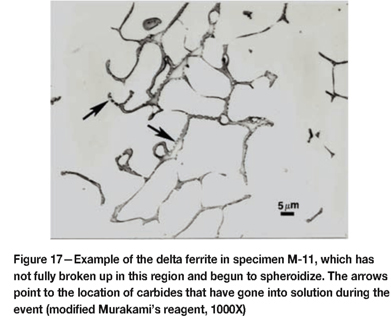
Figure 15 shows the microstructure of the delta ferrite in the as-fabricated Midland specimen. The 308L weld metal composition is balanced to yield about 12.5% delta ferrite, which eliminates hot cracking during solidification. It has a fine interconnected, 'lacey' morphology. Figure 16 shows an example of the complex carbide clusters, quite common in F-10, in the cladding at the interface. Note also the crack that has formed. Figure 17 shows an example of delta ferrite heated high enough to dissolve the M23C6 carbide that was in the delta ferrite at its interface with the austenitic matrix.
Discussion
The order given in Table III for the shape factor ranks these five specimens as having experienced the highest temperatures in that order, F-5 to E-8. Specimen F-5, with the lowest rated shape factor of the specimens with discrete globular particles of delta ferrite, had to have experienced at least 950°C for 60 - 100 minutes, or 1000 °C for >40 minutes. E-11, H-5, F-10 and E-8 all experienced higher temperatures. Based upon the delta ferrite content, specimen K-13 experienced temperatures well under 800°C. Specimens H-4, D-10 and L-9 all experienced temperatures of approximately 900°C for 100 minutes, or 950°C for 10-30 minutes. Specimens K-7, M-11, M8, and F-5 experienced temperatures of 950°C for 100 minutes, 1000°C for 30 minutes, or 1050°C for 10 minutes. Specimens E-11 and H-5 experienced temperatures from 1000-1050°C. Specimen F-10 experienced about 1050°C for 30 minutes, while E-8 experienced the highest temperatures, 1100°C for 30 minutes, or possibly 1125°C for about 10 minutes. Ratings based on the mean free path in the delta ferrite yields somewhat similar estimates with a few minor differences.
Conclusions
This study agreed with the VIP team's overall conclusion that the TMI-2 lower head experienced a maximum temperature of about 1100°C for 30 minutes, which differed from the much higher exposure temperature estimate made by those who modelled the event. Carbides in the cladding, which were located at the interface between delta ferrite and austenite, went into solution at 1000°C for 30 minutes or 1100°C in 10 minutes. This study agreed that specimen M-11, which the UK VIP members thought experienced temperatures from 950°C for 100 minutes up to 1050°C for 10 minutes, did experience such temperatures. Eutectic carbide clusters were observed at the 308L cladding/A533 Gr B interface in F-10 and E-8 (more in F-10). These appeared to be M7C3 carbides. F-10 appeared to have cooled more slowly than E-8 after the incident, causing carbide to re-precipitate in the cladding.
© The Southern African Institute of Mining and Metallurgy, 2013. ISSN2225-6253.
This paper was first presented at the, Ferrous and Base Metals Development Network Conference 2012, 15-17 October 2012, Mount Grace Country House and Spa, Magaliesburg, South Africa. [ Links ].

