


Services on Demand
Article
 English (pdf)
 Article in xml format
 Article references
Indicators

Related links
-
 Cited by Google
 -
 Similars in Google
Share

 Permalink
Journal of the Southern African Institute of Mining and Metallurgy
On-line version ISSN 2411-9717
Print version ISSN 2225-6253
J. S. Afr. Inst. Min. Metall. vol.113 n.2 Johannesburg Feb. 2013
Effect of hot rolling conditions on ridging in 16wt% Cr ferritic stainless steel sheet
K.A. Annan; C.W. Siyasiya; W.E. Stumpf
University of Pretoria
SYNOPSIS
The last seven hot rolling passes of the ferritic stainless steel AISI 430 were simulated on a Gleeble-1500D® thermo-mechanical simulator to investigate the effect of temperature, strain rate, and interpass time on the texture. The compression tests were carried out over a wide range of strain rates (0.1 s-1 to 5 s-1) and temperatures (1100°C to 820°C) with different interpass times (2, 10, 20, and 30 seconds). The dynamic recrystallization to dynamic recovery transition temperature was determined from examining the relationship between the mean flow stress and the inverse of the deformation temperature in multi-pass tests. It was found that the texture in the central layer of the compressed sample is a strong recrystallization-type. The through-thickness textural and microstructural banding, to a large extent, were found to be weakened by hot deformation in the two-phase (α + γ) region, as opposed to the single-phase (α) region.
Keywords: ferritic stainless steel, electron backscattering diffraction (EBSD), hot rolling, dynamic recovery, dynamic recrystallization.
Introduction
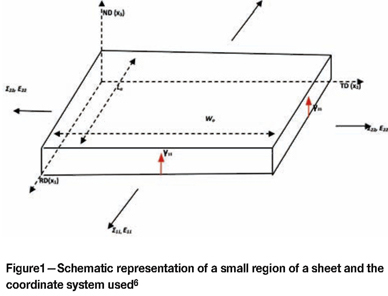
Countries all over the world are constantly tightening motor vehicle regulations requiring cars to reduce sound (noise) below set limits1. Mufflers of car exhausts made of AISI 430 stainless steel are used to moderate the level of noise produced by engines. Fortunately, mufflers are relatively inexpensive to replace, but this could change if the cost of production of the primary material (AISI 430) was to increase. During production the steel is subjected to continuous deformation of the sheet in the rolling direction (RD), which results in a series of ridges aligned in the RD. This phenomenon reduces the aesthetic quality of the steel sheet. Ridging in ferritic stainless steel (FSS) is a result of crystallographic texture in sheets arising from the thermo-mechanical processing during its production2-5. During processing, a highly alloyed FSS such as AISI 430 undergoes limited or no phase transformations6. During hot rolling, the columnar grains in the as-cast slab become highly elongated bands with a sharp texture6,7. It has been established that the deformation in the normal (RD-ND) and rolling (TD-ND) directions (Figure 1) is non-uniform6. Certain crystallographic directions are preferred and deformation in those directions is more pronounced
It has also been shown that alignment of similarly oriented grains occurs along the RD in the RD-TD plane and the stronger the alignment, the more severe the ridging. For this reason, it is appropriate to study ridging by analysing the texture derived from electron backscattering diffraction (EBSD) data measured in the RD-TD (or rolling) plane7-9. Ridging (sometimes called roping) can be significantly reduced or completely prevented by eliminating microstructural and textural banding, which is the origin of anisotropic flow in mixed-texture metals7,9. This can be achieved by modification of the alloy chemistry, casting practice, and the design of the thermomechanical processing schedule. While the first method suggests elimination of the austenite phase during hot rolling, the second method proposes the enhancement of the equiaxed grain ratio during processing7-9. The third option, however, makes use of faster recrystallization processes (i.e. both dynamic and static) to reduce the degree of banding. This dynamic recrystallization (DRX) process in 16 wt% Cr ferritic stainless steel is affected by the accompanying partial transformation during hot rolling and, therefore, is influenced by the hot rolling conditions during this processing stage. For BCC metals such as AISI 430, cross slip and climb of dislocations occurs with relative ease, which leads to a decrease in dislocation density when dislocations encounter each other and diminish at new slip. This results in low dislocation density during hot working and eventually only dynamic recovery (DRV) occurs10. It is, however reported that the decrease in flow stress during hot rolling indicates the occurrence of dynamic recrystallization10. This study addresses the contribution of hot rolling parameters to the formation of texture in AISI 430.
Experimental procedure
Experimental material and test procedure
The composition of the AISI 430 used11 was 0.05 wt% C, 0.39 wt% Si, 16.2 wt% Cr, 0.60 wt% Mn, 0.23 wt% Ni, 0.12 wt% V, 0.030 wt% Co, 0.025 wt% Mo, and 0.019 wt% P. Machined cylindrical specimens for the compression tests were 10 mm in diameter and 15 mm in length. A practical limit of initial diameter (Do) to initial height (ho) (i.e. Do/ho) of 0.66 was chosen to minimize the barrelling and ensure that no buckling occurred12. To decrease the friction and allow uniform deformation, thin tantalum sheets were placed between the compression specimen and the sintered tungsten carbide anvils. Multi-pass hot compression tests were performed on the Gleeble-1500D® thermo-mechanical simulator with pass strains ranging from 0.1112 to 0.1490 together with strain rates from 0.1 s-1 to 5 s-1 and interpass times of 2, 10, 20, and 30 seconds. These strain rates are, however, lower than the industrial strain rates on the Steckel mill. The specimens were initially heated to 1150°C at a rate of 10°C s-1 and homogenized for 5 minutes to eliminate thermal gradients, then cooled at 10°C s-1 to the selected deformation temperature where compression was applied. The multi-pass testing schedule used is illustrated schematically in Figure 2.
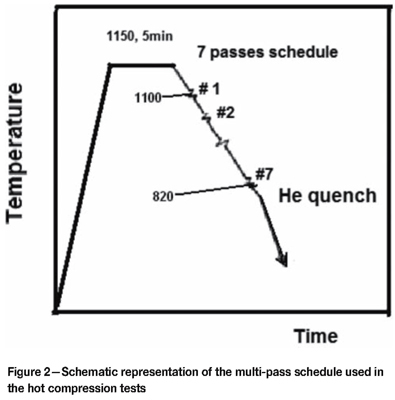
Seven compression passes were applied in each test and the temperature was decreased by 30°C between passes. Oxidation of the specimens during testing was prevented by passing a continuous flow of high-purity argon through the system. The as-deformed specimens were immediately helium-quenched to 100°C and then air-cooled to room temperature. The maximum height reduction of all the specimens was 40 per cent. This ensured that the maximum barrelling factor was kept below 0.9 in all the tests. A friction coefficient of 0.2 was used as a correction factor 12 in calculating the Von Mises flow stress.
Determination of the dynamic recrystallization (DRX) to dynamic recovery (DRV) transition temperature (DRtt)
The force-stroke curves obtained from the compression tests were converted into true stress-true strain curves by standard equations11, as shown in Figure 3.
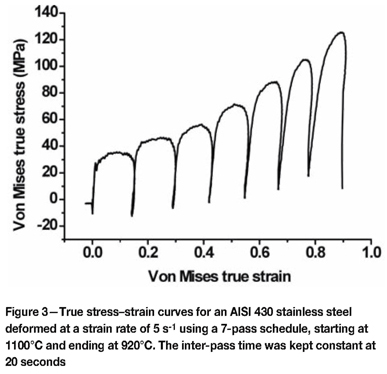
The mean flow stress (MFS) per pass was calculated from the flow curves (Figure 3) obtained by using the equation:
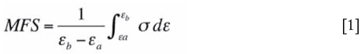
where εa is the initial strain, εb is the final strain, and σ is the stress. A typical dependence of mean flow stress on the inverse of absolute temperature obtained from these tests is shown in Figure 4.
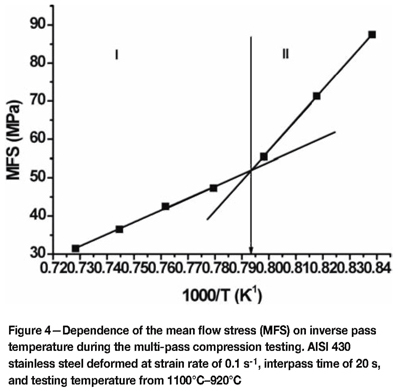
The change in linear slope in Figure 4 defines two regions, namely the dynamic recrystallization or DRX region (I) and dynamic recovery region or DRV (II). In region I (high-temperature deformation), dynamic recrystallization takes place as there is no accumulation of strain from pass to pass, and therefore the increase in mean flow stress is due solely to the decrease in temperature. In region II (low-temperature deformation), dynamic recovery takes place. Strain is accumulated from pass to pass within this region and hence the increase in the mean flow stress occurs more rapidly with decreasing temperature.
Sample preparation
The deformed specimens were cut symmetrically into two parts parallel to the compression axis. Central regions of the specimens that experienced the largest localized deformation were chosen as the investigation area. A systematic range of orientation distribution functions (ODFs) from electron backscattered diffraction (EBSD) determinations across the sectioned specimens showed the clearest recrystallization texture in these central areas. The samples were mounted in a plastic resin, adequately ground, and mechanically polished to a 3 µm diamond finish. This was done to ensure that the surface finish was suitable for diffraction13. The samples were then removed from the resin and electro-polished at 0.2 A and 20 kV for 20 seconds in 95 per cent ethanol and 5 per cent perchloric acid to remove the mechanically disturbed layer.
Texture measurement and analysis
EBSD measurements, with a step size of 10 per cent of the grain size, were performed on a region of the deformed sample equivalent to the rolling plane of the sheet (RD x TD). The (RD x TD) area was carefully chosen with respect to the grain size so that at least 1000 or more grains were scanned to have a statistical representation of the orientation of the grains. The samples were tilted at an angle of 70° to the horizontal, which allows more electrons to be diffracted towards the detector13. EBSD patterns from a field emission in-lens SEM (FEI Nova Nano® SEM 200) equipped with an EDAX Digiview EBSD Camera were used to determine the crystallographic textures from the mid-thickness regions of the hot compressed samples. A minimum number of seven Kikuchi bands were used to index a pattern during the data collection in order to ensure good reliability of information13. An average confidence index of the patterns of more than 0.1 was used, which led to more than 95 per cent of each pattern being indexed correctly. To obtain accurate measurements, misorientations of less than 1.5° were excluded from the data. From these results, orientation distribution functions (ODFs) were obtained using EDAX OIM Software Suite® for data capture and analysis and φ2= 45° sections (Bunge notation). The ODFs were calculated with a 15° Gaussian spread around the ideal orientations.
Results and discussion
Effect of strain rate on the DRX to DRV transition temperature
The mean flow stress increased with increasing strain rate. This was due to a greater restoration by dynamic recovery at the lower strain rates. For example at a strain rate of 0.1 s-1, the deformation time for a strain of 0.1431 was 1.431 seconds. By contrast, at a strain rate of 5 s-1, the deformation time was only 0.0286 seconds for the same strain. Such less-restored and more highly work-hardened austenite supplies more driving force for the dynamic recrystallization and therefore decreases the DRTT14. The results presented in Figure 5 demonstrate the effect of strain rate on the DRTT for the steel deformed in the same temperature range (1100°C-920°C), the same interpass times (20 seconds), but at different strain rates (0.1 s-1, 0.5 s-1, 1 s-1, and 5 s-1).
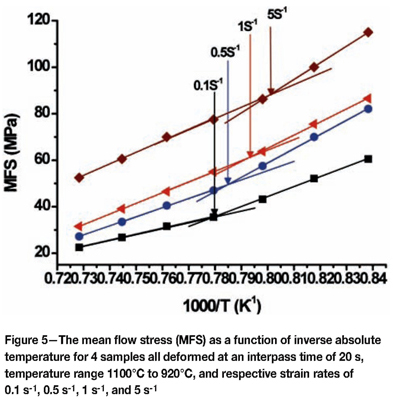
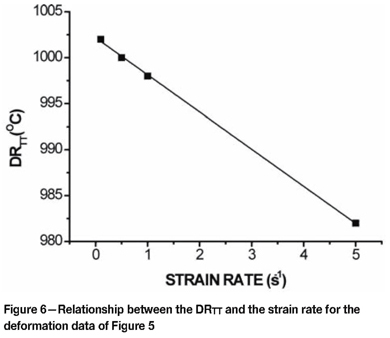
Figure 6 illustrates the inverse relationship between the strain rate and the DRTT during the compression testing of the samples.
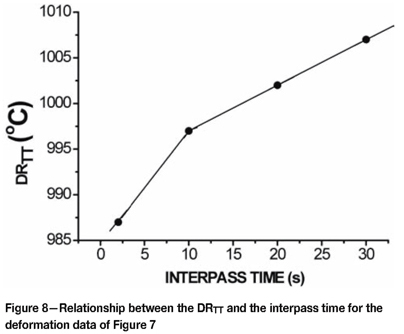
Effect of interpass time on DRX to DRV transition temperature
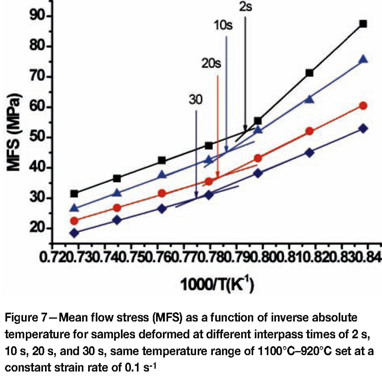
The DRTT increased with increasing interpass time. At temperatures above the DRTT, the interpass times did not affect the mean flow stress as dynamic recrystallization occurred during deformation and hence no further softening occurred in the interpass time. At deformation temperatures below the DRTT, further softening occurred in the interpass time, due largely to dynamic recovery. Hence, the increase in mean flow stress could be ascribed to the decrease in temperature and the retardation of recrystallization. The dependence of DRTT on interpass time is illustrated in Figure 7 for steels deformed over the same temperature range (1100ºC-920°C), same strain rate (0.1 s-1), but different interpass times (2 seconds, 10 seconds, 20 seconds, and 30 seconds). Figure 8 illustrates the relationship between the DRTT and the interpass time.
Texture in AISI 430
The hot rolling conditions used for the compression test are as summarized in Table I.
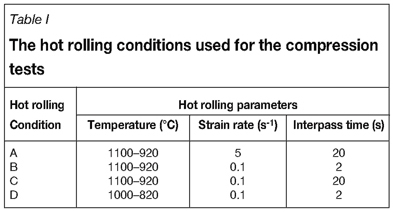
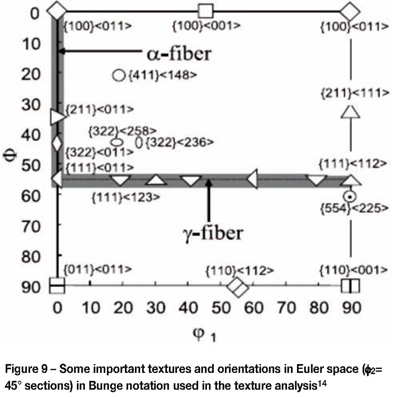
Figure 9 shows important fibres and orientations on the φ2 = 45° sections in ODF (Bunge notation), which was used to analyse the EBSD data.
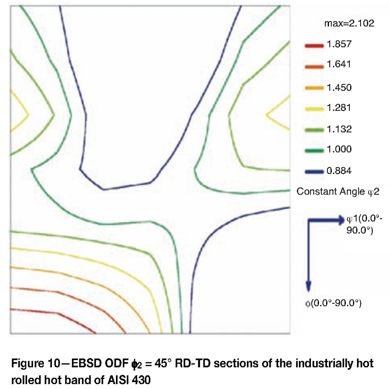
The texture of the hot-rolled steel sheet has a significant influence on the evolution of texture in the cold-rolled as well as the annealed steel sheets13. The texture is responsible for the Lankford ratio (r-value). The low r-value of hot-rolled AISI 430 accounts for the poor drawability, which is well-recognized in hot-rolled steel13-14. As shown in Figure 10, the texture in the as-received samples is a combination of a strong Goss texture {011}<011>and weak {211}<011> and {211}<111> textures. If these textures are retained in the subsequent cold working and annealing processes, poor drawability of this steel and subsequently ridging and roping could occur15.
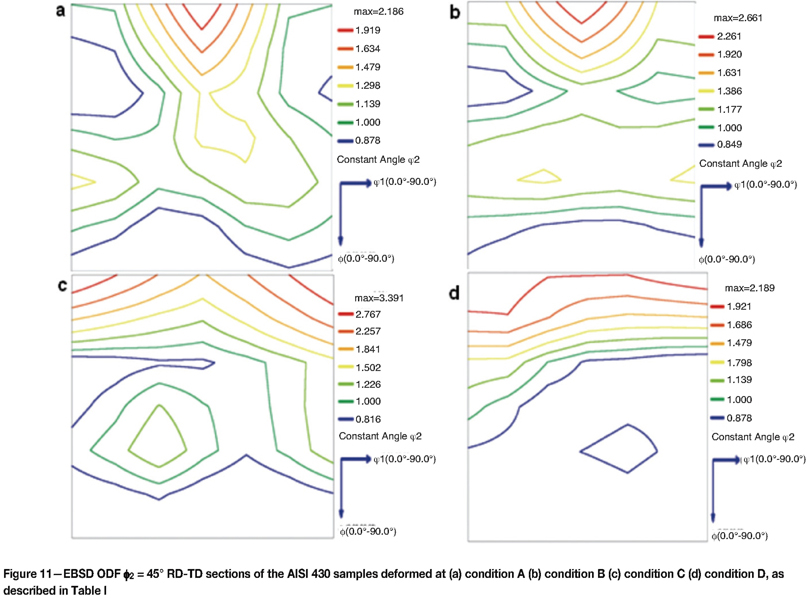
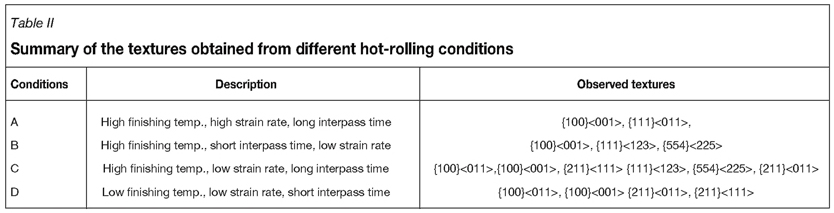
The mean r-value of hot-rolled AISI 430 ferritic stainless steel obtained from the producer was determined by tensile testing to be 0.48, whereas the r-value of the final annealed sample was 1.25. The φ2 = 45° sections of the AISI 430 steel deformed at different hot-rolling conditions (Table I) are shown in Figure 11 a-d. The texture of the steel hot-rolled using condition A consists of a strong rotated cube component {100}<001> and a weak α-fibre {111}<110> as shown in Figure 11 (a). This condition represents a combination of a high finishing rolling temperature, high strain rate, and a longer interpass time. The second rolling condition B led to the sharpening of the strong rotated cube component {100}<001> with weaker γ-fibres {111}<123> and {554}<225>, as shown in Figure 11 (b). Increasing the interpass time from 2 seconds (condition B) to 20 seconds (condition C) led to a slight improvement in the γ-fibre.
Condition D has the same rolling parameters as condition B except that the finishing temperature is lower at 820°C instead of 920°C. Condition D resulted in a strong α- fibre textures RD//<110> along with a strong rotated cube {100}<001>. A summary of the analysis of these textures is presented in Table II.
The dominant textures found in all four different anisothermal simulated hot compression tests were strong α-fibre and rotated cube textures RD//<110> and {100}<001> respectively. However, the as-received hot-rolled steel exhibited only a strong {011}<011> texture without a rotated cube texture.
Conclusions
The following conclusion can be drawn at this stage:
The dynamic recrystallization to dynamic recovery transition temperature was found to decrease with increasing strain rate
Acknowledgements
The authors are grateful to Columbus Stainless for the supply of the materials and the Industrial Metals and Minerals Research Institute (IMMRI) of the University of Pretoria for provision of equipment for the research. Finally, KAA is grateful for the financial support and permission to publish from the University of Pretoria.
References
1. Transport and Environment. New EU vehicle noise limits. December 2011. http://wiww.transportenvironment.org/sites/te/files/media/2011 12 Noise briefing.pdf [ Links ]
2. Chao, H.C. Mechanism of anisotropic lamellar fractures. Transactions of the American Society for Metals, vol. 2, 1976. pp. 37-50. [ Links ]
3. Takechi, H., Kato, H., Sunami, T., and Nakayama, T. Mechanism of ridging formation in 17% chromium stainless steel sheet. Transactions of the Japan Institute of Metals, vol. 8, 1967. pp. 233-239. [ Links ]
4. Shin, H.J., An, J.K., Park, S.H., and Lee, D.N. The effect of texture on ridging of ferritic stainless steel. Acta Materialia, vol. 51, 2003. pp. 4693-4706. [ Links ]
5. Engler, O., Huh, M., and Tomé, C.N. Crystal-plasticity analysis of ridging in ferritic stainless steel sheets. Metallurgical and Materials Transactions A, vol. 36A, 2005. pp. 3127-3139. [ Links ]
6. Wu, P.D., Jin, H., Shi, Y, and Lloyd, D.J. Analysis of ridging in ferritic stainless steel sheet. Materials Science and Engineering, vol. 423, 2006. pp. 300-305. [ Links ]
7. Brochu, M., Yokota, T., and Satoh, S. Analysis of grain colonies in type 430 ferritic stainless steels by electron back scattering diffraction (EBSD). ISIJ International, vol. 37, 1997. pp. 872-877. [ Links ]
8. Harase, J., Ohta, K., Takeshita, T.R., and Schimizu, R. Grain orientation distribution in a hot rolled 17% Cr ferritic stainless steel. Materials Forum, vol. 14, 1990. pp. 296-303. [ Links ]
9. Bethke, K., Holscher, M., and Lucke, K. Local orientation investigation on the ridging phenomenon in Fe 17% Cr steel. Materials Science Forum, vol. 157-162, 1994. pp. 1137-1144. [ Links ]
10. Gur, C.H. and Pan, J. (eds.). Handbook of Thermal Process Modelling of Steels. CRC Press, Boton Raca, Florida, 2009. pp. 93-99. [ Links ]
11. Columbus Stainless. Columbus Technical Data CS430. http://www.columbusstainless.co.za [ Links ]
12. Dieter, G. 1988 Mechanical Metallurgy. SI edition. McGraw-Hill, New York, 1988. pp. 519-522. [ Links ]
13. Engler, O. and Valerie, R. Introduction to Texture Analysis: Macrotexture, Microtexture, and Orientation Mapping. 2nd edn. CRC Press, Boton Raca, Florida, 2009. pp. 208-231. [ Links ]
14. Bai, D.Q., Yue, S., Sun, W.P., and Jonas, J.J. Effect of deformation parameters on the no-recrystallisation temperature in Nb-bearing steels. Metallurgical Transactions A, vol. 24A, 1993. pp. 2151-2159. [ Links ]
15. Hamada, J., Ono, N., and Inoue, H. Effect of texture on r-value of ferritic stainless steel sheets. ISIJ International, vol. 51, no. 10, 2011. pp. 1740-1748. [ Links ]
© The Southern African Institute of Mining and Metallurgy, 2013. ISSN 2225-6253. This paper was first presented at the, Ferrous and Base Metals Development Network Conference 2012, 15-17 October 2012, Mount Grace Country House and Spa, Magaliesburg, South Africa..

