


Serviços Personalizados
Artigo
 Inglês (pdf)
 Artigo em XML
 Referências do artigo
Indicadores

Links relacionados
-
 Citado por Google
 -
 Similares em Google
Compartilhar

 Permalink
Journal of the Southern African Institute of Mining and Metallurgy
versão On-line ISSN 2411-9717
versão impressa ISSN 2225-6253
J. S. Afr. Inst. Min. Metall. vol.112 no.11 Johannesburg Nov. 2012
Using simple statistics to define confidence limits for reliable quantitative definition of mineral resources - the Venmyn Variance Tower
A.N. ClayI; J.A. MyburghI; T.C. OrfordI; C. LemmerII
IVenmyn Rand (Pty) Ltd, Sandton
IIGeological & Geostastistical, Rossmore, Johannesburg
SYNOPSIS
In recent times, there has been criticism of the minerals industry over the lack of quantifiable boundaries between Inferred, Indicated, and Measured resources. A recent initiative through the United Nations aims to try to converge the mineral resource classification systems. Since the oil and gas industry uses a probabilistic approach to defining reserve boundaries, it is appropriate to introduce a similar statistical methodology for minerals.
The Venmyn Variance Tower has been developed based upon traditional statistics to utilize historical and ongoing information in order to quantify variance of geological and chemical parameters and the boundaries and logic for quantitative mineral resource classification. It is proposed that a less than 50% variance from the mean of all sample parameters is required to achieve the classification threshold to define an Inferred Resource whereas between 20-10% is needed for an Indicated Resource and less than 10% variance from the mean is needed to declare a Measured Resource. These limits are similar to those used by the oil and gas industry, and it is suggested that these thresholds be adopted as an industry standard to ensure consistent quantitative reporting.
While this process is intended to use statistics of an orebody to provide quantifiable and defendable boundaries, it cannot be carried out unless the geology of the mineral deposit is understood and the borehole samples can be categorized into appropriate populations for which the statistics are valid. This means that competent geologists are always required to work with and understand the implications of the Variance Tower results. This paper is intended to form the basis of a series of publications that establish a process to take mineral projects along a quantifiable and logical development path. Hence, no specific field example of the practical application of this process is given here.
Keywords: mineral resource definitions, mineral asset recognition, number of boreholes, variance tower, probabilistic approach, confidence limits, @RiskTM.
Introduction
The Committee for Mineral Reserves Reporting Standards (CRIRSCO) is an international umbrella body that was established as a committee of the Council of Mining and Metallurgical Institutions (CMMI) in 1994. This committee worked towards the creation of a set of standard international definitions for the public reporting of Exploration Results, Mineral Resources, and Mineral Reserves in the minerals industry. As early as 2000, the International Accounting Standards Committee (IASC) published the Extractive Industries -Exploration for and Evaluation of Mineral Resources IASC Issues Paper, which called for comments on the issues of a reliable measure for the quantities and qualities of mineral resources and mineral reserves from which to base mineral asset valuations for accounting (IASB, 2009). Several points were raised with respect to the quantification of mineral resources and mineral reserves as definitive numbers, including the fact that the CRIRSCO codes required 'judgement' to be exercised by Competent Persons in classifying resources according to either low, medium, or high levels of confidence.
Although CRIRSCO reached provisional agreement on standard reporting definitions in 1997 through the so-called 'Denver Accord' (Miskelly, 2003) this was followed by an agreement on 9 November 1999 in Geneva to incorporate the CMMI definitions into the International Framework Classification for Reserves and Resources - Solid Fuels and Mineral Commodities (UNFC), developed by the United Nations Economic Commission for Europe (UN-ECE). This meant that the minerals industry and the petroleum industry could attempt to converge their classification systems. Because of these events, it was clear that statistical boundaries could be used to define mineral resource classification boundaries in a similar manner to the definition of P1, P2, and P3 categories in the petroleum industry (SPE Oil and Gas Committee, 2007). Notably, the minerals industry tends to drill orebodies on regularized spacing whereby the grid points fall on an ever-decreasing spacing. For example, initial drill spacing could be of the order of a kilometre, and gradually end up on a 50 m grid. The oil and gas industry undertakes detailed target assessment using geophysics, facies modelling, and sophisticated simulations before even thinking of drilling a well. Obviously, there is a difference between solid minerals and liquids and gas but the use of statistics can be applied to both situations.
Primarily the CRIRSCO codes provide the Mineral Resource definitions in the form of disclosure guides and their stated intent is for public reporting (CRIRSCO, 2010). However, the practical application of the codes by professional resource managers should lead to a broad application to the extent that they form the basis of all reporting, whether in the public domain or not.
Mineral project owners generally ask, 'How many boreholes must be drilled to get a mineral resource into a specific CRIRSCO category?', and based on preconceived grid patterns a plan emerges as to how many holes must be drilled. However, as drilling and exploration costs increase there is a need to be more sophisticated in the target process, and this has led to the use of simulation and the evaluation of anticipated variability of the geological orebodies being defined. This is intended to increase the chances of success (COS) and efficient utilization of limited exploration capital.
The advantage of such a process should be the ability to quantify the logic behind CRIRSCO mineral resource categories and provide confidence in the numbers that are ultimately reported in the public domain. It is proposed as part of this paper that if the industry adopted this statistical process, sufficient confidence in the reliability of the estimates should provide a basis for incorporation of subsequent valuation methods to allow these mineral assets to be reported in a company's balance sheet.
This would also achieve the need for tighter corporate governance and regulatory demands for the application of good practice and therefore comparative processes for all minerals, whether they be solid or non-solid minerals. This paper presents the methodology of the process of generating a Variance Tower, as well as the simple statistical results from sampling data from the Bushveld Complex of South Africa. While this paper presents a process, it sets the framework for subsequent papers by the authors for linking techno-economic assessments using similar statistically definable boundaries, as well as a practical example of the use of the Variance Tower.
Issues with respect to the Codes and confidence
At this point, it should be noted that this paper deals with the existing formal mineral resource categories and is not intended to address the problem of exploration results (SAMREC Working Group, 2007). A position paper on this has been recently issued by CRIRSCO (CRIRSCO, 2010), and the problem of defining and reporting mineralization for which the level of certainty may be too low to incorporate into Inferred Resources is not discussed here. However, the fact that there is an earlier category where a qualitative term is used to define a boundary does have significance when defining what qualitative measure could be used to determine a threshold.
It is important to reflect on several specific issues that emerge from the CRIRSCO Codes with respect to classification of the mineral resources types. Firstly, there is the primary responsibility to ensure 'grade continuity', which is wording that is included in the primary definitions for the Measured, Indicated, and Inferred categories (CRIRSCO, 2010).
Clearly, geological modelling and the use of geostatistics facilitate measurement of continuity, but this can really be achieved only with sufficient samples, and nowhere is this number pre-defined. This is primarily because the codes of reporting are not technically prescriptive, but principles-based. So how can grade continuity be defined other than by so-called judgement which moves from a low to a high level?
In the petroleum industry, plays and targets are defined using a COS approach whereby preliminary estimates of potential reservoir characteristics are incorporated into a Monte Carlo type simulation. What this does is to introduce a probabilistic approach to estimating the COS before an expensive borehole is drilled (SPE Oil and Gas Committee, 2007). Furthermore, once a well has been successfully drilled and well testing carried out, the expected volume distributions can be simulated to provide statistical boundaries to so-called P1, P2, and P3 volumes. Although this description is simplistic, the modelling methods can be very sophisticated.
The introduction of spreadsheet-based probabilistic software such as @RiskTM and others allows these techniques to be relatively easily applied. Given that the minerals industry is generally well endowed with borehole and other sampling data, it makes sense to follow a similar approach to the petroleum experts.
Sampling data from the Bushveld Complex
The earliest record of exploration for platinum group elements (PGEs) in the Bushveld Complex was by Hans Merensky in 1925, and Wagner provided an excellent summary (Wagner, 1929).
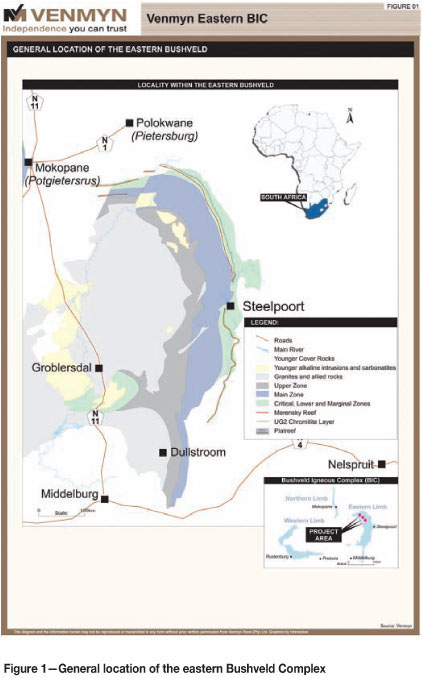
The borehole sampling data used in this paper was collated from public-domain reports from various mining and exploration companies in the eastern Bushveld Complex for the Merensky Reef and UG2 Reef, which are the two horizons that are of economic interest. The general location of the Bushveld Complex is shown in Figure 1.
The Bushveld Complex is approximately 2.0 Ga in age, and for a more detailed regional overview of the area of interest the reader is referred to Scoon and Mitchell (2004). The mineralized Merensky Reef and UG2 are magmatic segregation deposits in the Upper Critical Zone (UCZ) of the Rustenburg Layered Suite (RLS), containing economic quantities of PGEs and base metals. Throughout the Complex the reefs are tabular bodies extending laterally over hundreds of kilometres along strike and at least 8 km down dip, resulting in extensive mineral resources whose continuity has been established over years of exploration and mining.
The origin of the PGE mineralization in the Bushveld Complex has been investigated for 75 years and remains a matter of debate. The theorized primary magma from which the orebodies originated contained only trace amounts of PGEs, and therefore processes that account for the concentration of the PGEs have to be invoked. In addition, the theory must account for the clear association of the PGEs with chromite and base metal sulphides. An important review on this issue that is pertinent to this paper is that of Cawthorn (2011).
A possibility exists that PGEs are concentrated in primary magma with a basaltic to komatiitic composition when a high degree of partial melting (30%) of the upper mantle occurs. Within this primary melt, some mechanism to induce sulphide saturation was active to produce a sulphide liquid that segregated from the primary magma. Magma mixing, crustal contamination, and fractional crystallization are the most important processes known to induce sulphide saturation in magma during intrusion.
The eastern Bushveld Complex is of particular interest at present because of the relatively new platinum operations and the exploitation of the UG2 Reef, which lies between 150 m and 360 m below the Merensky Reef. Essentially, the separation between the two horizons is less in the west and greater in the east. Some exploration companies are now exploring at depths of over 2 000 m from surface, and ensuring a high chance of success for drilling budgets is extremely important.
The primary objective of these companies is to quantify an Inferred Resource as soon as possible. In order to achieve this, several processes take place concurrently. These include:
Regional geology and structure assessment to identify potential coherent ground where drilling can be targeted in the best ground conditions
The Merensky Cyclic Unit occurs close to the top of the Critical Zone. The Merensky pyroxenite is typically medium-grained, brownish-gray, and can be described as feldspathic orthopyroxenite. Two thin chromitite layers occur near the top of the orthopyroxenite.
Importantly, the economic reef cut in the Merensky Reef is defined by building a value accumulation from the upper chromite layer downwards and making a cut at a point where the Pt. Pd, Rh, and Au (3PGE plus Au) falls away. The economic cut then broadly coincides with a geological width.
The generic process is described by Cawthorn (2011).
The UG2 chromitite layer (UG2) is located between 150 m and 360 m below the Merensky Reef (Gain, 1995). The UG2 consists of a main chromite seam with a parting followed by upper chromite seams. It is generally, but not always, underlain by a basal pegmatoid. This package is overlain by a massive chromitite layer 0.5-0.8 m in thickness, which consists of fine-grained chromite grains with intercumulus orthopyroxene and plagioclase and commonly has a sharp and planar upper contact. The silicate minerals found in the chromitite layer form irregularly distributed crystals which poikilitically enclose the chromite and form 'mottles' up to 15 mm in diameter.
The UG2 has up to three overlying chromitite stringers which are enclosed within a fine- to medium-grained feldspathic orthopyroxenite, forming a composite package 0.10-0.15 m thick. PGE mineralization is associated with very meagre sulphide (<1% of the mode) and increases towards the top and bottom of the chromitite layer. PGEs can also occur within the overlying chromitite stringers and the basal pegmatoid.
Importantly, unlike the Merensky Reef, an economic selected cut is built from the basal UG2 contact to an upper limit that may approximate 120 cm as a practical mining height. However, where leader chromitite layers occur these may be included as a wider cut for rock mechanic constraints.
Venmyn Variance Tower
In recent times, Venmyn has been evaluating the use of the probabilistic approach to the definition of confidence limits. In doing so, prior to the use of geostatisics for grade estimation in mineral resource calculations, Dr C. Lemmer, had developed a methodology whereby borehole results and their deflection values were evaluated statistically by assessing the increasing variance from the mean of different variables that had been assayed. Typically, most boreholes in the Bushveld Complex comprise a 'mother' hole with up to four deflections that can be assayed for Pt, Pd, Rh, Au, Ni, Cu, and S.
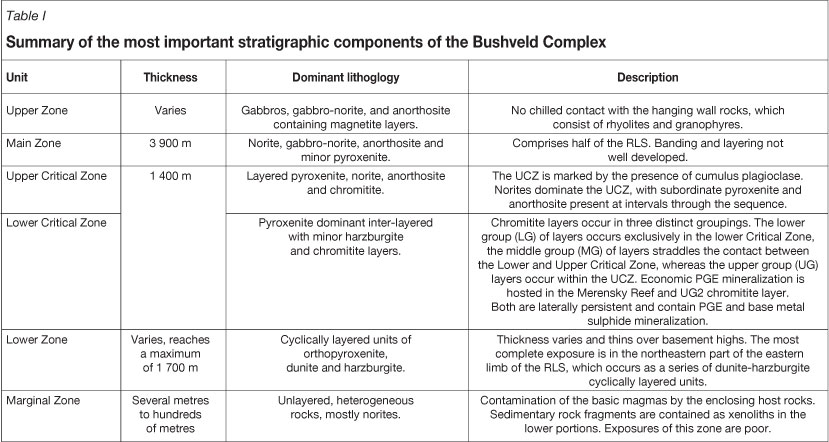
The overall stratigraphy of the Bushveld Complex is described in Table I.
The most important issue is to assess the type of reef intersection encountered in each borehole, but the chemistry tends to dictate the implications for continuity.
As has been mentioned, the chemistry of these economic horizons is very consistent, but if this can be measured appropriately and statistically defined then not only can classification boundaries be determined for different mineral resource categories, but the number of boreholes required to do so can be estimated.
The size of area relationship in practical geostatistics has been well defined and described since the 1950s (Krige, 1951, 1952, 1966a,1966b, 1981; Matheron, 1963, 1971; De Wijs, 1951, 1953). Additionally the use of regression to investigate sampling density based upon distance has been described by Storrar (1966) and by Krige (1981). However, it was with the groundbreaking work of Dr C. Lemmer that the creation of the Venmyn Variance Tower has progressed.
Although this paper considers a data set that was obtained for the Merensky Reef and the UG2 chromitite from public-domain records, the use of the historical sampling from adjacent resources must always be assessed for its representativeness. For this reason, setting a regional geological perspective with the usual attention to structure, and geological and anticipated chemical modelling is crucial. However, once this is done the framework that has been set is an important benchmark within which to appreciate ongoing results
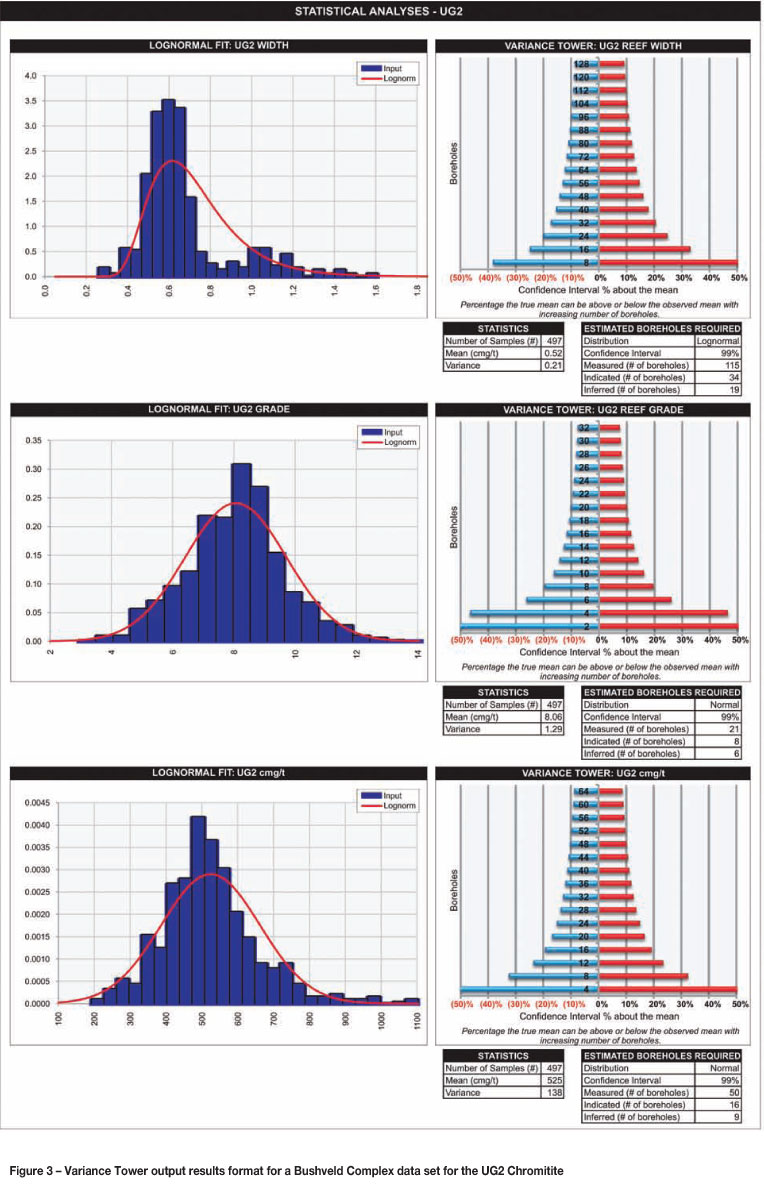
Importantly, while this paper describes the process of the Variance Tower calculations, it also provides examples of the output that could be used to define the quantification of results for general resource classification.
Once borehole samples are obtained, the Variance Tower is re-run in conjunction with conventional geostatistical modelling to further classify the results into the mineral resource categories.
Method
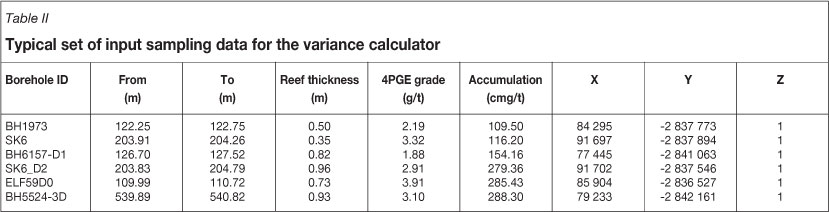
Once borehole or sampling data has been collated and verified for quality assurance and quality control, the basic input data is as follows.
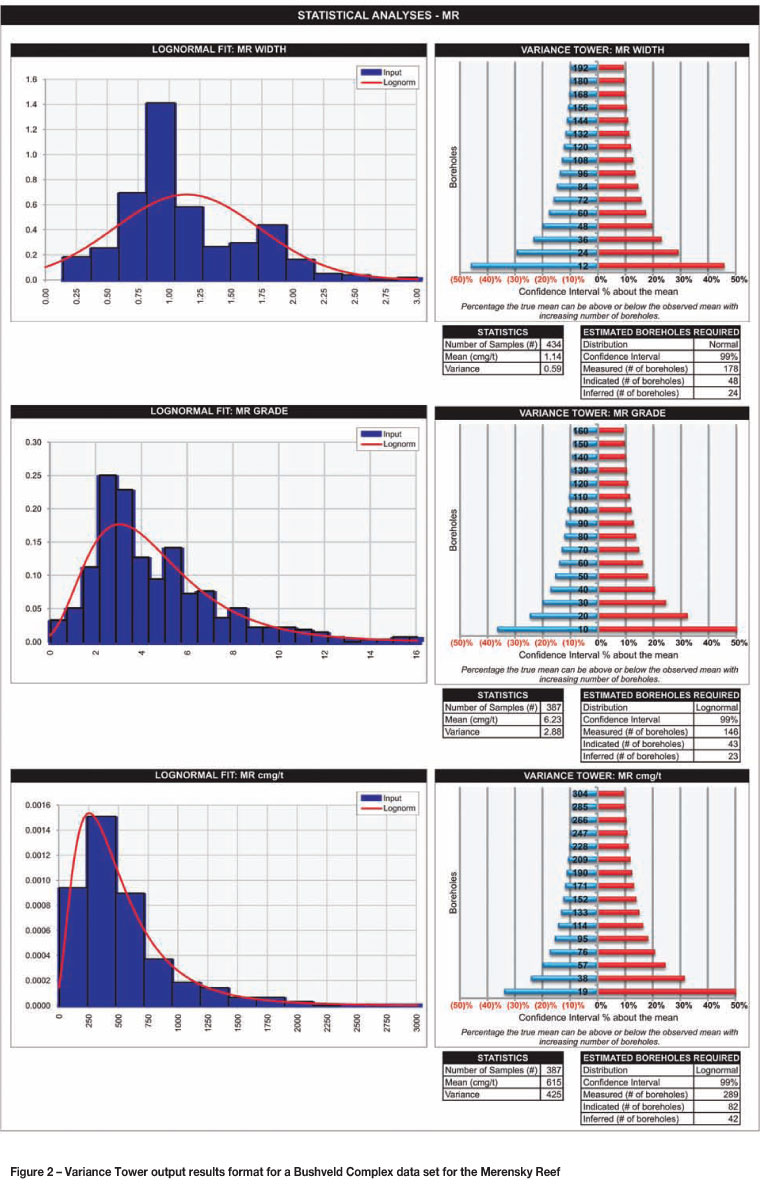
The statistical distributions generated for the data set used in this report are presented graphically to enable an assessment of skewness Figure 2). Where the data was lognormal a β or third parameter was added until a new distribution was generated that is a best fit for the data as a log transform. The p parameter is chosen such that the skewness of log transform of the data added to the p parameter is O. A distribution is fitted to the data.
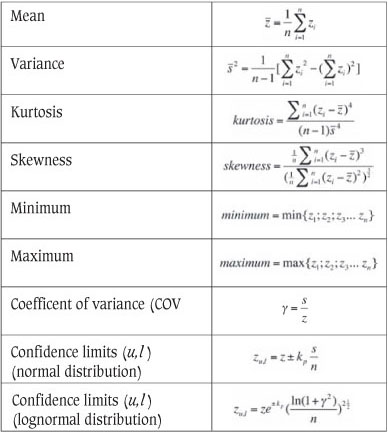
The procedures were as follows. Firstly, the sample data was input into a spreadsheet array and the univariate statistics calculated for estimation of the following parameters:
Confidence intervals are calculated at 95% confidence for different samples sizes based on the distribution. As the number of samples increases, the range of the confidence intervals decreases. This is plotted as a bar chart to indicate the narrowing of the confidence intervals with increasing sample size.
The resultant Variance Towers have the 50% threshold upper and lower limits placed on them to show how many samples (boreholes) are required to calculate a resource in the Inferred category (Figure 2 and Figure 3). The 20% and 10% upper and lower boundaries are also drawn and then the numbers of samples required to classify an Indicated and Measured Resource respectively are defined (Figure 2 and Figure 3).
This process can be carried out initially for historical data and resource information obtained from adjacent properties. The next step is to define a broad, aereally spaced grid of possible borehole sites that meets the suggested number of boreholes required.
At this stage, a simulation exercise can be conducted that generates a sample or borehole intersection that might be obtained from one of the boreholes that is planned as a consequence of the grid spacing that results in the number of boreholes required to achieve the necessary level of confidence. This provides an indication as to the possible result from the borehole, given that an element of randomness can be simulated statistically.
If as a result of the initial prospectivity assessment the company geologists and technical experts wish to estimate, either mathematically or from their judgement, what each borehole might intersect then predictions can be made. The process and the method are iterative, and after each intersection is obtained with full assays the Variance Tower process can be re-run for only the data in the prospect area to determine whether the distribution being generated is statistically related to the total data set.
The method is dependent on statistics and therefore the basic rules and assumptions apply. The size of the area is irrelevant at this stage. The process of establishing the Variance Tower assumes randomness but is irrespective of size of the area until a systematic grid is defined with a spacing that is established by the estimated number of boreholes required to define a mineral resource category. For example, if the Variance Tower analysis using samples from a similar deposit suggests ten boreholes are required, a grid that adequately covers the prospect area and places the ten samples onto the grid with equal coverage will be required.
Output
The output results generated from the methodology described above are shown in Figure 2 and Figure 3.
Classification boundaries
Once the sampling data has been incorporated into the Variance Tower process then, at an early stage, a quantifiable classification process can be undertaken. The threshold values should be:
The suggested threshold for moving any resource from exploration results or 'deposit' to the properly quantified Inferred Resource category is considered an important recommendation of this paper, as it should represent a meaningful approach to deciding when a mineral asset is being defined.
This simple rule would eliminate any misunderstanding by non-technical people as to when they have an asset or not. It also should assist the Competent Persons in ensuring they are not unduly persuaded to use their judgement to define something that might otherwise still be speculative at a 'low level of confidence'.
Conclusions
This paper has presented the Venmyn Variance Tower as a means to statistically define the number of samples that should be required to be drilled to enable CRIRSCO mineral resources to be defined for reporting as a mineral asset class. This paper also recommends threshold statistical boundaries to quantify the levels of confidence required to define Inferred, Indicated, and Measured resources as defined by the CRIRSCO Codes. Given that this process is similar to the way in which the petroleum industry reports, it forms a basis from which to assist in convergence of the understanding of resource classification for both the extractive industries.
The methodology is founded upon standard statistics and is important in assisting technical experts and company managers to ascertain how many samples must be taken and how big a budget and a timeframe are required to achieve the objective of defining a mineral resource.
Acknowledgements
This paper and the ideas contained in it was developed over a number of years with the assistance of Dr. C. Lemmer and various clients and staff members of Venmyn. To a great extent, the principles incorporated here are founded on the methods developed and established by eminent mining professionals including, but not restricted to, Professor Danie Krige and Dr. Isobel Clark.
References
CAWTHORN, R.G. 2011. Geological interpretations from the PGE distribution in the Bushveld Merensky and UG2 chromitite reefs. Journal of the Southern African Institute of Mining and Metallurgy, vol. 111. pp.67-79. [ Links ]
CLARK, I. 1977a. Practical kriging in three dimensions. Computers and Geoscience, vol. 3. pp. 173-180. [ Links ]
CLARK, I. 1977b. Regularization of a semivariogram. Computers and Geoscience, vol. 3. pp. 341-346. [ Links ]
COMMITTEE FOR MINERAL RESERVES. INTERNATIONAL REPORTING STANDARDS (CRIRSCO). 2010. Mineralisation Beyond Inferred Resources- A CRIRSCO Position Paper. [ Links ]
DE WIJS, H.J. 1951. Statistics of ore distribution. Part I: Frequency distribution of assay values. Geologie en Mijnbouw. Journal of the Royal Netherlands Geologiccil and Mining Society, New Series, vol. 13, no. 11. pp. 365-375. [ Links ]
DE WIJS, H.J. 1953. Statistics of ore distribution. Part 11: Theory of binomial distribution applied to sampling and engineering problems. Geologie en Mijnbouw. Journal of the Royal Netherlands Geological and Mining Society, New Series, vol. 15, no. 1. pp. 12-24. [ Links ]
ELLIOT, D. 2009. United Nations Framework Classification System- Discussion Paper. version 5. [ Links ]
GAIN, S.B. 2009. The geological Setting of the platiniferous UG2 chromitite layer on the farm Maandagshoek, eastern Bushveld Complex. Economic Geology, vol. 77. pp.1395-1404. [ Links ]
INTERNATIONAL ACCOUNTING STANDARDS BOARD (IASB). 2000. Extractive Industries Issues Paper. [ Links ]
INTERNATIONAL ACCOUNTING STANDARDS BOARD (IASB). 2009. A Review of the IASB Working Group's Extractive Industries Discussion Paper. [ Links ]
KRIGE, D.G. 1951. A statistical approach to some basic mine valuation problems on the Witwatersrand. J. of the Chem. Metall. and Min. Soc. of S.A. vol. 52, no. 6. pp. 119-139. [ Links ]
KRIGE, D.G. 1952. A statistical analysis of some of the borehole values in the Orange Free State goldfield. J. of the Chem. Metall. and Min. Soc. of S.A. vol. 53, no. 3. pp. 47-64. [ Links ]
KRIGE, D.G. 1981. Some theoretical and practical aspects of geostatistics as practised in South Africa. Geostatistics Conference, UNISA. [ Links ]
Krige, D.G. 1996a. A practical analysis of the effects of spatial structure and of data available and accessed on conditional biases in ordinary kriging. International Geostatistics Congress, Wollongong, Australia. [ Links ]
KRIGE, D.G. 1996b. A basic perspective on the roles of classical statistics, data search routines, conditional biases and information and smoothing effects in ore block valuation. Conference on Mining Geostatistics, Kruger Nationl Park, South Africa. [ Links ]
MATHERON, G. 1963. Principles of geostatistics. Economic Geolology. vol. 58. pp. 1246-1266. [ Links ]
MATHERON, G. 1971. The theory of regionalized variables and its applications. Cahiers du Centre de MorphologieMathematique, no. 5. p. 211. [ Links ]
MISKELLY, N. 2003. Progress on International Standards for Reporting on Mineral Resources and Mineral Reserves. CRISCO. pp. 1-22. [ Links ]
SCOON, R.N. and Mitchell, A.A. 2004. The platiniferous dunite pipes in the eastern limb of the Bushveld Complex: review and comparison with unmineralized discordant ultramafic bodies. South African Journal of Geology, vol. 107, no. 4. pp. 505-520. [ Links ]
SPE Oil and Gas Reserves Committee. 2007. Petroleum Resources Management System. [ Links ]
STORRAR, C.D. 1966. Ore valuation procedures in the Gold Fields Group. Procedural Symposium on Mathematical Statistics and Computer Applications in Ore Valuation. pp. 276-298. [ Links ]
SOUTH AFRICAN MINERAL RESOURCE COMMITTEE (SAMREC) Working Group. 2007. The South African Code for the Reporting of Exploration Results, Mineral Resources and Mineral Reserves (The SAMREC Code). [ Links ]
WAGNER, P.A. 1929. The Platinum Deposits and Mines of South Africa. Oliver and Boyd, Edinburgh. [ Links ]
© The Southern African Institute of Mining and Metallurgy, 2012.ISSN 2225-6253. Paper received Nov. 2011; revised paper received Jul. 2012.

