


Servicios Personalizados
Articulo
 Inglés (pdf)
 Articulo en XML
 Referencias del artículo
Indicadores

Links relacionados
-
 Citado por Google
 -
 Similares en Google
Compartir

 Permalink
Journal of the Southern African Institute of Mining and Metallurgy
versión On-line ISSN 2411-9717
versión impresa ISSN 2225-6253
J. S. Afr. Inst. Min. Metall. vol.112 no.11 Johannesburg nov. 2012
Measurements on freshly-deposited surfaces of two platinum tailings dams
G. BlightI; A. CopelandII; P. JardineIII; C. MacRobertIV
IUniversity of the Witwatersrand, South Africa
IIAnglo American Mining and Technology, South Africa
IIIFraser Alexander Tailings, South Africa
IVThe Southern African Institute of Mining and Metallurgy, 2012..ISSN.2225-6253. This paper was first presented at the, 15th International Seminar on Paste and Thickened Tailings (Paste) 2012, 16-19 April 2012, Sun City, South Africa
SYNOPSIS
As part of an investigation of possible water-saving measures at Anglo American Platinum's Mogalakwena Mine in Limpopo, South Africa, a study was made of conditions on the wet beaches of two adjacent tailings dams, each serving a separate plant on the mine. For one of the dams, a special catamaran was designed and constructed to enable the full length of wet beaches to be accessed and sampled immediately after a layer of tailings had been deposited. For the other dam, the wet beach was accessed using conveyor belting and scaffold planks. The length of the beaches was 400 m on the first dam, and 200 m on the second, and each was sampled at 50 m intervals. The parameters reported in this paper, for both beaches, are:
► Water content profiles along each beach from the surface to as deep as 2.5 m, at times ranging from 12 hours to 6 weeks from the end of deposition
► Particle size distributions at the surface, down the full length of the beaches
► Measurements of feed relative density, tonnage and volume, decant and drain flow volumes, as well as rainfall and evaporation for both dams.
The surface water contents shortly after deposition have been used to establish the relative density of the settled, decanted tailings and its variation down the beach. This data, combined with the decant and drainage flows, is used to establish the calculated and actual water recoveries from both dams.
Keywords: tailings, water recovery, evaporation, settling, desaturation, thickening.
Introduction
The research described in this paper arose from a paper presented to the Paste 2008 conference (Lyell et al., 2008). The ideas in the paper led to setting up a large-scale investigation into ways of saving water at the Mogalakwena platinum mine in Limpopo province, South Africa. The objectives were to make detailed measurements of the feed relative density, tonnage and volume, and corresponding decant and drain flows, over a range of rates of rise. Hence, it was intended to investigate the effect of rate of rise on water recovery by constructing accurate water balances for the tailings dams serving the mine.
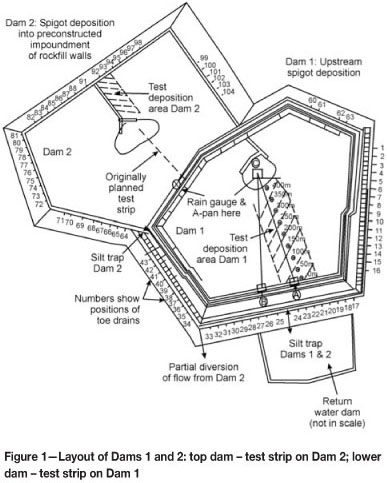
Mogalakwena, at that time, operated two back-to-back tailings dams, each having 100 ha of depositional area. Each dam served a separate plant, Dam 1 the South Plant and Dam 2 the North Plant. The respective annual tonnage rates on a dry basis were Dam 1: 3.5 x 10⁶ Mt and Dam 2: 7.0 x 10⁶ Mt. The nominal rate of rise for Dam 1, commissioned in 1991, was 2.3 m/a and that for Dam 2, commissioned as a temporary facility in 2008, 4.6 m/a. Figure 1 shows the plan layout of the two dams. A possible drawback in the choice of the experimental site was that the construction of the two dams is different. Dam 1 is of conventional upstream spigoted tailings construction, whereas the outer wall of Dam 2 is constructed of dumped waste rock and the storage volume was filled via a series of spigots spaced at 3 m horizontal intervals.
Methodology
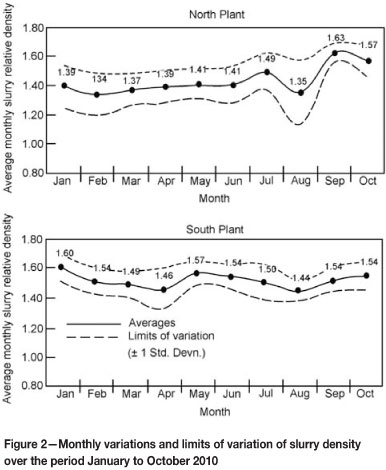
Measurements of feed relative density and flow rate were available for variation (± 1 standard deviation) for both plants at half-hourly intervals, 24 hours per day. Figure 2 shows monthly averages and limits of variability for feed slurry relative density (RD) (bulk density of tailings/density of water), sent out from both the North and South plants during the test period, which extended from January to October 2010.
The penstocks of both dams discharge, via silt traps, into a concrete-lined trapezoidal solution trench that also collects the discharge from the perimeter toe filter drains. The entire flow is discharged from the silt trap for Dam 1 into the return water dam (see Figure 1). To measure the flows, a series of rectangular measuring weirs was constructed at strategic points so that the flows from Dams 1 and 2 could be measured separately. The flow into the penstock tower inlet on each dam was also measured, as was the flow out of the penstock outfall pipes. Drain flows, which were a negligible part of the total decant flow, were measured weekly, by bucket and stopwatch.
Decanting from the dams was confined to daylight hours, i.e. 06:00 to 18:00. At 18:00 each day, the penstocks were ringed up for the night. Heads over the measuring weirs and penstock inlets were measured and recorded every hour by a team of observers working in two shifts, 06:00 to 12:00 and 12:00 to 18:00, throughout the period of the tests. Each measuring weir was calibrated by multiple measurements with a hand-held current meter. The flows into the penstock inlets and out of the penstock outfall pipes were also calibrated by a current meter.
Rain precipitation was measured by means of a gauge located on the common wall between the two dams, and a standard American A-pan was set up at the same location to measure evaporation. The rain gauge and evaporation pan were observed at 06:00 each day.
Sampling of the wet beach on Dam 1 was carried out by a sampling catamaran, specially designed and built for the purpose. The catamaran was towed by an endless cable and a fixed electrical winch, over route AC in Figure 1, with the cable path going from A to C to B, or in reverse. Sampling stations were marked by poles set up at 50 m intervals, as shown in Figure 1. Care was taken to backfill all sampling holes with tailings rammed back into the holes and the sampling positions were changed for each test deposition to ensure that a backfilled sample hole was never accidentally re-sampled.
It was originally intended to use two catamarans, one on each dam, towed by means of nylon ropes that would float on liquid tailings. At the last moment, this plan was vetoed by the mine safety officer, who considered a nylon rope to be a fire hazard and insisted that a steel cable be used. This quadrupled the towing forces and necessitated buying a more powerful winch, but because the catamarans, one for each dam, had already been built, the original plan was persisted with. The catamaran worked successfully for Dam 1, but on Dam 2 the heavy steel cable repeatedly sank into the tailings when attempting to take it over the pool, and could not be extricated. Eventually, after breaking the cable several times, the original plan had to be abandoned. Instead, a test strip was set up parallel to the pool wall, as shown in Figure 1. The same procedures were followed in sampling, but on a beach necessarily of reduced length. The second catamaran was never used.
It was originally intended to deposit and sample the test strips on Dams 1 and 2 simultaneously, especially because Dam 2, which had been built as a temporary facility while a permanent Dam 3 was being prepared, was scheduled to be, and was, decommissioned starting at the end of June. Because of the problem with the steel cable, the tests on Dam 1 had to proceed on their own. In the end, special arrangements were made to divert tailings from the new dam back to Dam 2 to carry out the test depositions. For this reason also, while the water balance data analysed later in the paper covers April to November for Dam 1, it covers only April to the end of June for Dam 2, and there is no water balance data for the whole of Dam 2 while the test depositions were in progress.
Data and results
Relative density of tailings settled on the beach
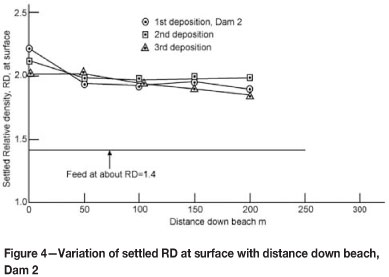
Figure 3 shows the results of sampling the four test depositions on Dam 1, each of which was 400 mm thick at the point of deposition. Each deposition took four days to complete. The notes on Figure 3 record the circumstances and timing of each sampling. The sampling method and timing had to go through a learning process and it is considered that of the four sets of data, the second and fourth best represent the RD of the settled tailings, after decanting and most of the bleeding had occurred. Deposition 1 was sampled by augering, but obviously took place too late for the measurements to be representative of freshly placed tailings. Subsequent samples were taken from the surface using a gardening trowel. As the notes on Figure 3 show, the third sampling was taken too soon. What are considered to be the most representative results show that the RD of the freshly settled tailings was between 1.8 and 2.0, being higher at the head of the beach where the tailings were sandier and lower towards the pool where the tailings contained more particles smaller than 2 µm Figure 4 shows the data for settled RD for the three depositions made on Dam 2. The results were very similar, and the average RD of the tailings settled on the beach was close to 2.0.
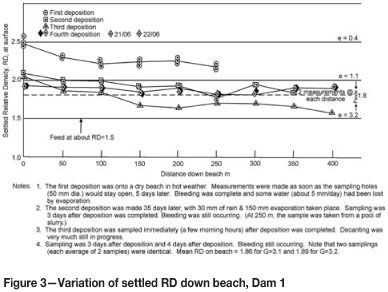
It has been known for at least 30 years that tailings slurry deposited on a beach or in an underground stope as stope support will settle and drain during deposition, from the RD range of 1.4 to 1.7, at which it is deposited, to 1.8 to 2.1 on the beach or in the stope. Figure 5, for example, shows measurements made by Dr Gary Bentel as part of his Master's research in 1980 (Bentel, 1981; Blight, 2009). A recent publication (Vietti et al., 2010) dispute this data, but examination of their test method shows that this was faulty, as only 30 minutes were allowed for settlement of the low RD tailings to occur, whereas at least 24 hours should have been allowed.

Bentel sampled a series of wet platinum tailings beaches at the Bafokeng (now Impala) Mine by walking out on the beaches with polystyrene foam floats tied to his feet (Bentel, 1981). Also in the early 1980s, measurements were made in a deep gold mine in South Africa, of the relative density of uncemented tailings fill deposited as support in a 30 m long stope, dipping at 20°. The full plant tailings were deposited at RD = 1.7 and within 2 days had settled to RD = 1.95 at the top of the stope, RD = 1.97 at mid-length, and 1.99 at the toe. Hence the results in Figures 3 and 4 were as expected.
Distribution of particle sizes down the beach
Figure 6 summarizes measurements of the variation with distance down the beach of the sand (0.06-2 mm), silt (0.002-0.06 mm,) and clay (<0.002 mm) fractions of the tailings, with the grading curves for the feed shown to the right. The grading of the feed for Dam 1 was slightly coarser than that for Dam 2 in the silt size range, but had almost the same clay size percentage. The difference in the variation down the beach is more pronounced, but it must be borne in mind that the length of beach on Dam 1 was considerably greater than that of Dam 2. That is, Figure 6 compares the particle size variation over the first half of the length of Dam 1's beach with that over the entire length of the beach for Dam 2.
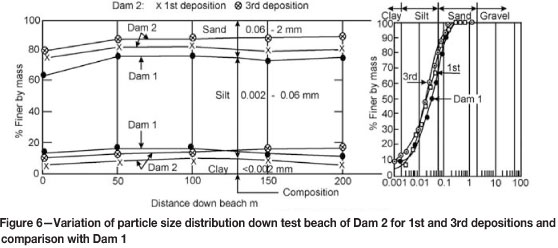
The increased sand content over the first 50 m of beach on both dams is clearly shown by Figure 6. For Dam 1, the sand content decreases from 36 per cent at 0 m to 24 per cent at 50 m and then remains reasonably constant to 200 m. Beyond 200 m (not shown in Figure 6) the sand content gradually decreases to 10 per cent close to the pool. For Dam 2, the sand content starts at 20-25 per cent and decreases to 15 per cent at 50 m. Thereafter, the sand content remains almost constant up to 200 m.
It is this outer, approximately 50 m wide, shell of sandier tailings that is so effective in depressing the phreatic surface close to the outer perimeter of a dam built of beached tailings (e.g. Blight, 2003).
Drying of the tailings beaches
To aid in understanding the process of drying of the tailings beaches, a small-scale experiment was set up. A sample of tailings was placed in a small plastic bucket with a depth of 120 mm and a diameter of 150 mm. The bucket was contained in a cardboard box, the base and sides of the bucket being insulated with a minimum of 25 mm of dry wood shavings. This represented a 120 mm thick surface layer of tailings, isolated from interchange of pore water with the tailings around or below it and with the insulation preventing any gain or loss of heat by the tailings specimen, except through the top surface. Changes of mass of the tailings could be measured very accurately to 0.5 g, which represented a water loss or gain of 0.03 mm (1 kg/m2 = 1 l/m2 = 1 mm). To record the development of pore water suction in the tailings, two calibrated gypsum block sensors were set into the tailings, one centred 20 mm from the surface and the other at 100 mm below the surface. Gypsum block sensors have been widely used since 1947 (Bouyoucos and Mick, 1947) and are completely reliable and accurate, if carefully calibrated.
The bucket of tailings and an identical insulated bucket of water were exposed to the weather, supported 1 m above the ground on a small wooden table, in an area receiving sun from sunrise to sunset. The test was carried out in cool weather during May/June when there was no rain or cloud.
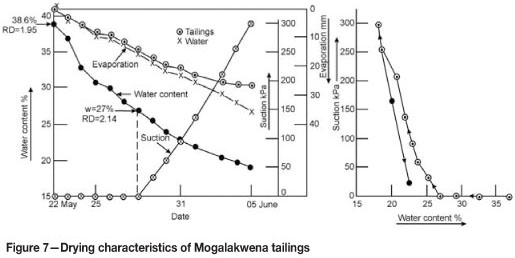
The results of the experiment are shown in Figure 7. Referring to the left diagram, starting at a value of 38.6 per cent (RD = 1.95) the water content declined to 27 per cent before the gypsum blocks registered any suction, after 7 days of exposure. As the water content continued to decline, the suction rose steadily by the day, reaching 300 kPa after another 7 days. The important point to note is that suction is generated only once the water content falls below a threshold value (i.e. its field capacity), in this case 27 per cent. Until this threshold is reached, the pore water is unstressed, and therefore free either to seep downwards into the tailings below under the gravity pressure gradient, or to be evaporated. (Note that water content is defined as mass of water/mass of dry solids.)
A suction of 300 kPa represents 30 m of negative water head, which is sufficient to draw water up to the tailings surface from a depth of 30 m. It must also be noted that the whole mass of tailings retained by the dam is consolidating under its own weight. As the dams at Mogalakwena are built on Rustenburg Layered Suite geology, they rest on a highly impervious black clay stratum, for which the permeability, measured in the laboratory, is 0.03 m/a compared with 2-3 m/a for the tailings. Although originally desiccated and highly fissured, the clay is now swollen with seepage water and compressed by the considerable overburden imposed by the tailings. Hence, water expelled by consolidation is much more likely to be moving towards the surface of the tailings rather than towards the impervious foundation stratum. The combined effect of consolidation and surface evaporation would therefore be to add to surface bleeding, which is potentially decantable.
Calculations based on the consolidation characteristics of the Mogalakwena tailings show that the tailings mass of Dam 1 is 90 per cent consolidated and the surface of the tailings is settling at between 1 and 0.1 mm/day, depending on the assumptions made. As the porosity of the tailings is about 0.6, 0.6-0.06 mm/day of consolidation water is being liberated at the surface. This is enough to partly supply the evaporation during hot weather, to keep the near-surface tailings damp during cool weather, and to add slightly to decantable water during wet weather. Dam 2 is only 70 per cent consolidated because of its higher rate of rise, but its rate of surface settlement is similar. Because the calculations were based on properties for the total tailings and because much of the sand settles out in the first 50 m of beach, the above result is believed to be on the low side of the actual surface settlement.
The left diagram in Figure 7 shows the cumulative water evaporation from both the tailings and water surfaces. Initially, there was very little difference in evaporation losses from the water and tailings surfaces, but once the suction threshold had been passed, evaporation from the tailings slowed, while that from the water surface continued at an almost constant rate. This is mainly because the coefficient of permeability of the surface crust of tailings reduces considerably as the tailings progressively desaturates.
The right diagram in Figure 7 shows the suction-water content curve (or SWCC) for the tailings. After the suction reached 300 kPa, the tailings were re-wetted in two stages so as to develop the re-wetting branch of the SWCC. Note that the re-wetting branch is both considerably steeper and, within the suction range of 0-300 kPa, almost completely reversible.
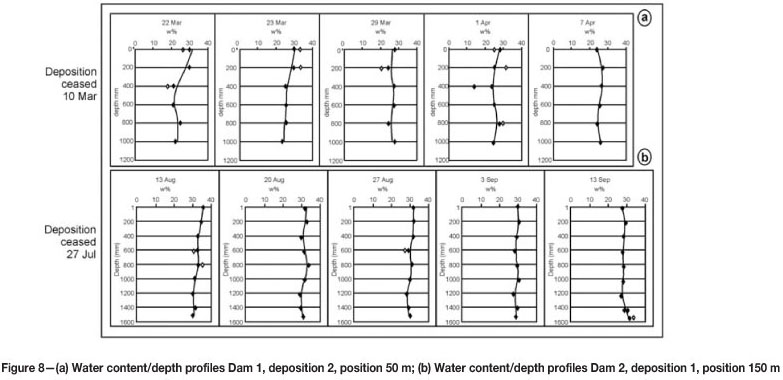
Figure 8 shows typical water content profiles at various times after deposition for the test depositions - the section marked (a) on Dam 1 and the section marked (b) on Dam 2. Considering (a), a depth of 400 mm represents the surface of the previous layer, where on 22 March there was evidence that the surface had dried to less than 20 per cent water content.
The water content at this depth did not increase much above this value, because the tailings would now have been on the re-wetting branch of the SWCC (Figure 7, right). It will also be seen that it took 13 to 14 days for the water content at the surface to decrease below 30 per cent, and 28 days after deposition had ceased the surface water content had only decreased by 6 to 24 per cent, i.e. roughly 0.21 per cent per day. Compared with Figure 7 where the water content reduced by roughly 1.4 per cent per day in the first 14 days, the drying appears to have been very slow. This is very likely to be because the surface water content was being augmented continually by water, including consolidation water rising from below. This could not happen in the small-scale test.
Considering Figure 8, it took 21 days for the surface water content to reduce from 36 per cent to 30 per cent, i.e. 0.29 per cent per day. Hence also on Dam 2, it is likely that surface water contents were being augmented continually by water, including by rising consolidation water.
Overall flow quantities and reconciliation with field measurements
The development with time of the overall flow quantities recorded during the tests on Dams 1 and 2 is set out in Figures 9 and 10. In these figures, the water flow units are m3 x 103 and for comparison purposes, dry tons milled have been given in equivalent cubic metres of water (i.e. 1 dry ton milled = 1 m3 water). The cumulative flow values have been analysed for two periods. Period 1 covers 1 April to 30 June, during which both dams were monitored. Dam 2 was decommissioned during July when normal operational deposition and decanting ceased, and only Dam 1 was monitored over the whole of Period 2, which extends from 1 April to 30 November.
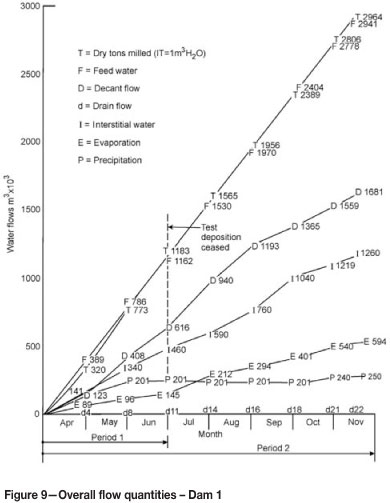
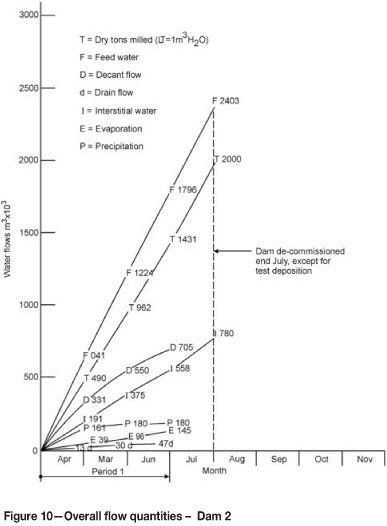
Table I gives a reconciliation and comparison between values calculated from overall measurements recorded automatically by the two plants and field measurements made during the test depositions and by means of the calibrated flumes.
In Table I, (a) shows the overall average water content of the slurry leaving the two plants, calculated from w(avF) = FIT where F is the cumulative feed water leaving the relevant plant and T is the cumulative dry tons milled (see Figures 9 and 10). Line (b) shows the overall average RD of the feed, calculated from the water contents in line (a). Line (c) shows the average RD (see Figure 2) directly measured on the slurry as it left each plant. The comparison gives very close agreement between the calculated and measured RD values.
Line (d) shows the average measured water content of tailings recently settled on the beach w(avB) (Figures 3 and 4), as well as the differences between w(avF) and w(avB) which represents the decanted water per dry ton milled. Line (e) represents the decanted water recovery calculated from [w(avF) - w(avB)] multiplied by T. Line (f) is the water recovery from the measured decant flows (D + d). As shown in Table I, the differences between (e) and (f) are acceptably small for Dam 1, but for Dam 2 the difference is too large for unquestioned acceptance.
Finally, in Table I, lines (g) and (h) show the measured water recoveries as per cent of the feed water F and of dry tons milled T.
The reason for the poor water recovery from Dam 2, (see (e), (f), and (g)) is not far to seek. Because 75 per cent of the length of the walls of Dam 2 was constructed of waste rock, they are highly permeable and allowed water to be lost by seepage from the tailings. During the last operational months of the dam, pools and sheets of water lay in a number of places around the perimeter of Dam 2, between the toe of the rock wall and the solution channel. This was the dry season and the surface water could only have come through the walls of the dam, escaping capture by the toe drains, most of which were not flowing. The water escaping through the rock walls was especially noticeable near drains 64 and 104 in Figure 1. The limits of the pool were a minimum of 200 m from the walls, and the seepage through the rockfill clearly originated from the contained tailings and not from any source of surface water in the impoundment.
Discussion and conclusions
Due to the difficulty of safely accessing a wet tailings beach, very few measurements have been made of the properties of hydraulic fill tailings recently settled on full-sized operational beaches. The present measurements have fully confirmed and extended those of Bentel (1981).
At the 2002 Paste conference held in South Africa, the first-listed author of this paper expressed the opinion that a tailings beach acts as an efficient sub-horizontal thickener, possibly achieving much the same result as a mechanical thickener. The Mogalakwena experiment tends to support that observation. A full-sized tailings beach is indeed an excellent gravitational thickener, with the added advantage of depositing coarser tailings close to the outer perimeter, which results in drawing down the phreatic surface in the outer slopes of the dam.
Table I shows an actual water recovery from Dam 1 of 54 per cent or more. Considering that the water content of the tailings, when initially settled on the beach, was at least 46 per cent of the solids, line (d) in Table I, and the water recovery was 53-57.5 per cent of the tons milled, line (h) in Table I, it is hardly possible to improve on the overall water recovery, which may well include a small proportion of upwelling consolidation water from previously deposited tailings.
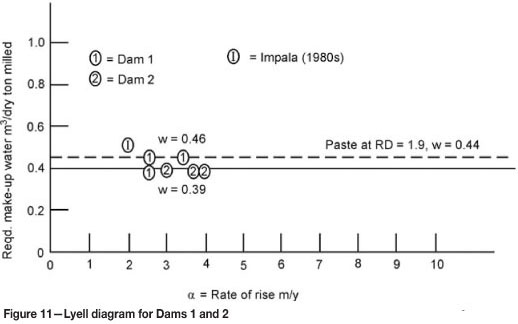
For the range of rates of rise used in the investigation, rate of rise seems to play no part in the overall water recovery, although at slow rates of rise, evaporation and rising consolidation water may be expected to have some effect on water recovery. This conclusion is demonstrated by Figure 11, which shows the diagram originally proposed by Lyell et al. (2008) as it applies to the present investigation.
The intent of the Mogalakwena experiment was to determine what the actual water recoveries were for Dams 1 and 2, and to achieve as accurate a result as possible. We believe this result was achieved. This conclusion does not mean that spigot deposition at RD values of about 1.5 is the optimum (i.e. best possible) method of deposition to maximize water recovery, but if an alternative method is better, this has to be proved by a similar large-scale trial. It cannot be shown by a series of isolated small-scale laboratory tests, or even tennis court-sized field trials.
Acknowledgements
The work was the brainchild of Andrew Copeland and Patrick Jardine and was sponsored by Anglo American Mining and Technology, Anglo American Platinum, and Fraser Alexander Tailings. Field and field laboratory testing was undertaken by Shawn Andersen, Dingaan Botsane, and Ofentse Phete of Fraser Alexander Tailings. Laboratory testing was carried out by Norman Alexander of the University of the Witwatersrand. The raw measurements were reduced by Charles MacRobert and the project was supervised by Geoff Blight.
References
BENTEL, G.M. 1981. Some aspects of the behaviour of hydraulically deposited tailings. MSc (Eng.) thesis, University of the Witwatersrand, South Africa. [ Links ]
BLIGHT, G.E. 2003. Quantified comparisons of disposal of thickened and unthickened tailings. Proceedings of the 10th International Conference Tailings and Mine Waste, 12-15 October 2003, Vail, USA. Swets & Zeitlinger, Lisse, pp. 63-71. [ Links ]
BLIGHT, G.E. 2009. Geotechnical Engineering for Mine Waste Storage Facilities. CRC Press/Balkema, Leiden, Netherlands. 652 pp. [ Links ]
BOUYOUCOS, G.J. and Mick, A.H. 1947. Improvements in the plaster of paris absorption block electrical resistance method for measuring soil moisture under field conditions. Soil Science, vol. 63. pp. 455-465. [ Links ]
LYELL, K.A., Copeland, A.M., and Blight, G.E. 2008. Alternatives to paste disposal with lower water consumption. Paste08. Proceedings of the 11th International Seminar on Paste and Thickened Tailings, Kasane, Botswana, 5-9 May 2008. Fourie, A.B., Jewell, R.J., Slatter, P., and Paterson, A. (eds.). Australian Centrefor Geomechanics, Perth. pp. 171-178. [ Links ]
VIETTI, A., BOSHOFF, J., and Cope, A. 2010. Does thickening save water? The 4th International Platinum Conference, Platinum in transition 'Boom or Bust'. The Southern African Institute of Mining and Metallurgy, Johannesburg, 2010. pp. 7-11. [ Links ] ♦

