


Servicios Personalizados
Articulo
 Inglés (pdf)
 Articulo en XML
 Referencias del artículo
Indicadores

Links relacionados
-
 Citado por Google
 -
 Similares en Google
Compartir

 Permalink
Journal of the Southern African Institute of Mining and Metallurgy
versión On-line ISSN 2411-9717
versión impresa ISSN 2225-6253
J. S. Afr. Inst. Min. Metall. vol.112 no.12 Johannesburg ene. 2012
Characterization and alternative dissolution of tantalite mineral samples from Mozambique
M. NeteI; W. PurcellI; E. SnydersII; J.T. NelII; G. BeukesIII
IDepartment of Chemistry, University of the Free State, Bloemfontein, South Africa
IIThe South African Nuclear Energy Corporation Ltd, (Necsa), Pretoria, South Africa
IIIDepartment of Geology, University of the Free State, Bloemfontein, South Africa
SYNOPSIS
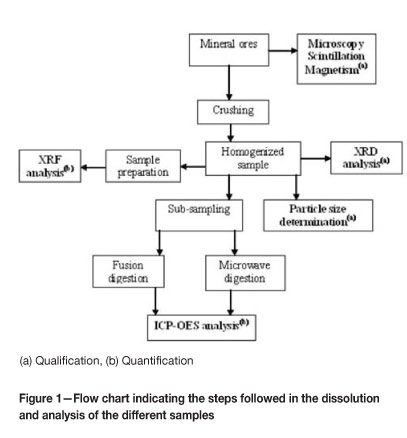
Qualitative analysis of three mineral samples from northern Mozambique was accomplished by X-ray diffraction (XRD), microscopy, scintillation, and magnetic determination. Chemical characterization was accomplished using ICP-OES and pressed powder XRF after dissolution using microwave-assisted digestion and flux fusion.
The samples consisted of a mixture of minerals with tantalite as the major component, with minor amounts of microlite, quartz, mica, accessory garnet, and tourmaline. Incomplete dissolution was obtained using microwave digestion, with maximum recoveries of 90.25 ± 0.06% and 88.90 ± 0.04% for Nb2O5 and Ta2O5 respectively. Complete dissolution using Li2B4O7 resulted in recoveries of 98.5 ± 0.2% Nb2O5 and 100.4 ± 0.3% Ta2O5.
Keywords: tantalum, niobium, qualitative, dissolution, quantitative, analysis, recovery, ICP-OES.
Introduction
The steady increase in demand for niobium and tantalum over the last twenty years is due to their importance in the production of modern industrial materials and 'high-tech' consumer products, ranging from superalloys in the production of jet engines, nuclear reactors, and space vehicle frames to hearings aids, laptop computers, mobile phones, video consoles, GPS, and digital camerasi.
Common features for both metals are: i) their co-existence in natural minerals, ii) the limited number of major producers worldwide, and iii) their similar chemistry. The titano-niobate mineral pyrochlore, which contains up to 66% Nb, is one of the most important sources of niobium and tantalum. Another important source of niobium and tantalum is the niobate-tantalate mineral columbite-tantalite (coltan), which normally contains mixtures of columbite and tantalite with up to 60% Nb content. Columbite and tantalite are variations of the general formula (Fe,Mn)(Nb,Ta)2O6, and the mineral is called tantalite when the tantalum content exceeds the niobium content, and columbite (niobite) when the composition is vice versa2.
Brazil and Canada are the major suppliers of pyrochlore (Ce,Ca,Y)2(Nb,Ta)2O6(OH,F) and Australia and Nigeria the major suppliers of columbite-tantalite. Smaller quantities of coltan are produced by China, Malaysia, Namibia, Russia, Rwanda, Spain, Thailand, Venezuela, Gabon, Mozambique, Zaire, and Zimbabwe. In 2004 coltan production increased dramatically in Mozambique with the opening of the new Naquissupa open-pit mine, which is located in the Gile district, as well as the reopening of the Morrua and Marropino mines in Zambezia provinces. These mines are situated in the Alto Ligonha district of northern Mozambique, which is well known for its pegmatite deposits*.
Investigations into the mineralogical and chemical characterization of tantalum/ niobium-containing minerals in Africa were recently performed in Egypt and Nigeria. The Egyptian study5 concentrated on ore from the Kab Amiri area and indicated a mineral mixture consisting of niobium-tantalum bearing euxinite (Y,Er,La,Ce,U,Th) (Nb,Ta,Ti)2O6 associated with zircon (ZrSiO4) and davidite (La,Ce,Ca)(Y,U)(Ti, Fe)20O38. Chemical characterization of this mineral mixture indicated a 7.90% Ta2O5 and 10.60% Nb2O5 content with U3O8 (17.5%), ThO2 (10.0%), and rare earth elements (14.2%) as major impurities. Only partial Ta and Nb recoveries with H2SO4 leaching were obtained in this study. The Nigerian study& included eight samples collected from different geographical locations in the country and indicated the presence of a more complicated mixture of minerals. These ore mixtures contained tantalite and niobite as major minerals, with smaller amounts of ilmenite (FeTiO3), haematite (Fe2O3), wolframite (Fe,Mn)WO4, cassiterite (SnO2), and zircon, as well as uraninite (UO2). The chemical analysis proved that these ores are rich in both Ta and Nb, with 8-60% Ta2O5 and 20-38% Nb2O5 content, and MnO (0.74-10.1%), Fe2O3 (2.85-10.69%), and TiO2 (up to 33.38%) as major impurities.
Many of the Nb/Ta deposits south of the Sahara are located in countries such as Gabon, Zaire, and Mozambique, which all have poorly developed research and mining infrastructures, and little is known about the mineral constituents of Ta/Nb-containing ores in the southern part of Africa.
The first few steps in the separation and beneficiation of these mineral samples involve the characterization, dissolution, and quantification of the elements present. Currently, Nb/Ta-containing minerals are mainly decomposed/dissolved using acid mixtures of HF and other mineral acids7-11 or HF digestion combined with microwave digestion (95-104% Nb metal? and 95-100% Nb2O5)8. Different flux fusion methods have also been studied. The use of lithium metaborate/tetraborate and HF7 (and the use of KOH as flux with low-grade coltan) indicated quantitative decomposition12. The use of K2S2O7 as flux and extraction with tartaric acid or oxalic acid10 was found to be less successful7-14. Alternative fluoride sources such as NH4HF2, NaF, KF, and CaF2 have been used as fluxes15, but no experimental results have been published.
A large number of techniques have been employed to quantify niobium and tantalum in chemical samples. These techniques included both destructive and non-destructive methods. Quantification of the elements using methods such as atomic absorption spectrometry (AAS), inductively coupled plasma - optical emission spectrometry (ICP-OES), or mass spectrometry (ICP-MS)7-9,16 require sample dissolution as the first step, while non-destructive solid sample analytical methods such as wavelenght-dispersive X-ray fluorescence (WD-XRF)6, laser ablation inductively coupled plasma mass spectrometry (LA-ICP-MS)17, and electrothermal atomic absorption spectrometry (ETAAS)18 have been used in order to avoid time-consuming digestion steps and possible analyte loss and contamination. A recent study in our laboratory19 indicated the successful use of microwave digestion as well as Li2B2O7 flux-fusion as dissolution methods for a number of high-purity Nb-containing samples, including Nb2O5. ICP-OES results indicated a recovery of 99.90% for Nb metal, 98.8% for Nb2O5, and 100.7% for NbF5 with microwave dissolution, while flux fusion of Nb2O5 with Li2B4O7 yielded 103% Nb recovery. The successful recovery of Nb2O5 using these two methods prompted us to investigate their usefulness on tantalite-columbite itself, which normally consists mainly of Nb2O5 and Ta2O5. Research also indicated that the difference in chemical composition of the minerals themselves or the possible combinations of different minerals (especially during the pre-concentration of low-grade ores) complicated the dissolution process. Different mineral compositions led to partial dissolution, which prevented the complete chemical quantification of the elements in the minerals16,20.
The main aim of this study was to perform a physical and chemical characterization on three ore mixtures obtained from tantalite mines in the Gile district of northern Mozambique. A further goal was to evaluate the effectiveness of microwave digestion and lithium tetraborate flux on the dissolution of the mineral constituents of tantalum/niobium-bearing mineral samples. This was in order to evaluate potential alternative, more environmental friendly and universal dissolution methods for tantalite minerals. In order to understand the basic mineralogy of the three samples, physical characterization was accomplished using techniques such as X-ray diffraction (XRD), spectrometry, microscopy, and scintillation and magnetic determinations. The quantification studies were done using ICP-OES and XRF spectroscopy. Results obtained from this characterization study were then used in the follow-up study to investigate the possible beneficiation of the ore prior to dissolution, which is normally the first step in the mineral processing chain.
Experimental
Apparatus
A Shimadzu ICPS-7510 ICP-OES sequential plasma spectrometer controlled by a computer was used for the wet analysis of the samples. Direct analyses on the solid samples were undertaken at the Geology Department at the University of the Free State using XRD and XRF. XRD analyses were conducted using a Siemens D5000 diffractometer. XRF analyses were performed on a PANalytical wavelength-dispersive X-ray fluorescence spectrometer (WDXRF) with a rhodium tube as a radiation source. An Anton Paar Perkin-Elmer Multiwave 3000 microwave reaction system equipped with an 8SXF100 rotor and eight polytetrafluoroethylene (PTFE) reaction vessels was used for the acid dissolution of samples. Flux fusions were performed in a high-temperature oven.
Reagents
Separate standard solutions containing 1000 ppm Th and U were obtained from De Bruyn Spectroscopic Solutions, while 1000 ppm standards of Nb, Ta, W, Si, Ti, Sn, and Y were sourced from Merck. The multi-element standard No. XXVI containing 1000 ppm each of Mn, Al, Fe, and Ca was also sourced from Merck. Three tantalum/niobium-bearing mineral samples, demarcated as sample A, sample B, and sample C, were supplied by the South African Nuclear Energy Corporation Limited (Necsa). Analytical grade H2SO4 (9598% ACS) was used in this study. Lithium tetraborate was obtained from Johnson Matthey Materials Technology.
Preparation of standards and samples
Three mineral samples were studied, of which two, demarcated as sample A and sample B, were sourced from different veins of the open-pit mine in the Naquissupa area in Mozambique, while sample C came from a different mine in the same region. Sub-samples of the three mineral samples were ground to a fine powder (to obtain a homogenous sample) using a vibration grinding mill with a steel milling vessel at the Geology Department at the University of the Free State. The powder samples were further sub-sampled for particle size determination, XRD, XRF, and ICP-OES analyses. A summary of the processes that were followed in the analyses of the mineral samples is shown in the flow chart in Figure 1.
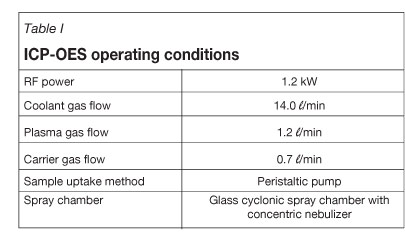
Standard solutions for ICP-OES analysis were prepared by adding the appropriate volumes of the standards to 10 ml 95-97% H2SO4 in 100.0 ml volumetric flasks and diluting to the mark with double-distilled water. The emission intensity measurements were made under constant conditions indicated in Table I, which are prescribed by the instrument manufacturer since they are optimized for a variety of elements.
Particle size determination
The particle size distributions in samples A, B, and C were determined at Poretech using a Saturn DigiSizer 5200 V1.12. The median values for the particle sizes (d50 values) were determined as 9.8 [m, 9.5 [m, and 11.1 \m for samples A, B, and C respectively.
Qualitative analysis of mineral samples
The mineral samples were qualitatively analysed by XRD on a Siemens D-5000 X-ray diffractometer as well as visual examination by stereo and optical microscopy. Other physical properties of the samples were studied by scintillometric and magnetic methods.
The bulk magnetic susceptibilities of the three samples were measured with a Sherwood Scientific magnetic susceptibility balance (MSB) at 20°C. The MSB balance was reset to zero and the Ro value of the pre-weight glass tube was determined prior to the magnetic susceptibility measurements. Each sample (accurately weighed to 0.1 mg) was then placed in the tube and the R-value recorded. The actual height of the sample in the tube of the sample was then measured and the mass susceptibility (Xg) was calculated using the following formula.
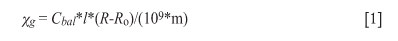
The reported values represent the average of five replicate measurements.
ICP-OES quantification
Microwave-assisted acid digestion
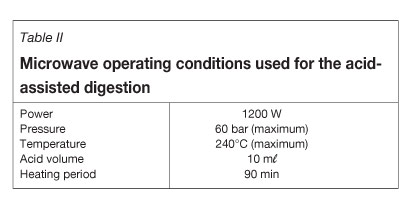
Sample aliquots of approximately 0.10 g were weighed accurately to the nearest 0.1 mg in glass vials and quantitatively transferred to the PTFE microwave vessels, followed by addition of 10 ml of 95-97% H2SO4. The vessels were sealed and the rotor was tightened. The digestion was accomplished under the microwave conditions summarized in Table II. Digestion time was varied between 45 and 150 minutes to investigate the influence of digestion time on dissolution efficiency. Visual inspection of the samples after digestion (for all exposure times) indicated that some solid remained undissolved. The solid was removed by filtration into a 100.0 ml volumetric flask and the vessels were rinsed four times with distilled water to quantitatively transfer the contents into the volumetric flasks. The flasks were then filled to the mark with distilled water. The solutions were allowed to stand overnight to attain a stable temperature for efficient flow rate and analysed by ICP-OES on the following day. Results from these analyses are presented in Table III. Sample digestion procedures and measurements were repeated in triplicate for each time-dependent study for all three samples to ensure reproducibility of the analytical results.

Fusion dissolution
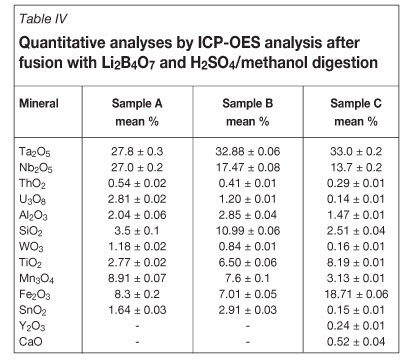
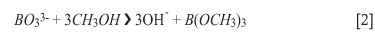
Approximately 0.10 g of each of the mineral samples was weighed accurately to 0.1 mg and placed in a platinum crucible. Approximately 2.0 g lithium tetraborate fluxing reagent was added to the crucible and thoroughly mixed with the sample before heating. The crucible was then placed in a high-temperature oven and heated to 1100ºC for 30 minutes to produce a glassy melt. The melt was cracked to facilitated faster dissolution by placing the hot crucible in a cold water bath. 10 ml of 95-97% H2SO4 were pipetted into the cold melt, followed by the slow addition of approximately 30 ml methanol to prevent formation of boric acid and to facilitate the volatization of boron as the trimethyl borate18,21. The crucible was then heated to 40°C for 45 minutes on a hot plate with constant stirring to remove both the boron ester and the excess methanol. The clear solution was quantitatively transferred to a 100.0 ml volumetric flask and diluted to the mark with distilled water. Quantification was performed with the ICP-OES the following day, using standard addition as described previously19. The results of this analysis are presented in Table IV. The whole process was carried out in triplicate to ensure the reproducibility of the results.
XRF analysis
XRF measurements were performed on pressed powders using the 'Major pellets Programme' and the 'Pro-trace Programme', depending on the relative concentration of the elements in the mineral sample. For the 'Major pellets Programme', approximately 8.0 g of the sample (accurate to 0.1 mg) was added to 3.0 g Hoechst wax (binder material) and mixed for 30 minutes to obtain a homogeneous sample (approximately 11.0 g). For the 'Pro-trace Programme', approximately 0.08 g of the mineral sample (weighed accurately to 0.1 mg) was added to 7.92 g SiO2 and approximately 3.0 g Hoechst wax, and mixed thoroughly for 30 minutes by a flask shaker to ensure a homogeneous mixture. Pellets or disks of 30 mm diameter and 9 mm thickness were used for the analyses.
Results and discussion
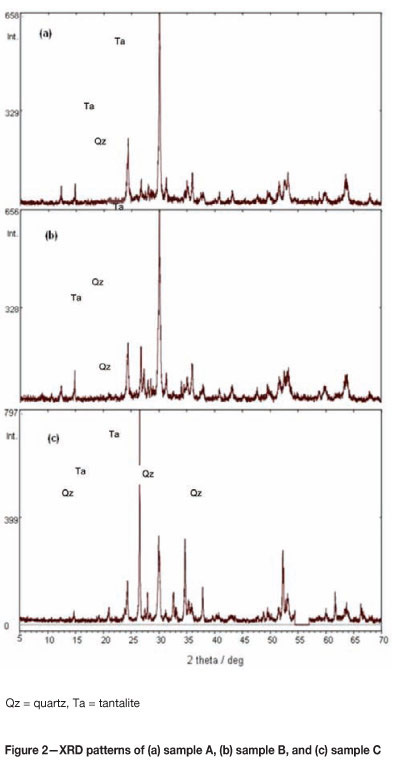
Qualitative analysis of mineral samples by X-ray diffraction analysis
The results obtained from the XRD analyses showed that sample A and sample B are similar, with minor differences in the intensity of some of the main peaks indicating quantitative differences of the components, especially quartz (Figure 2a and 2b). The XRD pattern also showed that samples A and B contained manganotantalite as the major component with minor quartz (SiO2), microlite ((Na,Ca)2Ta2O6(O,OH,F)), and muscovite (KAl2(Si3Al)O10(OH,F)2). The XRD pattern of sample C (Figure 2c) showed quartz to be the dominant constituent with minor tantalite and accessory muscovite, confirming the mineralogical differences of the samples. According to the quantitative analyses by ICP-OES and XRF, the tantalite in this sample contains more iron and less manganese than samples A and B, which rather points to the name ferrotan-talite as being more suitable for sample C.
Magnetic properties
Since the XRD patterns indicated a mixture of minerals in all the samples studied, it was decided to investigate the magnetic properties (which could be of great importance in the processing of the minerals to metallic elements) as well as the radioactive properties of the coarse mineral samples to corroborate their positive identification. Sample C showed a higher magnetic susceptibility with a large number of its grains/particles reacting to the magnetic field, followed by sample A, and finally sample B, which showed very little magnetism. Quantitative analysis by ICP-OES revealed that the high susceptibility observed in sample C is due to the higher Fe and Ti contents (Tables III and IV). The magnetic susceptibility measurements clearly confirm the trend in iron content (sample C > sample A > sample B), with the magnetic susceptibility of sample C an order of magnitude larger than the other two samples (Table V).
Scintillometric detection
Radioactivity determinations were accomplished using a scintillometer, which showed that both samples A and B contained radioactive materials as confirmed by the presence of uranium (1.20 ± 0.01% to 2.81 ± 0.02% U3O8) and thorium (0.41 ± 0.01% to 0.54 ± 0.02% ThO2) (Table IV). Very little detectable radioactivity was observed in sample C, as was confirmed by low U3O8 and ThO2 contents in the quantitative analyses. The radioactivity in these samples (A and B) could be due to the presence of euxenite, which always contains radioactive elements22 and which was observed with microscopic analyses in the current study. However, very small amounts of euxenite may be sufficient to induce metamictization (destruction of the crystalline structure by internal radiation), which is commonly evident in euxenite23.
Microscopic examination
The coarse mineral samples were also investigated using both stereo and optical microscopes in order to identify the minerals present. Microscopic examination showed grains of tantalite (possibly manganotantalite, as suggested by the quantitative chemical analysis results), microlite, quartz, muscovite, tourmaline (Na,K,Ca)(Mg,Li,Mn,Al,Fe2+)3 (Al,Cr,Fe,V)6(BO3)3Si6O18(OH,F)4, garnet (possibly a member of the almandine-spessaritine garnet series with the general formula Fe,Mn,AlSiO4), and a glassy blackish mineral with a conchoidal fracture that resembles euxenite in samples A and B. Microscopic examination of sample C showed the presence of tantalite (possibly ferrotantalite as suggested by quantitative chemical analysis results), quartz, muscovite, and garnet. The final classification of the minerals using the above-mentioned techniques as well as ICP-OES and XRF results (Tables IV and VI) showed that the tantalite mineral samples studied contain more tantalum than niobium, in which case the mineral is called tantalite instead of columbite2. The results of all the tests done in this part of the investigation are summarized in Table VI.
Chemical composition determination by ICP-OES
The chemical composition of the samples was determined, after sample dissolution, by ICP-OES. A qualitative study on sample C composition indicated the presence of Mn, Fe, Nb, Ta, Ca, Y, Th, U, Ti, and Si. samples A and B contained Mn, Fe, Ca, Ta, Nb, W, Th, U, Ti, Al, Sn, and Si (see Tables III and IV).
Quantitative analysis
Dissolution method
The visual appearance of solid in the reaction vessels after 150 minutes of microwave radiation in concentrated H2SO4 indicated the partial success of this dissolution method for all the mineral samples that were investigated. In the absence of certified reference materials for the samples, two of the samples (A and B) were sent to another laboratory (Alfred H. Knight laboratory) for inter-laboratory comparison using ICP-OES and WD-XTD. The ICP-OES results indicated a significant difference in major element recoveries (compared with Knight's results, Table VI) for digestion times between 45 and 90 minutes (71.9 ± 0.6% Nb2O5 and 25.2 ± 0.3% Ta2O5 at 45 minutes compared to 90.3 ± 0.1% Nb2O5 and 86.9 ± 0.3% Ta2O5 at 90 minutes for sample A), but little or no difference between 90 and 150 minutes of irradiation (90.04 ± 0.06% Nb2O5 and 88.90 ± 0.04% Ta2O5 at 150 minutes). The quantitative results for 90 minutes digestion period in the microwave oven for the three mineral samples are presented in Table III. The results show a considerable amount of dissolution for most of the elements and good reproducibility in samples A and B, with relative standard deviation (RSD) values generally below 2.50% and 5.00% respectively except for Si. Slightly higher RSD values were, however, obtained for the sample C analyses. The deviations from the observed RSD values obtained for SiO2 can be attributed to the insolubility of SiO2 in H2SO4.
The quantitative results obtained for the fusion digestion indicated complete recovery when compared to the results from Knight (see Table VI), which was also evident from the clear solutions that were obtained after the removal of the excess boron. Results indicated Nb2O5 recovery of 98.5 ± 0.20% for sample A and 109.60 ± 0.08% for sample B, while the Ta2O5 recovery was 100.4 ± 0.3% and 100.60 ± 0.06% for samples A and B respectively. Analysis of the two other major components, Mn3O4 and Fe2O3, also indicated excellent recoveries of 100.60 ± 0.07% and 101.1 ± 0.2% respectively in sample A and 99.2 ± 0.1% and 101.70 ± 0.05% in sample B. Excellent recoveries were also obtained for the minor elements, with the results for the two radioactive elements U and Th indicating 96-99% and 84% recovery respectively. The successful quantification of the different samples (Table IV) using this flux fusion method depends strongly on the removal of the excess H3BO3, which is formed with the addition of H2SO4 during the dissolution of the melt, as was the case in the previous study18. The addition of methanol to the solution and the subsequent removal of the boron ester and the excess methanol prevent possible spectral interference from the large excess of boron or co-precipitation of some of the elements with the H3BO3.
The RSDs for all the elements in the three different samples were within acceptable limits, indicating good precision in the results.
Quantification method - ICP-OES vs XRF
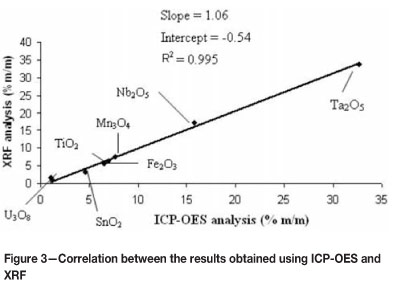
A comparison between the results obtained by ICP-OES and XRF indicates good correlation for the major elements for the different samples, with slopes of 1.08, 1.06, and 1.02 and intercepts of -0.12, -0.54, and 0.67 for samples A, B, and C respectively (Figure 3). Correlation coefficients between 0.966 and 0.995 indicate extremely good agreement between the quantitative results obtained with the two analytical methods. This indicates firstly that little or no loss of any of the major elements occurred during the flux digestion period (open vessel at 1100 °C), and secondly it demonstrates the successful dissolution of the tantalite mineral mixture with this method. The analytical results obtained for samples A and B also compared extremely well with those obtained from the inter-laboratory study (Knight laboratory), confirming the usefulness of the fusion dissolution method for the complete chemical characterization of mineral samples of this type (see Table VI).
The disagreement between the XRF and ICP-OES analyses for some minor analytes (such as SnO2 and ThO2) can be explained by the inhomogeneity of the mass per unit area, the particle size effects for XRF, and possible segregation between smaller and larger particles during mixing of the solids. The absence of quantiable results for some of the minor elements is due to the lack of calibration standards. Other factors such as the poor sensitivity of the WD-XRF instrument to certain elements allowed for only a semi-quantitative XRF analysis on some of the minor elements.
Comparison between different ores
It is clear from the mineralogical comparison that slight differences exist in the mineral composition of the three samples collected from the different locations in the Gilé District in the northern part of Mozambique (see Table V). The main tantalite-containing mineral was identified as manganotantalite for samples A and B and ferrotantalite for sample C (from chemical analysis). Other differences include little or no magnetism in samples A and B and substantial magnetism in sample C. Samples A and B also exhibit higher radioactivity, while sample C showed very little radioactivity. The rest of the minerals are almost identical in the three samples. The chemical analysis also indicated the difference in the Ta/Nb ratios, which varied from a 1:1 ratio for sample A to a 2:1 and 3:1 for samples B and C respectively (see Tables III and IV). The chemical analysis also highlighted the chemical differences of the impurities, with samples A and B having substantial Mn3O4 contents (manganotantalite) of 8.91 ± 0.07% and 7.6 ± 0.1% respectively, and 3.13 ± 0.01% for sample C. The Fe2O3 content for samples A and B is approximately 8% and that for sample C almost 20%.
A comparison of the mineral mix in the Mozambique samples with those obtained in Nigeria and Egypt indicated not only very distinct differences in the type of minerals that contain Nb and Ta, but also the associated impurities. The main minerals in the Egyptian study5 appeared to be euxenite, samarsakite, fegusonite, and zircon while those from Nigeria6 included cassiterite, magnetite, ilmenite, and columbite, compared with the mangano/ferrotantalite, micolite, and euxenite in the current study. Relatively low Ta and Nb (7.9% and 10.6% respectively) contents were present in the euxenite that was investigated in Egypt, but large quantities of ThO2 and U3O8 (10% and 18.7% respectively). Other impurities included rare earth metals (14.2%) and TiO2 (17.5%). The minerals from Nigeria, on the other hand, had substantially higher Ta and Nb contents (ranging between 6-60% for Ta and 16-38% Nb) with extremely low ThO2 and U3O8 contents (0.01-0.34% and 0.17-0.94% respectively). Impurities associated with these minerals included Hf, Zr, Mn, and in some instances Pb, Rb, and Y. The mineral samples from the current study contained Mn, Fe, and Si as the most important impurities, with intermediate levels of radioactive elements. This appears to be a less complicated matrix for beneficiation purposes.
Conclusion
The successful physical and chemical characterization of the three different samples from the Gile District in Mozambique in this study clearly indicated the presence of different minerals with different physical properties (radioactivity and ferromagnetism) and different elemental compositions. The major differences between the samples are the absence of euxenite, quartz, and, tourmaline from sample C, as well as the classification of samples A and B as manganotantalite and sample C as ferrotantalite. A mineral and chemical comparison of these ore samples with those in the central and northern parts of Africa clearly showed significantly different quantities and ratios of tantalum and niobium, as well as of major impurities.
The results of chemical analyses obtained in this study clearly indicated that alternative digestion or dissolution procedures for tantalite are possible, but further studies need to be carried out on other tantalite samples in order to test the general applicability of these methods. Both digestion methods yielded major element recoveries of the order of 90% and higher. The advantages of the microwave digestion method are the simplicity of the method and the small quantities of chemicals needed for the digestion, although the lower recovery of the major elements is a major drawback. Advantages of the flux fusion method are the shorter digestion time and the higher recoveries. The major drawback of this method is the larger quantities of chemicals needed for digestion, as well as the more time-consuming sample preparation steps before analysis.
A comparison of the XRF and ICP-OES results also demonstrated that no substantial loss of analytes occurred during the flux digestion process, underlining its possible use as an alternative dissolution method for this type of sample. This study also clearly illustrates the correlation between the physical properties (radioactivity, magnetism) and the chemical analyses (presence of U, Th, and Fe) in the mineral samples, illustrating the importance of these both techniques in the study of similar samples.
Acknowledgements
The authors thank the Research Fund of the University of the Free State, the National Research Foundation (NRF) of South
Africa, Necsa, and the New Metals Development Network of the Advanced Metals Initiative of the Department of Science and Technology of South Africa for financial support. The authors also thank Professor C. Gauert and Ms H. Joubert for their assistance with the XRF and XRD experiments respectively.
References
1. HAYES, K. and BURGE, R. Coltan mining in the Democratic Republic of Congo: how tantalum-using industries can commit to the reconstruction of the DRC. Fauna & Flora International, Cambridge, UK, 2003. [ Links ]
2. SCOTT, P.W., PASCOE, R.D., and HART, F.W. Columbite-tantalite, rutile and other accessory minerals from the St Austell topaz granite, Cornwall. Geoscience, South-west England, vol. 9, 1998. pp. 165-170. [ Links ]
3. REPUBLIC OF MOZAMBIQUE. Review of the economic and social plan of 2004. [updated 7 June 2005]. http://siteresources.worldbank.org/INTPRS1/Resources/Mozambique_APR2-PRSP(June7-2005).pdf [Accessed 9 Sep. 2010] [ Links ].
4. EBERLE, D., DAUDI, E.X., MUIUANE, E.A., NYABEZE, P., and PONTAVIDA, A.M. Integrating airborne geophysical data from the Alto Ligonha pegmatite fields - Northern Mozambique - through crisp clustering to predict areas with increased mineral potential. Adding new value to Electromagnetic, Gravity and Magnetic Methods for Exploration. EGM 2010 International Workshop, Capri, Italy, 11-14 April 2010. [ Links ]
5. EL-HUSSAINI, O.M. and MAHDY, M.A. Sulfuric acid leaching of Kab Amiri niobium-tantalum bearing minerals, Central Eastern Desert, Egypt. Hydrometallurgy, vol. 64, 2002. pp. 219-229. [ Links ]
6. ADETUNJI, A.R., SIYANBOLA, W.O., FUNTUA, I.I., OLUSUNLE, S.O.O, AFONJA, A.A., and ADEWOYE, O.O. Assessment of beneficiation routes of tantalite ores from key locations in Nigeria. Journal of Minerals and Materials Characterization and Engineering, vol. 4, no. 2, 2005. pp. 67-73. [ Links ]
7. CHANG, Q., SHIBATA, T., SHINOTSUKA, K., YOSHIKAWA, M., and TATSUMI, Y. Determination of high field strength elements in geological samples by ICP-MS after alkali fusion and mixed acid digestion. Frontier Research on Earth Evolution, vol. 1, 2003. pp. 357-362. [ Links ]
8. CONTE, R.A., MERMET, J.M., RODRIGUES, J.D. A., and MARTINO, J.L. Analysis of tantalum products by inductively coupled plasma atomic emission spectrometry. Journal of Analytical Atomic Spectrometry, vol. 12, 1997. pp. 1215-1220. [ Links ]
9. GREBNEVA, O.N., KUBRAKOVA, I.V., KUDINOVA, T. F., and KUZ’MIN, N.M. Direct determination of trace elements in niobium, tantalum and their oxides by inductively coupled plasma atomic emission spectrometry after microwave dissolution, Spectrochimica Acta, PartB, vol. 52, 1997. pp. 1151-1159. [ Links ]
10. ROY, P., BALARAM, V., BHATTACHARAYA, A., NASIPURI, P., and SATYANARAYANAN, M. Estimation of Ti, Zr, Nb, Hf, Ta, Th and U in beach placers and ferrodiorites by inductively coupled plasma mass spectroscopy using lithium metaborate fusion digestion technique. Current Science, vol. 93, 2007. pp. 1122-1125. [ Links ]
11. HALL, G.E.M., PELCHAT, J.C., and LOOP, J. Determination of zirconium, niobium, hafnium and tantalum at low levels in geological materials by inductively coupled plasma mass spectrometry. Journal of Analytical Atomic Spectrometry, vol. 5, 1990. pp. 339-349. [ Links ]
12. ZHOU, H., YI, D., ZHANG, Y., and ZHENG, S. The dissolution behavior of Nb2O5, Ta2O5 and their mixture in highly concentrated KOH solution, Hydrometallurgy, vol. 80, 2005. pp. 126-131. [ Links ]
13. COMMERCE RESOURCES CORP. Metals for today's technology. http://s3.amazonaws.com/ppt-download/tantalumandniobium-101116000007-phpapp01.pdf [Accessed 20 Jan. 2011] [ Links ].
14. DAMPARE, S.B., NYARKO, B.J.B., OSAE, S., AKAHO, E.H.K., ASIEDU, D.K., SERFOR-ARMAH, Y., and NUDE, P. Simultaneous determination of tantalum, niobium, thorium and uranium in placer columbite.tantalite deposits from the Akim Oda District of Ghana by epithermal instrumental neutron activation analysis. Journal of Radioanalytical and Nuclear Chemistry, vol. 265, no. 1, 2005. pp. 53-59. [ Links ]
15. GAUR, R.P.S. and MENDENHALL, R.G. Tantalum concentrates dissolution and purification method. US patent US 7182925 B2. 27 Feb. 2007. [ Links ]
16. URIA, J.E.S., ORTIZ, C.G., GARCIA, A.M., and SANZ-MEDEL, A. Determination of niobium and tantalum in some ores and special alloys by inductively coupled plasma atomic emission spectrometry. Mikrochimica Acta [Wien]. vol. 2, 1987. pp. 195-202. [ Links ]
17. LI, S., HU, B., and JIANG, Z. Direct determination of trace impurities in niobium pentaoxide solid powder with slurry sampling fluorination assisted electrothermal vaporization inductively coupled plasma mass spectrometry. Journal of Anayttical Atomic Spectrometry, vol. 19, 2004. pp. 387 - 391. [ Links ]
18. HUANG, D. and KRIVAN, V. Direct solid sampling electrothermal atomic absorption spectrometry for the analysis of high-purity niobium pentoxide. Fresenius Journal of Anayttical, Chemistery, vol. 368, 2000. pp. 227-234. [ Links ]
19. NETE, M., PURCELL, W., SNYDERS, E., and NEL, J.T. Alternative dissolution methods for analysis of niobium containing samples. South African Journal of Chemistry, vol. 63, 2010. pp. 130-134. [ Links ]
20. NETE, M. Dissolution and analytical characterization of tantalite ore, niobium metal and other niobium compounds MSc thesis, university of the Free State, Bloemfontein, 2009. [ Links ]
21. DASH, K., THANGAVEL, S., DHAVILE, S.M., RAO, S.V., CHAURASIA, S.C., and RUNACHALAM, J. Vapor phase matrix extraction of high purity di-boron trioxide and trace analysis using electrothermal AAS. Analytical Chimica Acta, vol. 546, 2005. pp. 229-235. [ Links ]
22. BABA, A.A., ADEKOLA, F.A., DELE-IGE, O I., and BALE, R.B. Investigation of dissolution kinetics of a Nigerian tantalite ore in nitric acid. Journal of Minerals and Materials Characterization and Engineering, vol. 7, no. 1, 2007. pp. 83-95. [ Links ]
23. TOMASIC, N., BERMANEC, V., GAJOVIC, A., and LINARIC, M.R. Metamict minerals: an insight into a relic crystal structure using XRD, Raman Spectroscopy, SAED and HRTEM. Croatica Chemica Acta, vol. 81, no. 2, 2008. pp. 391-400. [ Links ]
24. DOBBINS, M., DOMENICO, J., and DUNN, P. A discussion of magnetic separation techniques for concentrating ilmenite and chromite ores. Proceedings of the 6th International Heavy Minerals Conference 'Back to Basics', Southern African Institute of Mining and Metallurgy, Johannesburg, 2007. pp. 197-204. [ Links ]
© The Southern African Institute of Mining and Metallurgy, 2012. ISSN2225-6253. Paper received Apr. 2012; revised paper received Oct. 2012.

