


Services on Demand
Article
 English (pdf)
 Article in xml format
 Article references
Indicators

Related links
-
 Cited by Google
 -
 Similars in Google
Share

 Permalink
Journal of the Southern African Institute of Mining and Metallurgy
On-line version ISSN 2411-9717
Print version ISSN 2225-6253
J. S. Afr. Inst. Min. Metall. vol.112 n.12 Johannesburg Jan. 2012
Sustainable issues related to heap leaching operations
J.F. Lupo
Geotechnical Engineering, Newmont Mining Corporation
SYNOPSIS
One of the earliest records of metal recovery by solution leaching is described by Agricola as 'juice of rock' in the 1550s. In these early years of hydrometallurgy and civil engineering, few controls and systems were employed to enhance recovery and protect the environment. Since that time, leaching (dump or heap) operations have made significant strides in increasing metal and solution recovery while protecting the environment, all goals of a sustainable operation. It is now recognized that the design and operation of modern heap leach facilities requires contributions from many fields of study, including hydrometallurgy, civil engineering, geotechnical engineering, unsaturated-flow hydrology, mine planning, geosynthetics engineering, geochemistry, process engineering, mechanical engineering, and electrical engineering.
While advancements in these fields have resulted in more sustainable heap leach operations, challenges in the industry still exist. A number of heap leach operations exhibit poor or lower-than-predicted metal recovery, loss of solution flow and control within the ore heap, loss of ore heap stability under leach, failure of liner and/or solution recovery systems, and overtopping of process water ponds. A number of these issues may be the result of several compounding conditions. For example, poor metal recovery may be due to an inadequate scale-up assumption (scaling laboratory tests to field-size heaps), lack of control of the in-heap geochemical environment, changes in ore mineralogy from the original design, changes in mechanical and hydraulic properties of the ore from the original design, ore handling and pre-treatment, inadequate solution management system, and inadequate solution application.
The purpose of this paper is to present and discuss issues that may affect the sustainability of a heap leach operation. Since sustainability encompasses a broad range of topics and issues, the focus of this paper will be on issues affecting metal and solution recovery, solution flow and containment, and stability of the ore heap.
Keywords: heapleaching, sustainability, recovery, or characteristics.
Introduction
Heap leaching operations have evolved significantly over the centuries, ever since natural leaching was observed by Agricola and others in the 1550s. Modern heap leach facilities have become quite sophisticated and complex, and have to to deal with numerous metallurgical, geotechnical, and environmental challenges facing mines today. It is recognized that to develop and operate a modern sustainable heap leach facility requires contributions from many fields of study, including hydrometallurgy, civil engineering, geotechnical engineering, unsaturated-flow hydrology, mine planning, geosynthetics engineering, geochemistry, process engineering, mechanical engineering, and electrical engineering.
While modern heap leach operations are advanced compared to the early operations of the 1960s, the development of sustainable heap leach operations is still a challenge. Even the definition of heap leach sustainability can be challenging, as sustainability concepts encompass a broad range of topics and issues. For the purposes of this paper, sustainability is discussed as it relates to efficient and consistent recovery from the ore heaped on the leach pad. Discussions are presented focusing on ore properties (both mechanical and hydraulic) and behaviour that can influence recovery. Guidance is given, where applicable, to assist in broadening our understanding for developing more sustainable heap leach operations.
Ore mechanical properties
The importance of defining the mechanical properties of ore is not often appreciated until problems develop within the heap. It is often thought that only the hydraulic properties of ore are important for leach pad design performance. However, the definition of ore mechanical properties is critical to leach pad performance, and inadequate or improper testing can result in instability of the leach pad and/or poor recovery. Ore mechanical properties directly affect:
Stability of the ore heap. Instability of the ore (either static, seismic, or during extreme rainfall) can lead to loss of the facility, failure of the liner system, and loss of environmental containment
Laboratory testing of ore materials is required to assess the mechanical behaviour of the ore under the anticipated loading conditions within the leach pad. Prior to development of a testing programme, it is important to recognize the conditions that may exist within the leaching environment, and tailor the testing programme to replicate these conditions. For example, in leaching with acid (such as for copper and some uranium ores), the high acidity may change or degrade the character of ore during the leaching process. Ore degradation may result in instability of the ore heap, increased internal solution inventory, decreased metal recovery, and/or lengthened leaching time. Therefore, if an acidic leaching environment is anticipated, ore materials should be tested after exposure to acidic solutions (such as leach residues from column or crib testing). Note that degradation of ore may also occur even with less aggressive leaching solutions.
The recommended approach in developing a geotechnical testing programme for ore materials is to consider the properties of the ore as it is placed in the heap (e.g. agglomeration, pre-treatment, etc.) and after leaching. The mechanical properties of the as-placed ore will influence the method of ore placement (truck haulage versus conveyor stacking), the type of leach pad (dedicated, valley fill, on/off, hybrid), and initial leaching rates. The properties of the leached ore will affect the ore stacking configuration for stability, long-term leach solution application rates and recovery in stacked ore, and solution management during operations and closure. From a recovery standpoint, the mechanical properties of the leached ore will also affect in-heap inventory and methods of recovering the inventory.
At a minimum, the following laboratory tests are recommended to assess the mechanical and physical properties of ore:
A discussion of the importance of these tests is provided in the following sections.
Particle size, Atterberg limits, specific gravity
Particle size distribution, Atterberg limits, and specific gravity (SG) are commonly used to characterize the ore materials in terms of geotechnical analogues. For example, an ore with high fines content and plasticity (derived from Atterberg limits) would be expected to have similar attributes to a clayey soil; while a coarse grained ore with little fines would be expected to behave in a similar fashion to a gravel or coarse sand. For run-of-mine (ROM) material, large-scale particle size can be obtained using methods such as ASTM D5519 or using large-scale field tests. While these tests do not provide numerical values that are used directly in the design of leach pads, the information they provide is useful for correlating the observed behaviour of the ore from the other tests.
SG measurements are important in calculating the density of the ore, and are used in the design of ore stacking plans.
Modified one-dimensional compression
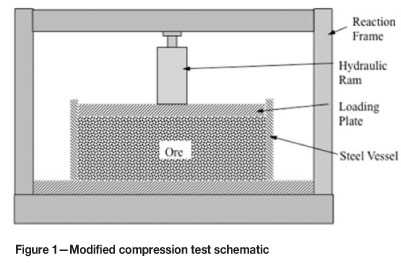
Modified one-dimensional compression tests are used to assess ore compression behaviour under load. The tests are conducted by placing the ore (fresh or leached) into rigid-wall test vessel (see Figure 1). A load is applied to the ore through a steel platen and hydraulic jack. Often a modified rigid-wall permeameter is used so that saturated hydraulic conductivity may be measured as a function of compression (see discussion later). Once the ore is placed in the vessel and loaded, the change in the height of the ore sample is measured with a micrometer, dial gauge, or other instrumentation with each increment of load. The measured compression of the ore can then be used to calculate the increase in ore density and decrease in ore porosity as a function of the applied load. The applied load can be converted to equivalent ore height using the calculated ore density.
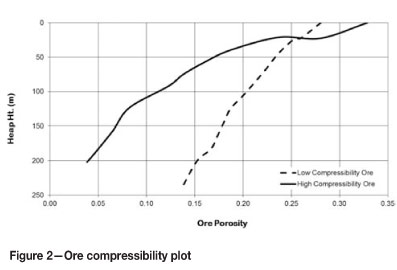
Some typical compression curves from actual ore tests are illustrated in Figure 2, which shows that ore materials can undergo significant compression and volume reduction with increasing height of ore on the leach pad (e.g. the lower ore lifts are compressed by the self-weight of the upper ore lifts). The decrease in volume (loss of open pore space) can affect stability, solution flow, and recovery from the leach pad. As shown in Figure 2, the low-compressibility ore lost approximately 50 per cent of its original porosity under an equivalent ore height of approximately 240 m. The high-compressibility ore lost approximately 90 per cent of its original porosity under an equivalent ore height of approximately 200 m. Changes in porosity will influence the solution flow behaviour (flow paths and rate) within the ore heap, thereby affecting the sustainability of the heap.
Triaxial compression/direct shear tests
An integral part of leach pad design and operation is defining the shear strength of the ore within the heap. The ore shear strength directly affects the heap stacking plan, in terms of the allowable ore stack height and overall ore slope. In addition, the ore shear strength also influences the leach pad geometry and foundation grading. Lack of ore shear strength testing raises the risk of potential ore heap failure and loss of the heap leach facility.
In general terms, a weak (e.g. low shear strength) ore will be stacked at a lower overall slope angle, and at lower ore stack heights. In addition, the leach pad configuration may need to be modified to support or buttress stacked weak ore. A strong (e.g. high shear strength) ore can be stacked at steeper slopes and at higher heap heights.
Ore materials are often tested under triaxial compression and/or direct shear tests to evaluate the shear strength under the anticipated loading and leaching conditions. The decision on whether to use triaxial compression or direct shear, or both types of testing is generally based on the ore characteristics (fresh and leached) and the anticipated loading conditions (static and seismic loads, ore loading rates, and ore placement method). In many cases, more than one ore type may be present, in which case each type should be tested. Where both weak and strong ore types are present, the shear strength data may be used to determine the location for ore placement and stacking within the heap.
Triaxial compression tests are commonly used to evaluate the shear strength of rock and soil materials. There are several types of triaxial compression tests that may be conducted, depending on the type of loading and drainage conditions that may occur within the ore heap. The general types include:
CU tests are conducted whereby the ore is first saturated then consolidated (under drained conditions) to an effective mean stress that is equivalent to desired ore depth. Once the ore has been consolidated under the effective mean stress, the sample is then sheared under undrained conditions. CD tests are typically conducted on ore samples that have been prepared at or near the leaching moisture content of the ore. The sample is consolidated to an effective mean stress that is equivalent to desired ore depth, and then sheared under fully drained conditions. It is important to run CD tests at a strain rate that is slow enough to prevent development of excess pore pressures within the sample. Finally, UU tests may be conducted on either saturated ore or an ore sample at or near the leaching moisture content. For UU tests, the sample is confined to an effective mean stress that is equivalent to the desired ore depth, and sheared under undrained conditions.
CU tests are the most common test used for ore shear strength testing. At first, testing the ore under CU conditions may not seem compatible with the concept of leaching under unsaturated conditions; however, in the lower portions of the heap (particularly next to the liner) the ore can become saturated. It is these lower portions of the heap that can have a significant impact on the overall stability of the ore heap. In addition, if excess pore pressures are measured, CU tests can provide both effective and total stress parameters, which allow stability of the ore heap to be assessed under different drainage conditions. CD tests may also be used for coarse, well-drained ore materials that are not anticipated to generate excess pore pressures under load. UU tests may be used to assess the shear strength of fine-grained ore with very poor drainage properties that is to be loaded rapidly (e.g. loading under haul truck traffic). Direct shear tests can also be used for leach pad design. These tests should be conducted on saturated or nearly saturated ore with shearing at a strain rate that will not generate excess pore pressures (generally between 0.0025 and 1 mm/min).
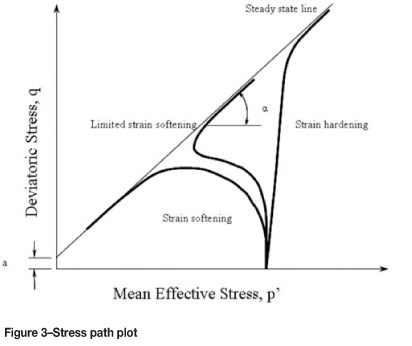
The results from triaxial compression and/or direct shear tests can be plotted in various formats. One useful format is to plot the data in stress path space, by plotting the mean and deviatoric stresses [mean effective stress [p'] = (S1' + S3') / 2 and deviatoric stress [q] = (S1' - S3') / 2].
Plotting the data in stress path space allows the designer to observe the behaviour of ore under shear. If the ore exhibits dilatant behaviour, the ore may gain shear strength under strain (e.g. strain hardening), which is beneficial to heap stability. The opposite of dilatant ore is strain softening (contractive) ore, which rapidly loses shear strength under strain. Under certain conditions, a contractive ore can lead to abrupt failure of the ore heap in a leach pad. A general stress path plot of strain hardening and strain softening ore is presented in Figure 3.
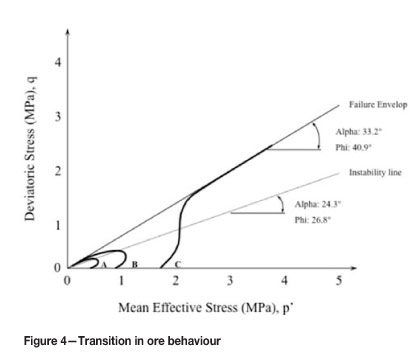
The results from triaxial compression tests can be used to assess if the ore will behave in a contractive or dilatant sense. Depending on the type of behaviour under shear, changes in the heap leach pad and/or stacking plan can be made to accommodate this behaviour. It is important to note that the behaviour of the ore under strain can change, depending on the stress level. Figure 4 presents a graph showing ore behaving as a contractive material at low stresses, while transitioning to a dilatant material at higher stresses. These types of transitions in behaviour are important to identify in the design stage, before the ore is stacked and leached.
Ore hydraulic properties
The hydraulic properties of ore are key in the design and operation of any leach pad. While most leaching operations occur under unsaturated conditions (e.g. the solution application rate is less than the saturated hydraulic conductivity of the ore), it is important to test ore materials under both unsaturated and saturated conditions.
Saturated hydraulic conductivity tests
Saturated hydraulic conductivity tests (often referred as permeability tests) are one of the most common methods to measure the hydraulic characteristics of the ore under fully saturated conditions. While, as stated above, ore materials are most commonly leached under unsaturated conditions, the saturated ore hydraulic conductivity provides two useful measures:
- The saturated hydraulic conductivity of the ore represents the maximum solution application rate for the ore. If the solution application rate exceeds the saturated ore hydraulic conductivity, solution will pool at the surface, affecting the leaching environment. In addition, pooled solution on the heap could give rise to unstable conditions. Therefore, the solution application rate should be maintained well below the conditions that could saturate the ore
- By measuring the saturated hydraulic conductivity of the ore under varying loads, the heap leach pad designer can assess whether the ore heap is likely to become saturated under future conditions, as more ore is stacked higher onto the leach pad or as the ore degrades. The author has observed a number of leach pad failures (e.g. poor recovery, instability, high internal inventory) directly related to loss of permeability in the lower ore lifts. At the time of design, these leach pads did not consider any loss of ore permeability with load, thereby making the facilities unsustainable.
Saturated hydraulic conductivity tests under load can be conducted using either flexible or rigid wall permeameters, using methods presented in ASTM D5080, ASTM D2434, AS 1289.6.7.1, AS 1289.6.7.2, and AS 1289.6.7.3. Flexible wall permeameters are used on fine-grained ore materials, while rigid wall permeameters are typically used for coarse-grained ore materials.
Figure 5 presents the results from actual saturated hydraulic conductivity tests conducted two different ore types under load. The tests shown in Figure 5 are for a strong, durable ore (e.g. siliceous ore) and weak, compressible ore material (e.g. friable siltstone). As expected, the saturated hydraulic conductivity of the ore decreases with increased ore load (i.e. ore height). The decrease in hydraulic conductivity is less than an order of magnitude for the durable ore, while the compressible ore exhibits a loss of almost three orders of magnitude, reflecting a significant change in the ore hydraulic properties.
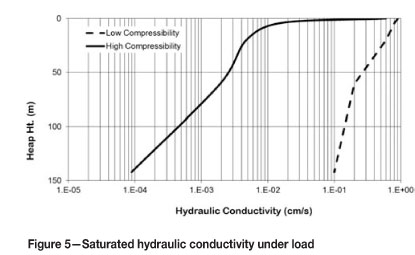
Figure 6 presents saturated hydraulic conductivity test data for leached, agglomerated copper ore. In this figure, the data is presented in terms of equivalent solution application rate, in litres per hour per square metre (L/h/m2). By plotting the data in this form, it is possible to estimate the maximum ore height under which the ore will become saturated under leaching conditions. For example, the design solution application rate for this leach pad is 7.8 L/h/m2. Under this application rate, ore types 1 and 2 are anticipated to become saturated under an ore height of 5 to 8 m, while ore types 3 and 4 will not become saturated until an ore height of 40 to 45 m is achieved.
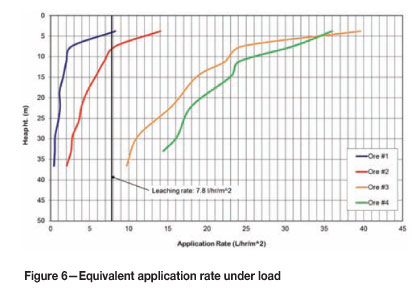
Presenting the data in this format provides a useful tool for the heap leach pad operator. The data presented in Figure 6 suggests that if ore is to be stacked higher than 8 m on the leach pad, then the following leach pad design options are available:
- Delay stacking ore types 1 and 2 on the leach pad until the last 8 m at the top of the heap
- Blend all the ore together, resulting in a composite ore that can be stacked higher than 8 m. The ore blend would have to be tested to determine the blend ratio
- Design the leach pad to accommodate low ore stacking for ore types 1 and 2, and high ore stacking for ore types 3 and 4
- Consider using an interlift liner for ore types 1 and 2. The benefits and costs of an interlift liner would need to be carefully evaluated before selecting this option.
Another consideration with regard to the hydraulic properties of ore is the potential for loss of permeability over time due to degradation. This often occurs with acid-leached ores and in some agglomerated ores. An example of changes in hydraulic properties with ore degradation is illustrated in Figure 7. In this figure, the results from saturated hydraulic conductivity tests are presented for fresh ore and ore that has been leached for one year (acid leaching).
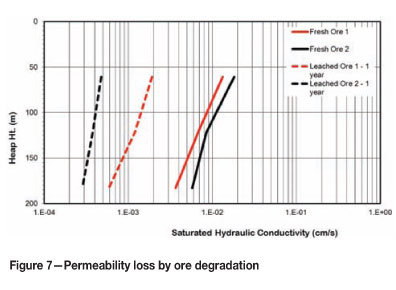
As shown in Figure 7, the saturated hydraulic conductivity of the ore decreases by more than an order of magnitude as a result of ore degradation in one year. Similar tests have shown that ore degradation may continue for several years, as long as there is leach solution present. This graph illustrates the importance of considering ore degradation upfront in leach pad design and operation. If the ore exhibits degradation characteristics, the hydraulic performance and design of the leach pad should not be based on tests conducted on fresh ore.
Load-percolation tests
Load-percolation tests are an alternative method for assessing the hydraulic characteristics of ore under load. However the focus of the test is to determine what conditions are required to maintain unsaturated ore percolation (applied load and/or applied solution rate). These types of tests are non-standard, but relatively easy to conduct.
Load-percolation tests are typically conducted using a modified rigid-wall permeameter, as shown in Figure 8. The tests are conducted by placing an ore sample within a rigidwall test vessel, between porous plates and perforated load/bearing plates. Leach solution is introduced at the top of the ore sample at the design application rate and the effluent is collected at the bottom of the vessel. During the test, it is important to measure both inflow and effluent to determine when steady-state conditions have been reached. Also, plugging or fouling of the porous plates is a common occurrence in these tests, resulting in erroneous data.
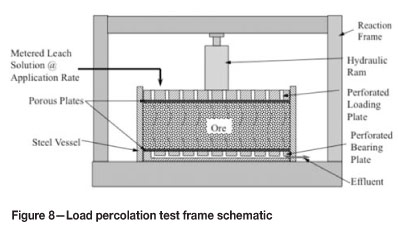
As the leach solution is applied, the load on the ore sample is increased incrementally to the desired maximum load. During loading, the ore compression is measured based on the change in height of the sample. This data is used to calculate bulk density and porosity of the ore sample during leaching. The volume difference between the applied solution and effluent can be used to estimate ore moisture content under leach and moisture up-take prior to leaching. These moisture content values are important as they are used directly in solution management (water balance) calculations.
If, during loading, the applied solution pools on top of the ore sample (above the perforated loading plate), this would be an indication that the ore sample has become saturated and further percolation is occurring under saturated conditions. The load at which the ore becomes saturated can be converted to an equivalent ore height and used to guide the design of maximum ore height for the heap leach pad.
For both the saturated hydraulic conductivity and load percolation tests, it is recommended to use actual leach solution, rather than water. Depending on the mineralogy of the ore, the hydraulic response may vary considerably with the leach solution chemistry.
Soil-water characteristic curve (SWCC)
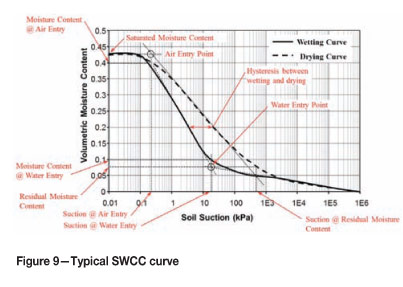
In recent years, some projects have conducted tests to define the soil-water characteristic curve (SWCC) for ore materials. A SWCC relates the soil (ore) moisture content with the soil (ore) suction pressure, and defines the moisture holding potential of a soil. Unsaturated hydraulic conductivities may also be measured; however, these tests require a significant amount of time to complete. More often, analytical equations are used to provide an interrelationship between moisture content, suction pressure, and hydraulic conductivity. A SWCC is an important tool that may be used to evaluate percolation and airflow studies within ore heaps. Ore moisture content influences the way both solution and air flow through ore. As ore moisture content increases, more solution is able to flow through the ore, but the airflow decreases (more pore space is occupied by solution than by air), therefore if the leaching kinetics rely on the presence of oxygen, high ore moisture contents may inhibit the flow of air (and oxygen) to the ore.
An example of a typical SWCC is presented in Figure 9, showing the relationship between moisture content and suction (negative pressure). Key concepts to understanding an SWCC are:
For most problems, the SWCC and hydraulic relationships may be estimated using grain size curves. Examples of SWCC relationships for fine-grained soils are presented in Fredlund et al. (2002) and Leong and Rahardjo (1997a, 1997b). Mace et al. (1998) present SWCC parameters for coarse-grained soils and gravels (-10 mm maximum particle size). To the author's knowledge, there are no measured SWCC curves for ROM ore heaps or waste rock. However, field tests have been used to estimate flow paths and percolation rates.
Examples of the hydraulic relationships derived from actual SWCC tests are presented in Figures 10 and 11. These graphs show the hydraulic relationships between a sand (coarse and fine), waste rock (fine-gravel size with fines), and silt.
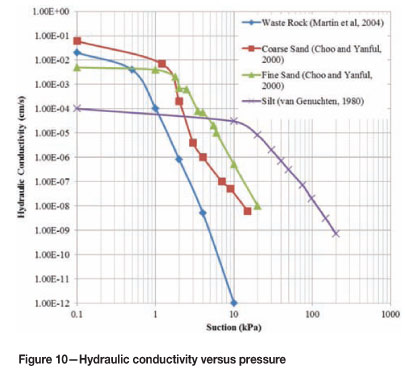
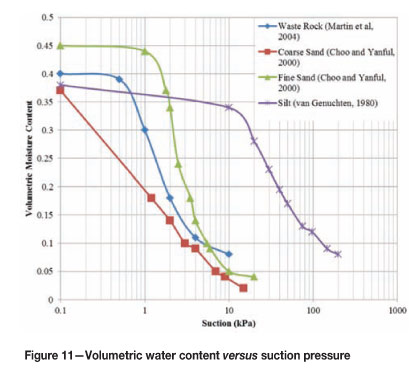
There are several key insights that can be gained from inspection of Figures 10 and 11, which can be extrapolated to general heap leach performance:
- The lower the fines content, the higher the saturated hydraulic conductivity (value at zero suction pressure). This is expected, as cleaner (low fines) materials allow fluid to flow quicker through the open pore spaces. However, as the soil becomes unsaturated, the soil with fines tends to 'hold' onto moisture longer (e.g. needs high suction). This is precisely the reason coarse, clean sands or gravels are used as capillary breaks in cover systems, as they tend to dry out quicker and retain less moisture. In terms of ore leaching, if a coarse, clean ore lift is left to dry (e.g. a long rest time between leaching cycles), the ore lift may actually interfere with or retard leaching once the leaching cycle has resumed
- While materials with few fines have higher hydraulic conductivities, the change in conductivity with change in saturation is greater. Therefore, the presence of some fines is beneficial to retaining moisture content in the ore heap. What this means is that a clean ore heap (one that contains few fines) may, from a hydraulic performance standpoint, require higher solution application rates to maintain proper moisture content than an ore with some fines
- A material with high fines content, while maintaining a higher moisture content, will have a lower hydraulic conductivity profile
- For the most part, solution application rates are generally in the range of 10-4 cm/s. For the examples shown in Figure 10, the waste rock (an analogue for crushed ore) would likely have a leaching volumetric moisture content of about 30 per cent (about 13 per cent gravimetric moisture). However, when the ore is placed in the heap, the moisture content will likely be far below that, usually in the high single digits. From Figure 10, it is easy to see that when solution is applied (at 10-4 cm/s), solution will pool and move laterally because the ore must first 'wet-up' in order to achieve a hydraulic conductivity that is compatible with the application rate
- Within an actual ore heap, the particle size is highly variable due to natural segregation (when dumping) and the variability of ore coming from the process plant and mine face. Therefore, within the heap, the SWCC relationships will vary widely, similar to the silt/crushed ore/sand curves shown in Figures 10 and 11. From these variable curves, it is easy to see how the hydraulic properties can vary significantly with minor changes in grain size and moisture content. These variabilities give rise to preferential flow paths, which are commonly seen in many heap leach pads. The impact of preferential flow paths on heaps is very difficult to quantify. Some numerical studies, such as those conducted by Orr (2002) and Orr and Vesselinov (2002), give some order-of-magnitude indication of the impact of preferential flow paths in ore heaps.
On a final note, very little work has been conducted on the changes in the SWCC and unsaturated flow characteristics of soils under varying influences, such as applied stress (ore height) and degradation. Zhou and Yu (2005) found that applied stress can have a profound influence of the SWCC and unsaturated flow characteristics, with an increase in stress (burial) leading to higher levels of saturation and varying SWCC curves. Given the changes observed in the saturated hydraulic conductivity from degradation, it is reasonable to assume that ore degradation would also have a significant impact on the SWCC curves.
Many advanced heap leach projects rely on instrumented pilot heaps to gather information on the unsaturated flow characteristics within the heaps. The instrumentation often includes moisture content, suction/pressure, temperature, and in-heap solution sampling. For the most part, data from these test heaps is confidential. However, some notable recent publications are presented in Velarde (2006) and Kelly et al. (2008). It is expected that number of instrumented pilot heaps will increase, as they provide useful information not only on the hydraulic behavior of the ore heap, but also on leaching kinetics and scale-up, subjects considered in the next two sections.
Kinetics + solution flow = recovery
The two basic processes in recovery from ore heaps are leaching kinetics and solution flow. Leaching kinetics describes the rate at which metals or other constituents are released from the ore. There are numerous published papers presenting theories describing leaching kinetics. Bartlett (1997) provides a good summary on general leaching mechanisms. One of the most common theories describing leaching kinetics is the shrinking core model (Chae and Wadsworth, 1974). In its basic form, the shrinking core model describes the reaction along the surface of an ore particle, resulting in both aqueous and solid products that may form on the surface of the particle. As the reaction proceeds, the unreacted core of the particle is reduced in size, while more solids and aqueous products are formed (Crundwell, 1995). This basic model has been revised and modified into many forms to address different observations. A notable refinement to the shrinking core model is presented in Dixon and Hendrix (1993); however, it is important to note that a number of the parameters used in the model cannot be measured or verified. Dixon (2003) provides a good overview of the challenges in modelling leach kinetics.
While the shrinking core model (in one form or the other) is commonly used, there are many other models that have been proposed for different ore types and leaching conditions. The various leaching kinetic models will not be discussed in this paper as there are too many different models to discuss. Instead, the focus will be on how leaching kinetics are measured and testing considerations.
The most common method to assess leaching kinetics is through column testing of the ore, where ore is placed in a column, typically 0.15 m to 0.3 m diameter and from 1 m to 3 m long (although large-scale columns of up to 3 m diameter and 6 m long have been used), and leach solution is applied to the top of the column. During the test, a number of parameters (such as recovery, pH, conductivity, biomass, reduction-oxidation state, etc.) may be measured to assess leaching performance. Prior to preparing a column test programme, it is very important to develop a testing matrix to assess leaching under various conditions. The most common failure in defining the leaching kinetics of ore is an inadequate column testing programme. Considerations for column testing should include:
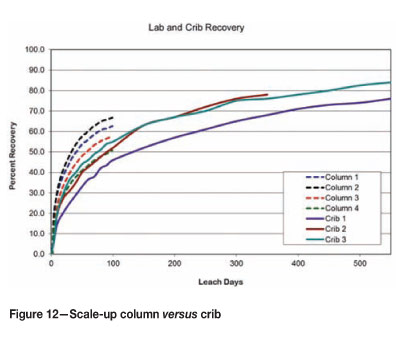
After column tests have been conducted, the issue of scale-up must be addressed or considered. Scale-up is the observed difference between the recoveries from columns and full-sized ore heaps, whereby actual recovery is lower in full-sized heaps than predicted from column tests. A useful discussion on scale-up effects is presented in McClelland (1986).
An illustration of the scale-up effect is shown in a comparison of leach column tests to crib tests shown in Figure 12. The recovery curves presented in Figure 12 show crib tests in general had 50 per cent less recovery than columns using the same ore and testing conditions. A number of studies and theories have been developed to address the scale-up effect, with varying success. Bouffard and West-Sells (2009) concluded in their study that column test work should be used only to learn about the metallurgical response, and that data from columns was not scaleable to heaps. They suggested that cribs or larger pilot test heaps should be used for heap design and recovery predictions. Schlitt (1997) developed a simple method to estimate metal recovery scaling based solely on particle size. However, this method has had limited success. Lampshire and Braun (2005) compared recovery from gold ore leaching in columns and full-size heaps at the Cortez Mine, and found only a 10 per cent discrepancy in recovery, which is the value used for scale-up effects. Trincado et al. (2003) compared full-sized heaps to column tests at the Mantos Verde Mine in Chile, and found a relatively small scale-up effect (on the order of 5 per cent). Leiva et al. (2010) demonstrated the effectiveness of mini cribs compared to column testing. As shown in these references and from the author's experience, the degree of scale-up varies significantly, with no single approach showing promise. What is evident is the utility of crib and pilot-scale testing of heaps to defining full-size heap performance. While these tests are more expensive and require more time to complete, the scale-up from crib or pilot-scale heaps to commercial heaps appears to be much smaller and increases the confidence of heap performance.
The second part of the recovery equation is solution flow. Without solution flow, recovery from the heap cannot occur. Issues affecting solution flow, such as ore permeability and compression, were discussed earlier in this paper; however, the impact of solution flow on recovery was not illustrated. The following is an example that combines leaching kinetics with solution flow issues to demonstrate the impact on recovery.
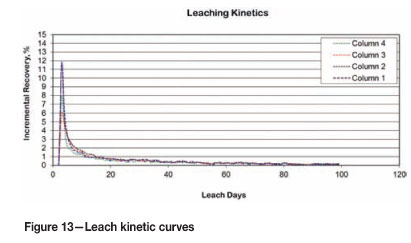
In this example, consider a gold leach heap with ore stacked in three 15 m ore lifts (for a total of 45 m). Figure 13 presents leaching kinetic curves for this example that were derived from actual column tests on a gold ore. These curves show the incremental metal recovery as a function of time. This information is the same as that in a total recovery curve, only shown incrementally. In this form, the kinetic curve shows a peak incremental recovery of between 6 and 12 per cent occurring a few days after leaching, with a long decay curve lasting 100 days.
In this example, three scenarios will be considered, as there are three primary ore types, each with a different hydraulic response under load:
In all scenarios, the ore is leached under a solution application rate of 12 L/h/m2. The leach cycle for each ore lift is 100 days, with a 30 day period between leaching each ore lift (to accommodate surface ripping, ore stacking, and surface preparation).
Figure 14 shows the leach solution flow for scenario 1 in litres per day at the base of the heap, on a per square meter basis. In this plot, as leaching begins on ore lift 1, the solution flow is first delayed by ore take-up (see the previous discussion on SWCC). Once the primary leach cycle of 100 days is completed, the ore heap exhibits draindown, as solution inventory leaves the heap while ore lift 2 is placed and prepared for leaching. The next two leach cycles are completed in a similar fashion, with solution flow monitored for a total of 500 days.
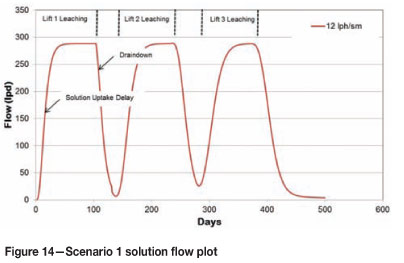
Figure 15 presents a similar plot, but for scenario 2, whereby the bottom ore lift begins to lose permeability after the placement of ore lift 3. It is important to remember that these plots represent the flow (per square metre) recovered from the base of the heap (beneath ore lift 1). As shown, the first two leach cycles are identical to those shown in Figure 14, as the ore has the same hydraulic properties. However, at the beginning of the leach cycle on the third ore lift, solution flow is greatly reduced. In this scenario, one would expect the in-heap solution inventory would increase substantially, since solution recovery (due to permeability loss) is being retarded.
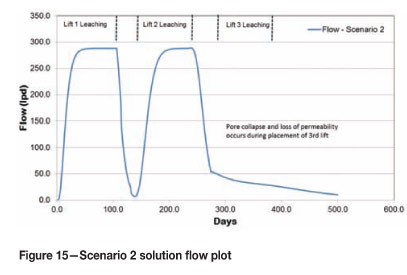
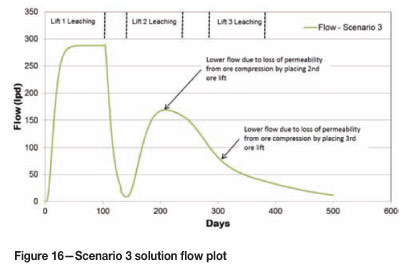
Figure 16 presents the solution flow plot for scenario 3, where the first ore lift begins to lose permeability during the placement of the second ore lift in the heap. The solution flow curve shows a reduction in flow during the leach cycles of both the second and third ore lifts.
The reductions in solution flow exhibited in Figures 15 and 16 are expected to have some impact on recovery from the heap. The predicted impact on recovery is shown in Figure 17 for each of the scenarios modelled.
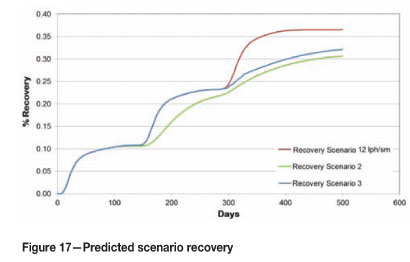
The results shown in Figure 17 indicate that there is an approximate 13 per cent decrease in recovery for scenario 2 and an 18 per cent reduction in recovery for scenario 3. The delay in recovery demonstrated in this example would likely require extended leaching to recover a portion of the in-heap inventory.
The example shown in Figures 14 through 17 demonstrates the relative influence of ore hydraulic performance on recovery within a heap. It is important to note that while this example focused on permeability loss, the leach kinetic rate curve also influences the overall impact to recovery. The results of this example would have been quite different with higher and lower kinetic rate curves.
Conclusion
The sustainability of heap leach operations is a multi-faceted issue, requiring input from many different disciplines. The purpose of this paper was to highlight just a few of the issues related to ore characteristics (both mechanical and hydraulic) that are often overlooked, but that can affect the sustainability of operations. It is hoped the discussions presented in this paper demonstrate the importance of understanding ore behaviour in developing a sustainable practice.
The ultimate goal in heap leach sustainability is to have a facility that can operate and recover the constituents for which it was designed in an efficient manner. To reach this goal, ore testing, hydrometallurgy, and leach pad design must continue to advance, considering the lessons learned from both successful and failed operations.
References
ASTM C136. Standard Test Method for Sieve Analysis of Fine and Coarse Aggregates. ASTM International, West Conshohocken, PA, 2003. [ Links ]
ASTM D422. Standard Test Method for Particle-Size Analysis of Soil. ASTM International, West Conshohocken, PA, 2003. [ Links ]
ASTM D854. Standard Test Methods for Specific Gravity of Soil Solids by Water Pycnometer. ASTM International, West Conshohocken, PA, 2003. [ Links ]
ASTM D1140. Standard Test Methods for Amount of Material in Soils Finer than No. 200 (75-|m) Sieve. ASTM International, West Conshohocken, PA, 2003. [ Links ]
ASTM D2434. Standard Test Method for Permeability of Granular Soils (Constant Head). ASTM International, West Conshohocken, PA, 2003. [ Links ]
ASTM D2850. Standard Test Method for Unconsolidated-Undrained Triaxial Compression Test on Cohesive Soils. ASTM International, West Conshohocken, PA, 2003. [ Links ]
ASTM D4767. Standard Test Method for Consolidated Undrained Triaxial Compression Test for Cohesive Soils. ASTM International, West Conshohocken, PA, 2003. [ Links ]
ASTM D5084. Standard Test Methods for Measurement of Hydraulic Conductivity of Saturated Porous Materials Using a Flexible Wall Permeameter. ASTM International, West Conshohocken, PA, 2003. [ Links ]
ASTM D5519. Standard Test Methods for Particle Size Analysis of Natural and Man-Made Riprap Materials. ASTM International, West Conshohocken, PA, 2003. [ Links ]
ASTM WK3821. 2011. New Test Method for Consolidated Drained Triaxial Compression Test for Soils (under development). ASTM International, West Conshohocken, PA, 2003. [ Links ]
STANDARDS AUSTRALIA 1141.11.1 Method 11.1: Particle size distribution- Sieving method. www.standards.org.au. [ Links ]
STANDARDS AUSTRALIA SA 1289.3.1.1-2009. Soil classification tests - Determination of the liquid limit of a soil - Four point Casagrande method. www.standards.org.au. [ Links ]
STANDARDS AUSTRALIA SA 1289.3.2.1-2009. Determination of the plastic limit of a soil - Standard method. www.standards.org.au. [ Links ]
STANDARDS AUSTRALIA SA 1289.3.3.1-2009. Calculation of the plasticity index of a soil. www.standards.org.au. [ Links ]
STANDARDS AUSTRALIA SA 1289.3.5.1:2006. Methods of testing soils for engineering purposes: method 3.5.1: soil classification tests: determination of the soil particle density of a soil: standard method. www.standards.org.au. [ Links ]
STANDARDS AUSTRALIA SA 1289.6.2.1-2001. Methods of testing soils for engineering purposes - Soil strength and consolidation tests -Determination of the shear strength of a soil. www.standards.org.au. [ Links ]
STANDARDS AUSTRALIA 1289.6.2.2-1998. Methods of testing soils for engineering purposes - Soil strength and consolidation tests -Determination of shear strength of a soil - Direct shear test using a shear box. www.standards.org.au. [ Links ]
STANDARDS AUSTRALIA SA 1289.6.4.1-1998. Methods of testing soils for engineering purposes - Soil strength and consolidation tests - Determination of compressive strength of a soil - Compressive strength of a specimen tested in undrained triaxial compression without measurement of pore water pressure. www.standards.org.au. [ Links ]
STANDARDS AUSTRALIA SA 1289.6.4.2-1998. Methods of testing soils for engineering purposes - Soil strength and consolidation tests - Determination of compressive strength of a soil - Compressive strength of a saturated specimen tested in undrained triaxial compression with measurement of pore pressure. www.standards.org.au. [ Links ]
STANDARDS AUSTRALIA SA 1289.6.7.2-2001. Methods of testing soils for engineering purposes - Soil strength and consolidation tests - Determination of permeability of a soil. www.standards.org.au. [ Links ]
STANDARDS AUSTRALIA SA 1289.6.7.1-2001. Methods of testing soils for engineering purposes - Soil strength and consolidation tests - Determination of permeability of a soil. www.standards.org.au. [ Links ]
STANDARDS AUSTRALIA SA 1289.6.7.3-1999. Methods of testing soils for engineering purposes - Soil strength and consolidation tests - Determination of permeability of a soil - Constant head method using a flexible wall permeameter. www.standards.org.au. [ Links ]
BARTLETT, R.W. 1997. Metal extraction from ores by heap leaching. AIME Metallurgical and Materials Transactions B, vol. 28B. pp. 529-545. [ Links ]
BOUFFARD, S.C. and WEST-SELLS, P.G. 2009. Hydrodynamic behavior of heap leach piles: influence of testing scale and material properties., Hydrometallury, vol. 98. pp. 136-142. [ Links ]
CHAE, D.G. and WADSWORTH, M.E. 1974. The leaching of dilute copper oxide ore phases. In Situ Recovery of Minerals, vol. 8. pp. 2-21. [ Links ]
CHOO, L-P. and YANFUL, E.K. 2000. Water flow through cover soils using modeling and experimental methods. Journal of Geotechnical and Geoenvironmental Engineering, vol. 126, no. 4. pp. 324-334. [ Links ]
CRUNDWELL, F.K. 1995, Progress in the mathematical modeling of leaching reactors. Hydrometallurgy, vol. 39. pp. 321-335. [ Links ]
DIXON, D.G. 2003. Heap leach modeling - The current state of the art. Hydrometallurgy2003, Santiago, Chile. [ Links ]
DIXON, D.G. and Hendrix, J.L. 1993. A general model for heap leaching of one or more solid reactants from porous ore pellets. Metallurgical Transactions B, vol. 24B. pp. 157-169. [ Links ]
FREDLUND, M. WILSON, W., and FREDLUND, D. 2002. Use of the grain-size distribution for estimation of the soil-water characteristic curve. Canadian Geotechnical Journal, vol. 39, no. 6. pp. 1103-1117. [ Links ]
KELLY, G. AHLBORN, G., GUNN, M., and HARVEY, P. 2008. Laboratory and demonstration scale optimization of the Quebrada Blanca heap leach bacterial regime using GeoLeachTM. HydroProcess2008, Santiago, Chile. [ Links ]
LAMPSHIRE, D. and BRAUN, T. 2005. Heap leaching operations and practices at Cortez Gold Mines. SME2005Annual Meeting, Salt Lake City, Utah. [ Links ]
LEIVA, J., ROCHA, M., CASTRO, S. MENACHO, J., TRONCOSO, F., ARENAS, A., and DERMERGASSO, C. 2010. Bioleach of sulphide ores in mini-cribs: option to improve the sulphide leach project in Minera Escondida. Hydro Process, 2010, Santiago, Chile. [ Links ]
LEONG, E. and Rahardjo, H. 1997a. Permeability functions for unsaturated soils. Journal of Geotechnical and Geoenvironmental Engineering, vol. 123, no. 12. pp. 1106-1117. [ Links ]
LEONG, E. and Rahardjo, H. 1997b. Review of soil-water characteristic curve equations. Journal of Geotechnical and Geoenvironmental Engineering, vol. 123, no. 12. pp. 1106-1117 [ Links ]
MACE, A., Rudolph, D., and Kachanoski, R. 1998. Suitability of parametric models to describe the hydraulic properties of an unsaturated coarse sand and gravel. Ground Water, vol. 36, no. 3. pp. 465-475. [ Links ]
MARTIN, V., AUBERTIN, M., BUSSIERE, B., and CHAPUIS, R. 2004. Evaluation of unsaturated flow in mine waste rock. 57th Canadian Geotechnical Conference, Quebec, Canada. [ Links ]
MCCLELLAND, G.E. 1986. Agglomerated and unagglomerated heap leaching behavior is compared in production heaps. Mining Engineering, July. pp. 500-503. [ Links ]
ORR, S. 2002. Enhanced heap leaching - Part 1: Insights. Mining Engineering, vol. 54, no. 9, pp. 49-56. [ Links ]
ORRE, S. and VESSELINOV, V. 2002. Enhanced heap leaching - Part 2: Applications. Mining Engineering, vol. 54, no. 10, pp. 33-38. [ Links ]
SCHLITT, W. 1997. Proposed method for estimating leach recovery from coarse ores. Minerals and Metallurgical Processing, August. pp. 50-53. [ Links ]
TRINCADO, L., TRONCOSO, U., VARGAS, C., BUNGER, C., and ZARATE, G. 2003. Process improvements at Mantoverde heap leach-SX-EW plant. Hydrometallurgy 2003, Santiago, Chile. [ Links ]
VAN GENUCHTEN, M.T. 1980. A closed form equation for predicting the hydrulic conductivity of unsaturated soils. Soil Science Society of America Journal, vol. 44. pp. 892-898. [ Links ]
VELARDE, G. 2006. History and development of aeration in the Cerro Verde Mine. SME Annual Meeting, St. Louis, MO. USA. [ Links ]
ZHOU, J. and YU, J-L. 2005. Influences affective the soil-water characteristic curve. Journal of Zhejiang University, vol. 6A, no. 8. pp. 797-804. [ Links ]
© The Southern African Institute of Mining and Metallurgy, 2012. ISSN2225-6253. This paper was first presented at the Percolation Leaching Conference, 8-9 November 2011, Misty Hills, Muldersdrift.

