


Servicios Personalizados
Articulo
 Inglés (pdf)
 Articulo en XML
 Referencias del artículo
Indicadores

Links relacionados
-
 Citado por Google
 -
 Similares en Google
Compartir

 Permalink
Journal of the Southern African Institute of Mining and Metallurgy
versión On-line ISSN 2411-9717
versión impresa ISSN 2225-6253
J. S. Afr. Inst. Min. Metall. vol.112 no.8 Johannesburg ene. 2012
TRANSACTION PAPER
Simulation of time-dependent crush pillar behaviour in tabular platinum mines
J.A.L. NapierI; D.F. MalanII
ICSIR, South Africa and Department of Mining Engineering, University of Pretoria, South Africa
IIGold Fields Ltd and Department of Mining Engineering, University of Pretoria, South Africa
SYNOPSIS
It has been established that significant time-dependent stope convergence may occur over time periods of hours and days in certain hard-rock gold and platinum mines. The source of this time-dependent behaviour appears to be associated with both preexisting discontinuities and with mining-induced fractures that form near the stope face. These induced fractures may be associated with blasting processes and may also be formed in response to high stress concentrations in the unmined regions immediately ahead of the stope face. In shallower platinum mining operations, time-dependent behaviour is, however, observed to be much less marked unless some form of specific mining-induced fracturing occurs. One particular case of considerable interest is the time-dependent behaviour that is found to be associated with the formation and deployment of crush pillars. The purpose of the paper is to present a simple limit-equilibrium computational model of this behaviour that is sensitive to both the formation sequence and the size of planned crush pillars in a mine layout. This model provides a useful means to optimize the sizing of crush pillars, and at the same time may be used to identify potentially hazardous circumstances in which pillars may not crush in a stable manner.
Keywords: crush pillars, pillar behaviour, pillar failure, simulation.
Introduction
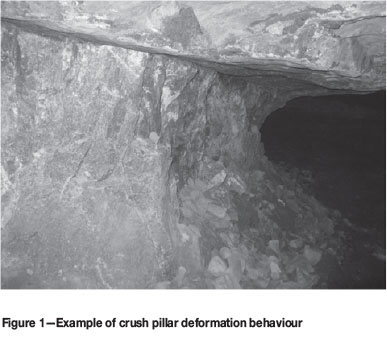
Crush pillars are deployed routinely in platinum mining operations to control hangingwall stability and to reduce the potential risk of large-scale collapse or so-called 'back breaks'. A number of research investigations to determine the strength characteristics of crush pillars have been reported, which provide some insight into the appropriate selection of crush pillar dimensionsi-4. Crush pillar layouts usually comprise a series of chain pillars arranged along the strike or dip direction, depending on the adopted stoping strategy. The design of crush pillar configurations should be viewed within the broader context of general hardrock pillar design methods, with appropriate recognition being made of the potential for foundation failure when the pillar width-to- height ratio exceeds a critical value4,5,6. It is apparent that the understanding of the individual behaviour of single pillars, such as the pillar shown in Figure 1, is by itself insufficient to design a general pillar layout configuration. The overall layout behaviour should be assessed as an interactive, time-evolving system where the mutual influence between pillars is appropriately modelled and where the possible failure of the individual pillar components is recognized. A tabular boundary-element solution procedure was introduced previously^ to perform these calculations using a simple limit-equilibrium model that can allow for the partial or complete failure of each pillar. A further assessment of this approach has been carried out recently by Du Plessis et al.9 who noted that an important extension to the model is to recognize the possibility of time-dependent strength decay processes that may induce sudden pillar failure some time after the initial formation of pillars at the stope face.
Basic properties of the limit-equilibrium model
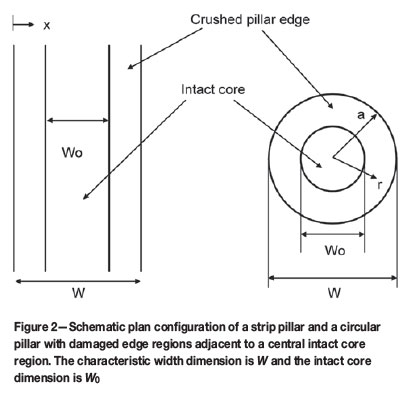
The simple model presented in this paper has been described previously» for a limit-equilibrium relationship between the reef-normal stress component σι at the hangingwall and footwall contacts and the average reef-parallel stress component σ3 of the damaged pillar material. This relationship is expressed as a function of the distance x to >the closest pillar edge as depicted in Figure 2. If the pillar height is H (perpendicular to the plane in Figure 2), the expression derived» for the reef-normal stress component is given by

where σι is the effective residual unconfined strength of the damaged rock and μ is the coefficient of friction at the interface between the damaged rock and the hangingwall or footwall contact. Coefficient m is the Mohr-Coulomb slope parameter in the limit-equilibrium failure relationship that is assumed to hold between σ1 (χ) and the average value of the reef-parallel stress component σ3(χ)Ά This limit-equilibrium failure condition is expressed as

Expressions similar to Equation [ι] have been suggested previously as a descriptive model for coal pillar behaviour by Barron10. More elaborate empirical failure relationships such as the Hoek-Brown failure criterion11may also be employed instead of Equation [2], leading to a somewhat more complex expression than given by Equation [ι]. It is of some interest to note that Equation [1] is in fact essentially similar to a relationship derived many years ago by Hill12 for the pressure distribution in a rectangular section of plastic material squeezed between two parallel plates. In this case, Equation [2] should be interpreted as a plastic yield criterion with m = 1 (see Hill12, chapter VIII, Equation [22]).
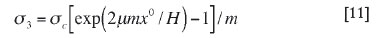
In order to gain some perspective on the effect of the pillar shape, it is possible also to apply the limit-equilibrium analysis to the case of a circular pillar with a radius a and height, H (see Figure 2). Using the failure criterion expressed by Equation [2] with x replaced by the radial position variable, r, a simple solution analogous to Equation [I] can be developed for the distribution of the normal stress component σι in this case (see Hill12, chapter X, equation [34]). The resulting expression for the stress component σ"Γ0 (r) at position r from the centre of a circular pillar of radius a is
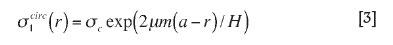
which is essentially equivalent to Equation [I].
In order to contrast the relationship for the strip pillar geometry to the circular pillar, let the characteristic dimension for both the strip pillar width and the circular pillar diameter be denoted by W and define the non-dimensional width-to-height parameter β by

Let σ be the average value of the residual stress component σι in the damaged edge region of the pillar (see Figure 2) where the limit- equilibrium relationship holds. For the case of the strip pillar, the average stress in the failed region extending to a distance χ0 from the pillar edge is given by
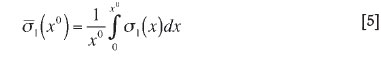
Substituting the expression for σ1 (x) given by Equation [1] into Equation [5] yields
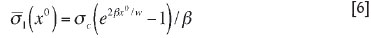
In the particular case where the damaged region extends over the entire pillar, χ0 = W/2. In this case, define the scaled residual average pillar stress, TR, to be
Similarly, by integrating Equation [3] over the circular pillar area, the residual average pillar stress in this case can be shown to be given by

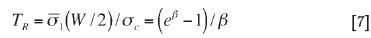
Equations [7] and [8] are plotted as functions of β in Figure 3. It is apparent, as might be expected, that the residual strength of the strip pillar always exceeds the residual strength of a circular pillar with diameter equal to the strip pillar width. From the structure of Equations [7] and [8], it may be shown that for large values of β,

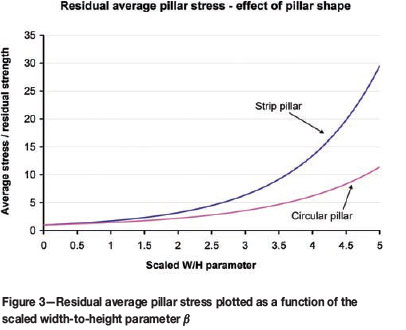
This asymptotic behaviour is illustrated in Figure 4, where the ratio TR/TRirc is plotted against β.
The exponential shape of the average pillar stress curves displayed in Figure 3 is interestingly very similar to the stability graph curve shapes reported by Martin and Maybee13 for the case of so-called 'Hoek-Brown brittle parameters'. As discussed by Martin and Maybee13 the shape of these curves provides a good discrimination between the failed and unfailed pillars of the database cases of failed and intact pillars that they examined. The shape of these residual strength curves is similar as well to the observations reported by Watson et alA prior to possible pillar foundation failure.
The pillar may in general have a central intact core region of width W0 < W (see Figure 2). It is assumed that within this core region, the values of the reef-normal stress component a0 fall below the appropriate intact strength envelope and that

where ac is the unconfined strength of the intact material and m0 is the corresponding Mohr-Coulomb slope parameter. In Equation [10], σ30 represents the average reef-parallel stress component in the core region of the pillar. At the critical boundary point x = x° between the failed edge material and the unfailed intact core region of a strip pillar, it is deduced from Equation [1] and Equation [2] that
The transition point x0 is dependent on the details of the pillar location within the layout, the reef modulus, and the primitive stress state at the mining horizon. In general, the transition point x0 and the detailed distribution of stress within the pillar core region has to be determined by a numerical procedure such as the TEXAN layout analysis computer program7,8. A useful upper bound for the scaled peak load in the intact core region of a strip pillar that is damaged symmetrically on each side can be established as follows. Let a? designate the average stress in the core region, W0 = W-2x , and let acTP designate the average stress across the whole pillar. Recalling from Equation [5], that σ1 is the average stress in the failed region, then from the balance of the forces acting normal to the plane of the pillar it follows that

Define the non-dimensional scaled edge failure fraction to be

and assume that in the core region, Equation [10] is satisfied as an equality and that

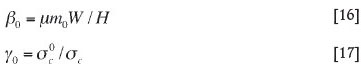
Substituting Equations [14], [13], [11], [7], and [6] into Equation [12], it may be shown that the non-dimensional upper bound stress TP for a strip pillar is given by

where the additional parameters and are defined by
It may be observed that when X = 1, the pillar is fully crushed and TP (1) = TR, the residual average pillar stress that is given by Equation [7]. It may be demonstrated that when the intact and residual strength parameters are the same (i.e. β = β0 and γ0 = 1), the maximum value of TP occurs when X= 1 and no load shedding occurs as the pillar becomes completely failed. The analogous expression to Equation [15] for the circular pillar can be shown to be given by
where the edge crush distance variable Xis now defined to be
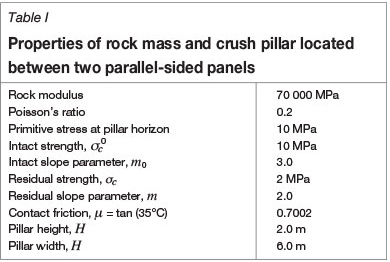
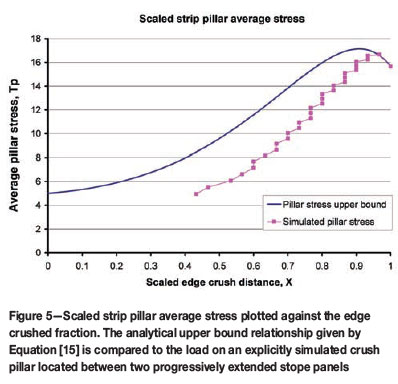
In order to illustrate the behaviour of Equation [15], consider the particular case where a strip pillar of width 6 m and height 2 m is located centrally between two parallel-sided panels that are progressively enlarged in a series of mining steps. The rock mass elastic parameters and the properties of the pillar material are given in Table I. In the numerical simulation, the pillar is covered with 60 elements and each of the adjacent stope panels is enlarged progressively in face advance increments of 1 m up to a span of 40 m. The pillar elements are tested for failure using the intact strength constraint provided by Equation [10]. If a failure state is reached at a collocation point within an element, the stress component a1 is adjusted to conform to the limit- equilibrium value given by Equation [1] with the value of x determined as the distance from the collocation point to the nearest edge of the pillar. This nearest edge distance is pre-computed for each crush type element collocation point and is assumed to apply as well in the case of square or rectangular pillars?.
Equation [15] is plotted as the continuous curve in Figure 5 as a function of the fraction X of the pillar that is crushed. This can be compared to the corresponding values obtained from the numerical simulation that are marked with squares. It is immediately obvious that the simulated pillar load values fall below the upper bound estimates, but tend towards the upper bound when X 1 and the pillar becomes fully crushed. The upper bound values, corresponding to Equation [15], arise from the assumption that the core pillar stress is uniform and equal to the limiting failure load, expressed by Equation [13], across the entire width of the pillar. In reality, the simulated intact core pillar load only reaches this limiting value adjacent to the maximum crushed edge position, x°, and falls below this value near the centre of the pillar. As the pillar edges become progressively more crushed, and the core region size diminishes, the central intact core average stress approaches the intact strength limiting value given by Equation [14], as can be seen by the convergence of the two curves in Figure 5 when X- 1.
Time-dependent crush pillar behaviour
It is apparent from extensive underground stope convergence observations!* that time-dependent deformations occur which are related to both geometrical changes to the excavation face positions as mining occurs and to strength decay processes that occur in the fractured rock mass or on geological structures such as parting planes. The creep-like movements in fractured rock or on pre-existing discontinuities can occur over relatively short time periods of hours, days, or weeksH It is clear that if the residual strength of the crushed material adjacent to the intact pillar core decreases with time, the effective confining support given to the intact material decreases and unstable pillar collapse may occur eventually. Alternatively, if the pillars are fully crushed, then a decay of the residual strength can result in progressively poorer regional support of chain pillars, with consequent increased risk of hangingwall collapse.
In order to represent the time decay of the pillar strength, it is assumed that the parameters ac and m of the limit-equilibrium relationship in Equation [2] are time-dependent functions. Specifically, it is postulated that if t represents the elapsed time from the initial exposure of an element of the pillar, then the residual strength and slope parameters are given by
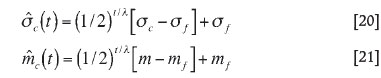
where λ represents a characteristic half-life of the strength parameters, and where af and mf represent the ultimate asymptotic values of the strength parameters as the elapsed time becomes very large. In the implementation of this time-dependent strength model in a numerical solution procedure, a specific time origin is assigned to each element that forms the crush zone and the elapsed time is measured with respect to each individual element time origin. The time origin can be set most conveniently as a function of the simulated mining step number. This will imply that a differential strength decay factor is applied to elements of the seam or reef material as mining proceeds. Further embellishments to this model are obviously possible; for example, it may be assumed that the decay function is different from Equations [20] and [21] or that the decay rate decreases with increasing distance from the exposed pillar edges. It is possible as well to apply a time-dependent strength decay factor to the intact core material, but these enhancements seem to be at present unwarranted without additional field measurements to support specific assumptions.
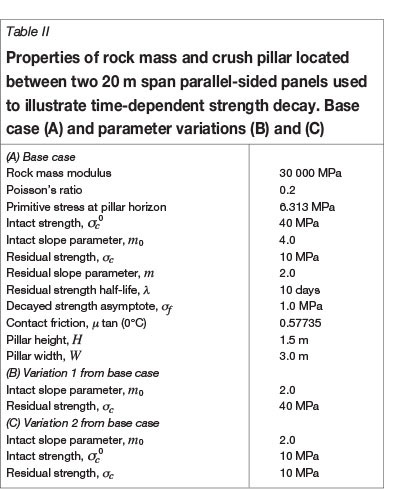
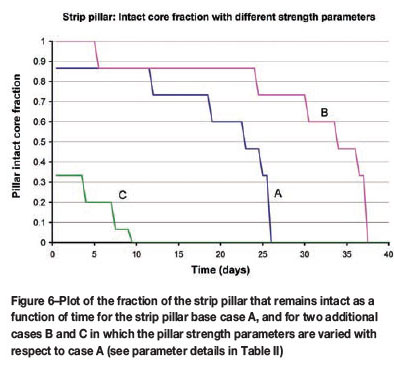
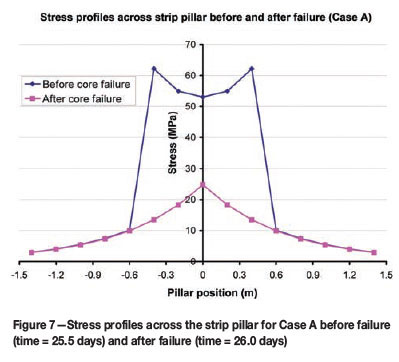
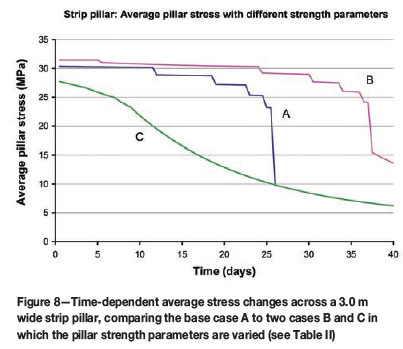
As an illustration of the behaviour of the time-dependent residual strength decay model, consider the case of a single strip pillar (or, effectively, a chain of crush pillars) of width 3 m and height 1.5 m that is located between two parallel-sided panels each having a span of 20 m. The detailed model properties and parameters are summarized for the base case A in Table II. The pillar is assumed to be initially intact at time t = 0 and the edge elements are allowed to lose strength as time advances, with a nominal half-life of 10 days. The intact core becomes progressively smaller and is eventually eliminated between an elapsed time of 25.5 days and 26.0 days, as indicated in Figure 6 by the plot of the intact core fraction for case A. The corresponding stress profiles across the pillar before and after the intact core failure at times 25.5 days and 26.0 days respectively are shown in Figure 7. The time-dependent average stress profile for case A is shown in Figure 8, and shows clearly the rapid decrease in average pillar stress that occurs after the failure of the intact core region at time 25.5 days.
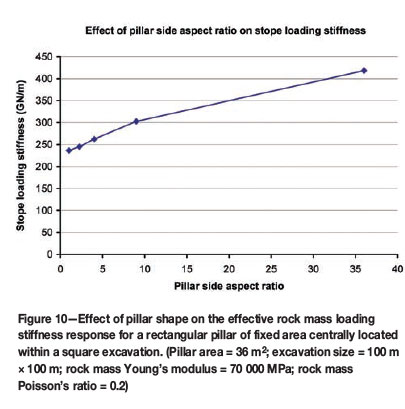
The average strain over the pillar region is computed from the displacement discontinuity values8 arising at each collocation point of the pillar elements, divided by the nominal pillar height, H. The time profile of the average pillar strain for case A is shown in Figure 9, and shows clearly the rapid acceleration in the average pillar strain at the time when the intact core is eliminated. The subsequent strain changes arise from the ongoing decay of the limit-equilibrium residual strength parameters, which lead to continuously decreasing values of the average residual stress across the pillar. The ultimate strain in the pillar will depend on the local rock mass loading stiffness response which, in turn, depends on the details of the excavation layout configuration surrounding the pillar and on the pillar shape. For example, in a tabular layout, the rock mass loading stiffness on a rectangular pillar will be higher than on a square pillar having the same area. Figure 10 illustrates the effect of the length-to-width aspect ratio of an isolated rectangular pillar on the rock mass loading stiffness, and shows that, for a given pillar area, the stiffness increases as the aspect ratio of the pillar is increased. The results shown in Figure 10 are derived for the particular case of a single pillar that has a fixed area of 36 m2 and is centrally located within a 100 m by 100 m square tabular excavation. This illustrates a potential additional benefit of a chain pillar configuration of crush pillars over isolated square pillars.
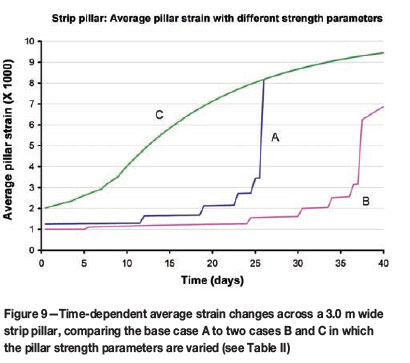
It is of interest to consider the effect of varying some of the basic parameters values used in case A of Table II on the time-dependent pillar response. In case B, the intact material slope parameter mo is set equal to the residual strength slope value such that m0 = m = 2 and the residual strength, ac, is increased to 40 MPa. It can be seen in Figure 6 that the time at which the intact core is eliminated is increased to approximately 37.5 days. The corresponding time-dependent behaviour of the average pillar stress and the average pillar strain for case B are shown in Figures 8 and 9 respectively. In case C, the intact slope is again set to m0 = 2, but the intact strength and the initial residual strength values are both reduced to a° = ac MPa. It is apparent from Figure 6 that the intact core is rapidly eliminated after approximately 9.5 days, and that no abrupt changes occur subsequently in the average pillar stress and the average pillar strain evolution as a function of time (see Figure 8 and Figure 9). These simple examples indicate that the model presented here is capable of replicating a wide variety of pillar response behaviours, but that a major challenge exists in assigning appropriate parameter values for the intact and residual rock strength and the time-dependent decay parameter, λ.
Simulation of a tabular crush pillar layout with pillar strength decay
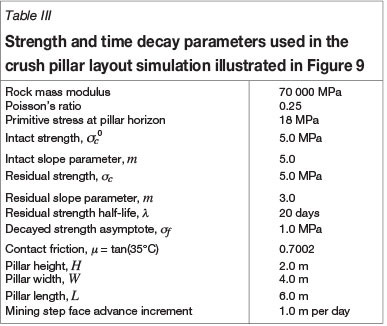
The behaviour of the crush pillar time-dependent model developed here was evaluated using the same layout configuration that was analysed previously by Du Plessis et al.9. The layout is depicted in Figure 11, where seven crush pillars labelled A, B, C, D, E, F, and G are exposed on one side adjacent to an initially mined region and are then incrementally exposed in a series of mining steps in the indicated mining direction. The size of each crush pillar is 4 m χ 6 m. The pillar strength parameters were chosen to be the same as those used by Du Plessis et al.9 and are detailed in Table III. It is important to note that in the present example, the mining step advance rate was chosen to be equal to 1 m per day and that the simulation was performed over a nominal time period of 70 'days' with 70 mining steps. This face advance step size is smaller than the mining step size of 10 m used by Du Plessis et al.9 and the results of the two simulations are therefore not directly comparable. In the present case, the layout elements were chosen to be 1 m χ 1 m square elements compared to the finer element size of 0.5 m χ 0.5 m used by Du Plessis et al.9. The detailed values of the pillar strength parameters and the pillar dimensions are summarized in Table III.
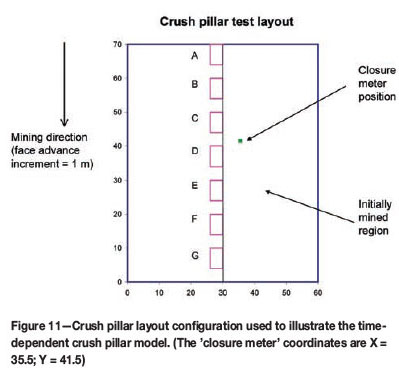
Simulations were performed initially with no time-dependent strength decay of the pillar material and then repeated with a strength decay half-life of the pillar material equal to 20 time units and 10 time units respectively. In Table III, the time unit is nominally labelled a 'day'. An important feature of the simulation of time-dependent residual strength decay is the ability to be able to adjust the strength decay initiation time as a function of the mining step number. In the present example, it is assumed that all elements comprising the edge of the crush pillar line that is adjacent to the initially mined region (see Figure 11) are assigned a decay time origin of zero. The time origins of the remaining incrementally-exposed rows of pillar and abutment elements are set equal to the elapsed time of each successive mining step as this step is executed. Consequently, during the final mining step (step 70), the upper row of elements comprising pillar A (other than the element that is adjacent to the initially mined region) will have been subjected to an elapsed decay time of 70 'days'. The pillar material comprising the lower row of pillar G will correspondingly have been subjected to a decay time of only 5 'days' (see Figure 11) at the final mining step number 70.
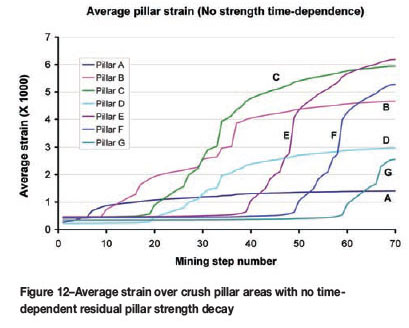
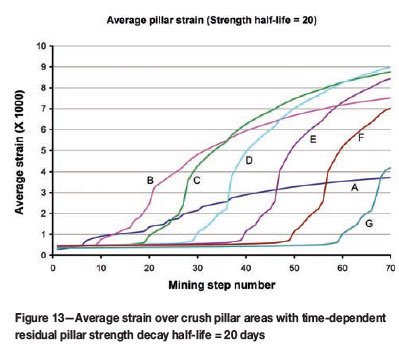
The average strain, computed over the area of each pillar, is shown in Figure 12 as a function of the mining step number for the initial base case where no time-dependent strength decay of the crush pillar material is allowed. The average strain values are shown in Figure 13 for the case where the time-dependent residual pillar strength decay has a half-life parameter, λ = 20 'days'. It is apparent that in this case there is a significant change to the average pillar strain response as a function of the mining step number for pillars B, C, and D, which are seen to undergo much larger strain increments than for the base case shown in Figure 12.
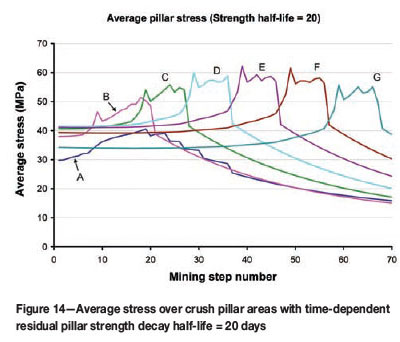
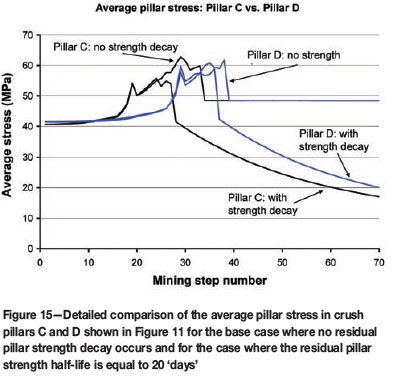
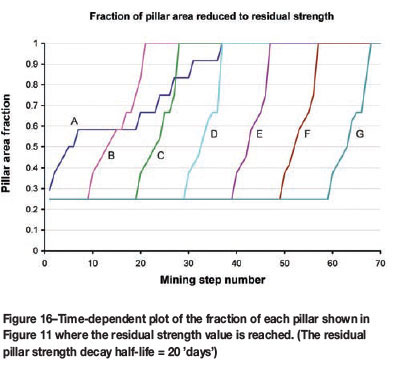
The average stress profiles computed over the areas of each crush pillar location are plotted in Figure 14. It can be seen that significant load-shedding occurs ultimately on all the pillars, except pillar A. The detailed average pillar stress profiles for pillars C and D are plotted in Figure 15 for both the base case where no residual strength time decay occurs and for the case where the residual strength half-life is equal to 20 'days'. It is interesting to note that for pillar D, the extent of load-shedding from the peak load to the residual load appears to be greater when the residual strength decay parameter is included. Figure 16 is a plot of the fraction of each pillar that is reduced to the limit equilibrium residual strength as a function of the mining step number. Figure 16 shows that this fraction increases steadily for pillar A over about 35 mining steps, but increases much more rapidly for each of the remaining pillars B through G as the mining front sweeps past each pillar. It may also be noted that the initial fraction of the pillar area that has crushed to the residual limit equilibrium strength is in all cases equal to 0.25. This arises since the long edge of each pillar that is adjacent to the initially mined region is crushed to the residual stress in the initial mining step. (The number of elements along the 6 m long edge of each pillar is equal to 6. Consequently, the initial crushed pillar fraction is equal to 6/24 = 0.25, where the total number of elements in each pillar is 24.)
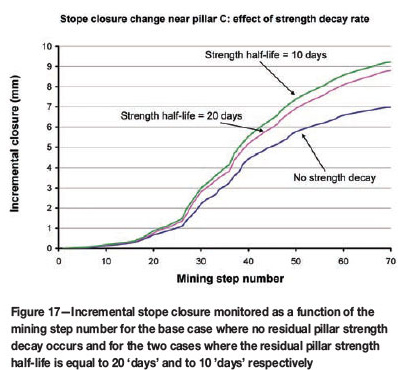
Finally, Figure 17 is a plot of the incremental stope closure changes at a specific layout position (coordinates X = 35.5; Y = 41.5 in Figure 11) designated to be a 'stope closure meter' located near pillars C and D as shown in Figure 11. The closure values plotted in Figure 17 show many qualitative similarities to the characteristic features of monitored field measurements!4. It must be emphasised that in this particular example the continually changing face positions dominate the underlying shape of the simulated response curves shown in Figure 17. The closure values corresponding to the inclusion of time-dependent residual strength decay are plotted in Figure 17 for the cases where the half-life strength parameter is equal to 20 'days' and 10 'days'. The closure values are, as would be expected, larger than the base case where there is no strength decay and appear to be somewhat 'smoother' than the base case.
Conclusions
It has been demonstrated that a simple limit-equilibrium model, introduced previously for tabular layout analysis of crush pillar behaviour, can be extended to include time-dependent strength decay of the residual strength parameters. This extended model is capable of simulating the deferred pillar collapse of an initially intact pillar, and may also be used to simulate complex stoping configurations where damaged pillars are formed at the stope face and are subsequently incrementally loaded as mining proceeds. This allows the interactive simulation of different pillar sizes, pillar spacing, and mining step advance rate. The model appears to be capable of replicating the qualitative features of observed underground incremental time-dependent closure values that have been observed. At the same time, it is clear that additional field measurements and further analysis of existing field data are required to establish quantitative bounds for the proposed limit-equilibrium residual strength decay model. This model can provide a computational framework to optimize the sizing of crush pillars in tabular layouts, and also allows the simulation of potentially unstable pillar configurations as mining progresses.
References
1. Ozbay, M.U., Ryder, J.A., and Jager, A.J. The design of pillar systems as practiced in shallow hard-rock tabular mines in South Africa. Journal of the South African Institute of Mining and Metallurgy, vol. 95, 1995. pp. 7-18. [ Links ]
2. Watson, B.P., Roberts, M.K.C., Nkwana, M.M., Kuijpers, J.S., and van Aswegen, L. The stress-strain behaviour of in-stope pillars in the Bushveld platinum deposits in South Africa. Journal of the Southern African Institute of Mining and Metallurgy, vol. 107, 2007. pp. 187-194. [ Links ]
3. Watson, B.P., Mosomane, S.M., and Kuijpers, J.S. Investigations into the residual strength of a 2.5 m wide Bushveld Merensky Reef crush pillar. Journal of the Southern African Institute of Mining and Metallurgy, vol. 108, 2008. pp. 473-480. [ Links ]
4. Watson, B.P., Kuijpers, J.S., and Stacey, T.R. Design of Merensky reef crush pillars. Journal of the Southern African Institute of Mining and Metallurgy, vol. 110, 2010. pp. 581-591. [ Links ]
5. Madden, B.J. A re-assessment of coal-pillar design. Journal of the South African Institute of Mining and Metallurgy, vol. 91, 1991. pp. 27-37. [ Links ]
6. York, G. Numerical modelling of the yielding of a stabilizing pillar/ foundation system and a new design consideration for stabilizing pillar foundations. Journal of the South African Institute of Mining and Metallurgy, vol. 98, 1998. pp. 281-297. [ Links ]
7. Malan, D.F. and Napier, J.A.L. Practical application of the TEXAN code to solve pillar design problems in tabular excavations. SANIRE2006 SymposiumFacing the Challenges, Rustenburg, 2006. pp. 55-74, [ Links ]
8. Napier, J.A.L. and Malan, D.F. The computational analysis of shallow depth tabular mining problems. Journal of the Southern African Institute of Mining and Metallurgy, vol. 107, 2007. pp. 725-742. [ Links ]
9. Du Plessis, M., Malan, D.F., and Napier, J.A.L. Evaluation of a limit equilibrium model to simulate crush pillar behavior. Journal of the Southern African Institute of Mining and Metallurgy, vol. 111, 2011. pp. 875-885. [ Links ]
10. Barron, K. An analytical approach to the design of coal pillars. CIM Bulletin, vol. 77, no. 868, 1984. pp. 37-44. [ Links ]
11. Hoek, E. and Brown, E.T. Practical estimates of rock mass strength. International Journal of Rock Mechanics and Mining Sciences, vol. 34, 1997. pp. 1165-1186. [ Links ]
12. Hill, R. The Mathematical Theory of Plasticity. Oxford University Press, 1950. [ Links ]
13. Martin, C.D. and Maybee, W.G. The strength of hard rock pillars. International Journal of Rock Mechanics and Mining Sciences, vol. 37, 2000. pp. 1239-1246. [ Links ]
14. Malan, D.F., Napier, J A L., and Janse van Rensburg, A.L. Stope deformation measurements as a diagnostic measure of rock behaviour: a decade of research. Journal of the Southern African Institute of Mining and Metallurgy, vol. 107, 2007. pp. 743-765. [ Links ]
© The Southern African Institute of Mining and Metallurgy, 2012.ISSN2225-6253. This paper was first presented at the, Southern Hemisphere International Rock Mechanics Symposium (SHIRMS) 2012, 15-17 May 2012, Sun City, South Africa.

