


Services on Demand
Article
 English (pdf)
 Article in xml format
 Article references
Indicators

Related links
-
 Cited by Google
 -
 Similars in Google
Share

 Permalink
Journal of the Southern African Institute of Mining and Metallurgy
On-line version ISSN 2411-9717
Print version ISSN 2225-6253
J. S. Afr. Inst. Min. Metall. vol.112 n.7 Johannesburg Jul. 2012
JOURNAL PAPER
Remote sensing in management of mining land and proximate habitat
K. KoruyanI; A.H. DeliormanliI; Z. KaracaII; M. MomayezIII; H. LuIII; E. YalçinI
IDokuz Eylul University, Department of Mining Engineering, Turkey
IIÇanakkale Onsekiz Mart University, Department of Geological Engineering, Turkey
IIIUniversity of Arizona, Department of Mining and Geological Engineering, USA
SYNOPSIS
Although remote sensing technology has been available for many years, it has rarely been used for monitoring mining activity. Recent studies indicate that remote sensing is also a valuable tool for managing and planning certain aspects of the mining operation. In this paper, we examine areal expansion of marble quarries and the affected vegetation over a period of 10 years in the Mugla region in Turkey, using geographic information system (GIS) and remote sensing (RS) techniques. Images captured by ASTER Level 3A01 (3D Ortho Data Set), Landsat 5, and Landsat 7 satellites between 2001 and 2009 were used for the analysis. Changes in the natural vegetation as a function of the production level in the marble quarry were calculated using the normalized difference vegetation index. According to the study results, land cover and natural vegetation decreased by less than 3 per cent and 1 per cent respectively between 2001 and 2009, following an upsurge in mining activity in the region.
Keywords: GIS, remote sensing, normalized difference vegetation index, marble quarry
Introduction
The societal and environmental impacts of mining activity are the focus of greater interest today than ever before. Many emerging economies are in the process of developing environmental policies for the first time. These new policies will surely affect how mining operations are expected to perform: producing the raw material needed to drive the economy at the lowest possible cost becomes as important as implementing a responsible, efficient management plan to help develop neighboring communities and sustainable land use. To achieve this objective, the management plan must incorporate ways to mitigate environmental issues, including land cover change, waste rock and tailing disposal, dust and noise, water use and re-use, and pollution, that may affect communities and the natural habitat near mining operations. Remote sensing including aerial photography, photogrammetry, and satellite imagery can play an important role in environmental monitoring and reclamation of mining areas.
The main advantages of remote sensing are its ability to cover large areas, high temporal frequency, and lower cost compared to ground-based investigation and monitoring.
A number of recently published papers1-11 have demonstrated the usefulness of monitoring the environmental impact of mining using various remote sensing methods. Felinks et al.12 ascertained the exact location of each site in the study area by satellite imagery (Landsat TM), airborne imagery (CASI), and ground-based methods, notably habitat mapping and vegetation sampling. Environmental impacts and the decrease of natural vegetation caused by the open pit mining activities were identified from NOAA-AVHRR and Landsat satellite images. Latifovic et al.7 employed the normalized difference vegetation index to determine the decrease in natural vegetation. Research by Antwi et al.10 focused on detecting the effect of disturbance on habitat diversity and land cover change using GIS and remote sensing in post-mining areas. Mouflis et al.9 assessed the environmental impact of marble quarries on the landscape of the Greek island of Thasos by employing remote sensing, landscape metrics, and viewshed analysis.
This paper presents the results of a study that examined the areal expansion of both abandoned and in-service marble quarries, and the subsequent changes in vegetation in the Mugla region from 2001 to 2009. Mugla province in western Turkey has been an important marble production centre since ancient times. The area holds a large number of operations producing block marble, abandoned quarries, and active marble processing plants. The region is densely covered in vegetation, in particular pine trees.
Marble extraction in the Mugla region is conducted by open pit mining method. Marble is cut in blocks during the extraction process. The original vegetation is destroyed, and the overlaying soil is removed as overburden. As a result, marble extraction activities have a serious impact on the ecology and landmass re-use9 In this study, GIS and remote sensing techniques were used to determine the environmental impacts of the quarries. We employed standard image-processing techniques in conjunction with a temporal decision tree and GIS maps of mine permits and wetlands to map active and reclaimed mines, and track changes through time. Mine permit coordinates obtained from the General Directorate of Mining Affairs (MIGEM) identified the location of the quarries, while ASTER and Landsat satellite images acquired between 2001 and 2009 provided the data source for this project.
Material and methods
In order to determine the environmental impact of marble production, quarries were located in the Mugla region. This was accomplished using a combination of the coordinates found in the MIGEM mine permits and the Landsat and ASTER images. Next, the landscape metrics of quarries were estimated. Finally, the environmental impact, and in particular, changes in the vegetation cover were quantified. The analysis steps are shown in the flow chart in Figure 1 and are explained in more detail.

Image data
Satellite images taken in the summer of 2001 to 2009 were used to determine the vegetation cover. ASTER and Landsat images have 15 m and 30 m resolution respectively. The images from ASTER VNIR were downsampled to 30 m resolution in order to use a consistent set of data. Satellites and image dates are given Table I.

Study area
Figure 2 shows the general study area in red and a number of smaller land patches consisting of the marble quarries. A satellite image mosaic for this region was created, and the data was enhanced by applying geometric and radiometric corrections. The main study area is delineated by extending the boundaries of the marble quarries in all directions, providing a buffer zone of 800 m around each quarry. The size of the buffer zone allows for all activities supporting marble block extraction, such as transportation and storage, to be represented in the images. The quarries in the general study area are in Landsat boundaries. However, unlike Landsat images, ASTER images do not correspond to a standard area image. Therefore, ASTER images for the year of interest were produced by combining images for the years 2003 and 2005, using image mosaic methods.

Image processing
First, standard processing procedures were applied to each image used in the general study area. As the coordinates of objects were not the same in most images, geometric correction was performed using over 20 ground control points (GCP) on topographic maps with a scale of 1:25 000. Next, the contrast and details in the image were enhanced by stretching and similar colours were mapped to a single value using spatial filtering techniques.
Determining the expansion of marble quarries
The boundaries of marble quarries for each year were determined using image processing and GIS. Marble quarries cannot be observed clearly in images at 30 m resolution. Therefore, standard image processing techniques were applied to make the boundaries better defined. In the first step, statistical filters were applied to the raw data as shown in Figure 3a. Sharpening filters were applied to bands 1, 2, and 3 of ASTER images and bands 2, 3, and 4 of Landsat images. The result is shown in Figure 3b. In the last step, the 'median' statistical filteri3 was found to provide the best quality image (Figure 3c). The same filtering techniques were used for RGB (red, green, blue) clustering and transforming images from raster to vector format.
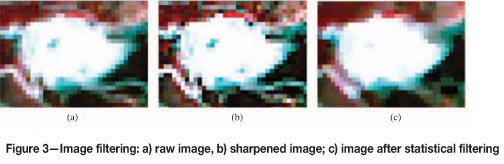
Following the application of sharpening and statistical filters to the ASTER and Landsat images, RGB clustering was performed to merge the three bands into one. The RGB clustering method performs a relatively simple unsupervised classification. Contrast stretching was also used in the clustering process. A linear contrast stretch was applied to uniformly expand the range of values in each image to cover the full range of values.
As seen in Figure 3, marble quarry outlines can be clearly improved using filtering and grouping techniques. These processing techniques also remove undesired and unnecessary pixels from the raster images. Images for years 2001-2009 after RGB clustering process were recoded and pixel classes were grouped in such a way as to separate marble and non-marble rocks. Recoding consists of assigning a new value to marble quarries (white) and a different value to all other rock types. A bi-colour image is produced to differentiate the stone units from the surrounding landmass (Figure 4).

Recoding from raster to vector data allows for polygoni-zation of the stone formations. Following this process, changes in vegetation and marble quarry boundaries can be determined. Vectorized data shown in Figure 5 includes few unwanted fragments due to artifacts generated by:
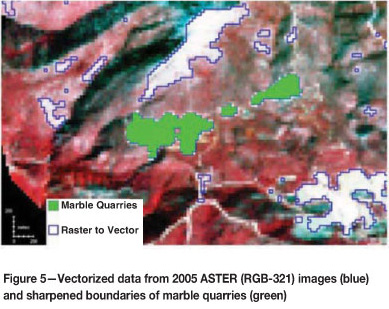
i) Areas in the satellite images having a reflection coefficient close to that of marble quarries
ii) Difficulty in separating separate pixels representing stone formations from neighboring pixels during the RGB clustering process.
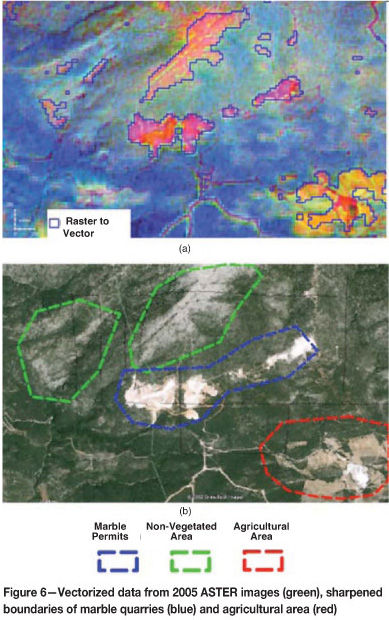
Band rationing techniques used by Sultan et al14 and Abdeen et al.15 are also used to discriminate and identify rock formations. Three pairs of ratio images (band ratios 4/7, 4/1, (2/3)x(4/3) for ASTER and 5/7, 5/2, (3/4) x (5/4) for Landsat) were co-registered and projected as composites. Lithological units, especially serpentinite, granite, and marble can easily be identified. In Figure 6, marble quarries are shown in pink.
Estimation of change in the natural vegetation
Vegetation Indices (VI) are computed using numerical brightness values, biomass and measuring the vegetation energy16. One vegetation index is calculated by adding, dividing and multiplying several spectral values. Vegetation indices assess whether the observed target contains live green vegetation or not17. Qinjiu and Xiang'un18 reported that close to 40 vegetation indices have been developed by researchers over the past 40 years. The most common vegetation indices (used by various investigators) are listed below:
Normalized difference vegetation index (NDVI) = (NIR-R) / (NIR+R) (Rouce et al. 19)
In this study, changes in the natural vegetation as a function of production rate were determined using the NDVI. Tucker23 reported that the NDVI changes between -1 .0 and +1.0 in general, and more specifically between +0.1 and +0.7. NDVI values were calculated using the (4-3) / (4+3) band ratio for Landsat images and the (3-2) / (3+2) band ratio for the ASTER images. The effect of marble quarries activities on vegetation from 2001 to 2009 is determined using NDVI images and vector data from quarry boundaries for each years. The subset method was used to calculate the yearly changes by converting the vector data into an area of interest layer (AOI). To determine the extent of vegetation loss, NDVI images from one year to the next were subtracted from the AOI images. Figure 7 shows the result of this transformation from 2001 to 2003.
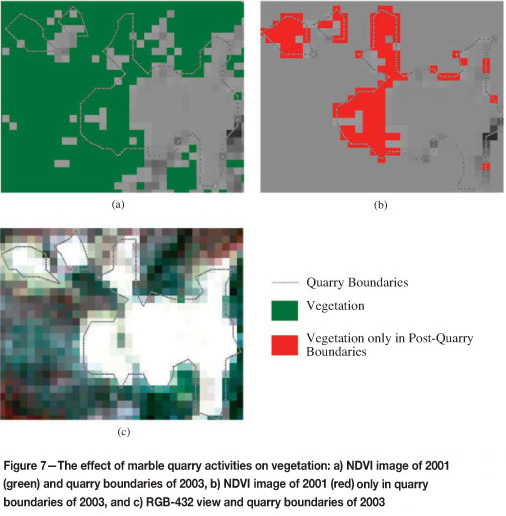
NDVI vegetation difference images similar to those in Figure 7 were created for the years 2001 through 2009. The pixel resolution is 30 m and the pixel area is 0.09 hectares.
Results and discussions
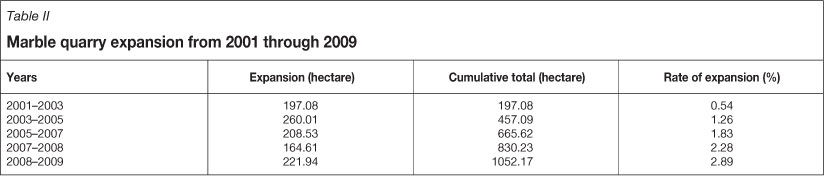
Table II presents the results from the analysis of the images to determine the extent of marble quarries expansion over an area totaling 36 390 hectares. The comparison of the land areas exploited between 2001 and 2009 reveals a five-fold increase in quarrying activity in the intervening eight years. The rate of increase grew from 0.54 per cent in 2001 to 2.89 per cent in 2009 over of the entire study area. The expansion is directly related to an increase in existing quarry activities. The boundaries of quarries are determined from vectorized data. The changes in the boundaries between years 2001 and 2009 are given as an example in Figure 8.

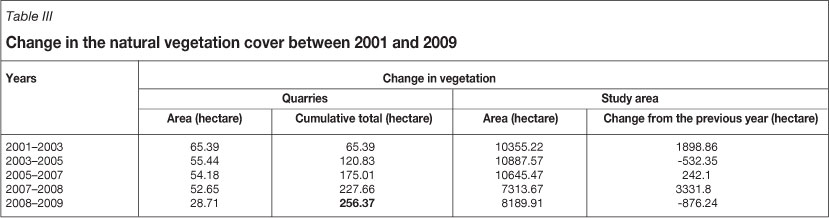
The associated natural vegetation cover reduction calculated using the NDVI is shown in Table III.
The measured vegetation cover in the study area is 12 254.08 ha. The change in the cumulative vegetation is related to the expansion of marble quarries between 2001 and 2009 and is estimated to be 256 ha or 2.09 per cent. The vegetation decrease in the study area is 4064.17 ha or 33.17 per cent. The loss of vegetation from marble quarries constitutes 6.30 per cent of the total decline in the study area. The region is covered with large pine forests. Many forest fires occur in this region every year, especially during the summer months, and these fires account for 86 per cent of the total vegetation loss. Although several reforestation efforts are currently underway in the burned areas (shown in the last column as negative value in Table III), the loss of vegetation has increased dramatically.
Another important point is that the observed upward trend in the number and the size of operating quarries and associated reduction in the vegetation cover in the study area have been documented (Figure 9). The study area is one of the major marble production regions located in south west of Turkey. Marble production has been continued since ancient times in these areas, and many quarries were opened before 2001 . Therefore, vegetation around the quarries was influenced by the mining operations. Mostly vegetation near the expansion areas of quarries was damaged. For this reason, hence the rate of vegetation loss is less than the rate of pit expansion as shown in Figure 9. However, both show an increasing trend as a function of time.

Natural revegetation becomes more precarious as quarries cover larger land areas. Therefore, one cannot rely on the natural revegetation process as it would take hundreds of years to restore the habitat to its original state. It is estimated that human-induced restoration could speed up this process, and would require only a decade or less to accomplish.
Conclusions
A quick review of the literature shows that satellite-based remote sensing is a widely accepted and utilized technique in many scientific disciplines to monitor and evaluate the impact of natural processes and human activity on the environment. However, few studies have been carried out to assess the environmental impacts of mining using remote sensing. In this research, the authors present an estimation of the areal expansion of marble quarries and the associated change in the vegetation in the Mugla region in Turkey between the years 2001 and 2009, using geographic information system and remote sensing techniques. ASTER (the Advanced Spaceborne Thermal Emission and Reflection Radiometer) Level 3A01 (3D Ortho Data Set), Landsat 5 and Landsat 7 images were analysed for this purpose. The change in the natural vegetation cover was calculated using the normalized difference vegetation index (NDVI), and is observed to be related directly to the production of marble. Estimation of the expansion of the quarries from Landsat TM images was performed using the band rationing technique.
Modern open pit mining techniques utilize heavy equipment. As a result, dramatic changes in the land cover take place in a very short period of time, affecting the neighbouring habitat both ecologically and hydrologically. The maps produced from remote sensing data can provide timely and valuable information for subsequent assessment of the impact of the mining activity in the area. The use of remote sensing and geographical information systems plays an ever-increasing role in the management of mining land. Together, they provide information and statistical data for assessing habitat diversity and land cover change while a mine is in operation, which can be used for formulating policies and guidelines for post-mining land management, reclamation, monitoring, and landscape characterization.
References
1. RESS, W.G. and WILLIAMS, M. Monitoring changes in land cover induced by atmospheric pollution in Kola Peninsula, Russia, using Landsat MSS data. International Journal of Remote Sensing, vol. 8, 1997. pp. 1703-1723. [ Links ]
2. PRAKASH, A. AND GUPTA, R.P. Land-use mapping and change detection in a coal mining area: A case study in the Jharia coalfield, India. International Journal of Remote Sensing, vol. 19, 1998. pp. 391-410. [ Links ]
3. RAVAN, S.A., ROY, P.S., and SHARMA, C.M. Accuracy evaluation of digital classification of Landsat TM dataAn approach to include phenological stages of tropical dry deciduous forest. International Journal of Ecology and Environmental Science, vol. 22, 1998. pp. 33-43. [ Links ]
4. SCHMIDT, H. and GLAESSER, C. Multitemporal analysis of satellite data their use in the monitoring of the environmental impact of open cast mining areas in Eastern Germany. International Journal of Remote Sensing, vol. 12, 1998. pp. 2245-2260. [ Links ]
5. WRIGHT, P. and STOW, R. Detecting mining subsidence from space. International Journal of Remote Sensing, vol. 6, 1999. pp. 1183-1188. [ Links ]
6. OLTHOF, I. and KING, D.J. Development of a forest health index using multispectral airborne digital camera imagery. Canadian Journal of Remote Sening, vol. 3, 2000. pp. 166-176. [ Links ]
7. LATIFOVIC, R., FYTAS, K., CHEN, J., and PARASZCZAK, J. Assessing land cover change resulting from large surface mining development. International Journal of Applied Earth Observation and Geoinformation, vol. 7, 2005. pp. 29-48. [ Links ]
8. TOWNSEND, P.A., HELMERS, D.P., KlNGDON, C.C., MCNEIL, B.E., BEURS, K.M., and ESHLEMAN, K.N. Changes in the extent of surface mining and reclamation in the Central Appalachians detected using a 1976-2006 Landsat time series. Remote Sensing of Environment, vol. 113, 2008. pp. 62-72. [ Links ]
9. MOUFLIS, G.D., GITAS, I.Z., ILIADOU, S., and MITRI, G.H. Assessment of the visual impact of marble quarry expansion (1984-2000) on the landscape of Thasos island, NE Greece. Landscape and Urban Planning, vol. 86, 2008. pp. 92-102. [ Links ]
10. ANTWI, E.K., KRAWCZYNSKI, R., and WIEGLEB, G. Detecting the effect of disturbance on habitat diversity and land cover change in a post-mining area using GIS. Landscape and Urban Planning, vol. 87, 2008. pp. 22-32. [ Links ]
11. ERENOGLU R.C. and HEKIMOGLU, S. An investigation into robust estimation applied to correlated GPS Networks. Observing Our Changing Earth International Association of Geodesy, vol. 133, 2008. pp. 639-644. [ Links ]
12. FELINKS, B., PILARSKI, M., and WIEGLEB, G. Vegetation survey in the former Brown Coal Mining Area of Eastern Germany by integrating remote sensing and ground based methods. Applied Vegetation Science, vol. 1, 1998. pp. 233-240. [ Links ]
13. ROUSSEEUW, P.J. and LEROY, A.M. Robust Regression and Outlier Detection, John Wiley & Sons, New York, 1987. [ Links ]
14. SULTAN, M., ARVIDSON, R.E., and STURCHIO, N.C. Mapping of serpentinites in the Eastern Desert of Egypt by using Landsat thematic mapper data. Geology, vol. 14, 1986. pp. 995-999. [ Links ]
15. ABDEEN, M.M., ALLISON, T.K., ABDELSALAM, M.G., and STERN, R.J. Application of ASTER band-ratio images for geological mapping in arid regions; the Neoproterozoic Allaqi Suture, Egypt. Abstract with Program, Geological Society of America. GSA Annual Meeting, 5-8 November 2001, vol. 3, 2001. p. 289. [ Links ]
16. CAMPBELL, J.B. Introduction to Remote Sensing. 3rd edn. The Guilford Press, New York, 2002. [ Links ]
17. PINTER, J.P., HATFIELD, J.L., SCHEPERS, J.S., BARNES, E.M., MORAN, M.S., DAUGHTRY, C.S.T., and UPCHURCH, D.R. Remote sensing for crop management. Photogrammetric Engineering and Remote Sensing, vol. 69, 2003. pp. 647-664. [ Links ]
18. QINJIU, T. and XIANGJUN, M. Advances in study on vegetation indices. Advance in Earth Science, vol. 13, 1998. pp. 327-333. [ Links ]
19. ROUCE, J.W., HAAS, R.H., SCHELL, J.A., and DEERING, D.W. Monitoring vegetation systems in the Great Plains with ERTS. Freden, S.C., Mercanti, E.P., and Becker, M.A. (eds). Third Earth Resources Technology Satellite-1 Symposium, Washington D., USA, 1973. pp. 48-62.
20. DEERING, D.W., ROUCE, J.W., HAAS, R.H.Y., and SCHELL, J.A. Measuring forage production of grazing units from Landsat MSS data. Proceedings of the 10th International Symposium on Remote Sensing of Environment, vol. 2, 1975. pp. 1169-1178. [ Links ]
21. CURRAN, P.J. Estimating green LAI from multispectral photography. Photogrammetric Engineering and Remote Sensing, vol. 49, 1983. pp. 1709-1720. [ Links ]
22. ANDERSON, A.T., SCHULTZ, D., BUCHMAN, N., and NOCK, H.M. Landsat imagery for surface mine inventory. Photogrammetric Engineering and Remote Sensing, vol. 43, 1977. pp. 1027-1036. [ Links ]
23. TUCKER, C.J. Red and photographic infrared linear combination for monitoring vegetation. Remote Sensing of Environment, vol. 8, 1979. pp. 127-150. [ Links ] ♦
Paper received Dec. 2011
Revised paper received Mar. 2012

