


Services on Demand
Article
 English (pdf)
 Article in xml format
 Article references
Indicators

Related links
-
 Cited by Google
 -
 Similars in Google
Share

 Permalink
Journal of the Southern African Institute of Mining and Metallurgy
On-line version ISSN 2411-9717
Print version ISSN 2225-6253
J. S. Afr. Inst. Min. Metall. vol.112 n.6 Johannesburg Jun. 2012
JOURNAL PAPER
Mining simulation for room and pillar coal operation
S.P. PereiraI; J.F.C.L. CostaII; P. SalvadorettiII; J. KoppeII
IBrazil
IIFederal University of Rio Grande do Sul, Brazil
SYNOPSIS
The mechanized mining cycle using loaders and shuttle cars had its peak in terms of usage in the mining industry during 1950 through 1960. In Brazil, this system is still used at underground coal mines in southern Santa Catarina coal basin. With the aim of investigating the benefits of a new mining scheme using the room and pillar method for these local mines, a computational simulator model was developed in order to investigate the mining cycle. This paper presents the methodology used to develop the simulator and the results that the simulation shows regarding impact of the proposed new scheme on mining productivity.
Keywords: production simulation, underground coal mining.
Introduction
During the past decade, coal-fired power plants in Brazil accounted for 2 per cent of the total energy generated within the country. However, in Santa Catarina State in the south of Brazil, thermal coal plants generate 59 per cent of the energy available. This region also produces 54 per cent of Brazil's coal (2007). Currently, coal mining in Santa Catarina takes place at underground operations using the room and pillar method. Mechanized cycle mining using loaders and shuttle cars had its peak in the global mining industry during 1950 through 1960, but is still used in Brazil. This type of operation was used in various traditional underground coal producers such as the USA, South Africa, and Australia.
Brazil is not a major coal producer in the world context; consequently the mining technologies used in these particular underground mines are out dated. Most mines are small operations, using different equipment for load and haul such as LDHs, scoops, continuous miners combined with shuttle cars, and loaders with shuttle cars.
With the advent of personal computers and the availability of specific programs, engineers were offered new tools to analyse old mine engineering problems1. One of the early studies was carried out by Koenigsberg2, who addressed the problem of organizing unit operations at underground coal mines. Rist3 published the first paper in mining computer simulation. Suboleski and Lucas4 studied and simulated the operations for a room and pillar coal mine. Few publications exist that deal with the application of simulation methods for underground mines in Brazil, particularly for coal mines, contrasting with the large number found on opencast mines.
In this context, this study was developed to assist operations using outmoded technology to move to the latest mining methods that are appropriate to the geological setting in Santa Catarina. Simulation methods can help to redesign and organize these mines.
The mine
Carbonifera Metropolitana SA has operated Esperanga Mine in southern Brazil since 1984. The mine throughput exceeds 1 Mt of thermal coal per annum. The operation employs room and pillar without retreating (no pillar recovery) from the mining cycle method.
In this mining method, the following sequence of activities is employed:
i. A roof bolter is used to drill and insert full-column resin bolts for ground control immediately after the coal pile is mucked
ii. A coal cutter is used to create an extra free face, which enhances blasting efficiency
iii. A face drill is used to drill holes for blasting the coal face
iv. Blasting is carried out using ANFO-type explosives
v. Face ventilation is used to clean the fumes and the dust generated during blasting
vi. Loading of coal takes place using a loader to load shuttle cars that travel to the unloading stations (chutes) at the feeder breakers
vii. The cycle restarts at (i).
A mining panel comprises 8 to 12 roadways 6 m wide and 17 to 24 m apart, depending on the pillar size. The equipment used in mining a panel includes three roof bolters, one coal cutter, one face drill, two loaders, and three shuttle cars. There are two daily production shifts of 7.5 hours involving the operation of all equipment and a third shift that basically comprises roof support and equipment maintenance. The effective production time at the face is about 5.5 hours.
Problem definition
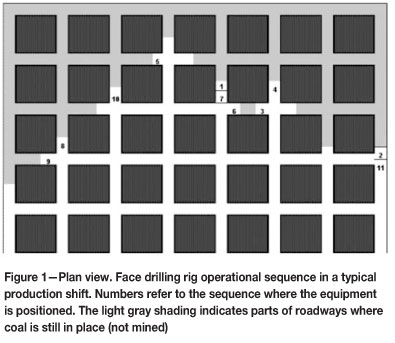
During the actual operational shifts, the fleet is positioned in order to prioritize maximum face advancement at the centre of the panel in order to access new transverse crossings as early as possible. This scheme results in a maximum number of available faces at a given time (normally ranging from 17 to 25). In contrast to the advantage of coal face availability using this strategy, the panel center advances ahead of panel flank, as shown schematically in Figure 1. This layout increases the traffic of mobile equipment at the centre of the panel, thus increasing the risk of accidents. The faces do not have a sequence or pre-defined order at the start of the cycle. The technical and production staff believe that it is impossible to maintain the required shift production if the panel is mined simultaneously along its entire extension, keeping an even advance, i.e. with the centre and the flanks advancing in a synchronized manner. It is understood a change in the present scheme would decrease the availability of faces at the start of a new cycle.
Given the described problem, this paper analyses whether it is possible to use a pre-defined mining order without reducing productivity and while maintaining an evenly distributed advance for all the extensions of the panel. Simulation of the unit operations is proposed to address the problem of forecasting the production performance for the proposed new scenario.
Methodology
The mining cycle involves a series of sequential activities. This chain of events was studied and the equipment used at each step described. The time involved in the mining cycle was measured in order to build a database containing all the information for each unit operation. Subsequently, a simulator was developed mimicking these operations and using the timings recorded in the database. The simulator was validated against real operational scenarios for the same mining sequence.
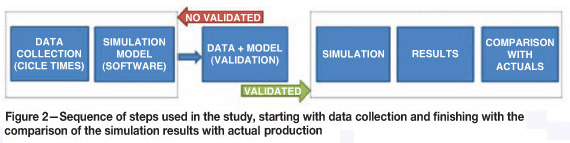
The validation of the method and its result is based on the Law and Kelton5 theory. This method is adequate for analysing systems in which the state of discrete variables is amended only by the occurrence of certain events. Deterministic simulation models are computer models that attempt to reproduce the real performance of the system, in this case, using the average time values for every stage of the production cycle involved in coal extraction. An artificial (simulated) history mimicking the behavior of the system is generated based on the logic embedded in the proposed model. Figure 2 shows the basic steps used in this study.
The simulation
Brazil is not a major coal producer like countries such as the USA, Australia, China, or South Africa, and this is reflected in the difficulty in improving mining technology in this sector. Consequently, most medium to small coal mines generally use multi-purpose general software such as Excel® for short-term mine planning. Fjellström6 uses an Excel® interface to input and output data linked to another program to simulate alternatives for ore and waste transport to the backfill area and to the crusher in the mine.
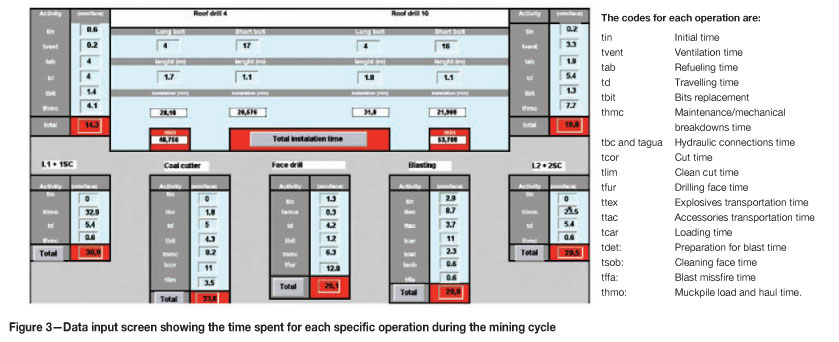
The capabilities of recent versions of spreadsheet software allow various applications in simulations. In this paper, a program was developed using Visual Basic® and Excel® for such an application. The user moves the mining equipment and sets the time for each unit operation. The system is divided into two modules. Module 1 controls the position of the equipment within the panel. The decision where equipment should be placed is completely free; however, proper allocation demands knowledge of how the mining cycle operates. Module 2 is used to control data input (times for the cycle), simulation parameters, and report preparation. The reports contain information on the number of cycles per machine, the total time of operation of each machine during a simulated shift, and other production information. As given equipment moves to the next face, the time taken to complete the previous task is added to the total cycle time.
Figure 3 presents an example of the data input screen and the fields designated for entering the time involved for each operation during the mining cycle. At the top, the time taken related to roof drilling is entered. At the centre is the area designated for data regarding the operational time of the coal cutter, face drilling, loading, hauling, and blasting.
Validation
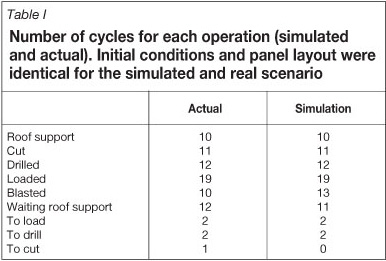
An important step in simulation is to validate the input data. This validation checks for similarity between the results predicted by the computational model and those produced by the system during actual operation. Table I summarizes the real number of cycles for each operation along a certain production shift, given a certain mining layout and equipment availability. Additionally, the forecast values derived from the simulator at the same scenario are depicted. At the beginning of each shift the panel foreman allocates each machine to a specific coal face. The simulation is done with the same initial allocation as for the real scenario. During the shift the foreman registers the number of cycles performed by the equipment, and this is the real value used to compare with the simulated one.
Simulation for a pre-defined allocation
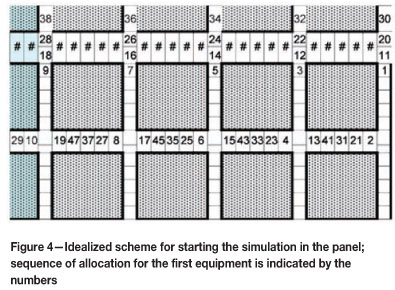
Figure 4 represents the schematic plan used to assign the equipment to a given face following the numbers ordered. For example, a roof drill starts its cycle at cell 1, and then moves to cell 2 and so on. The purpose is to maintain a rigid allocation, eliminating the need to wait for a face foreman's decision on where the equipment should be allocated.
Simulation results
In the following section, the results of a 19-day simulated period are compared with the actual results obtained during the same period. The actual production of this panel was an average of 1 301 t/day), and the average simulated throughput using a pre-defined and regular advance scheme was 1 360 t/day. During that time, there were a maximum as well as minimum number of coal faces available to start a new cycle. Consequently, this reflects on the simulation at the same way as actual scenario, keeping throughput cyclic as indicate the Figure 5.
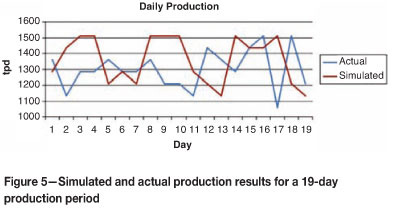
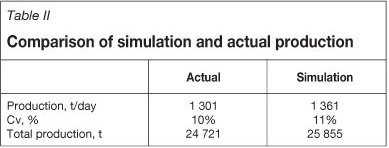
Table II summarizes the statistics for the simulated and real production.
Comments and discussion
The rigid allocation scheme leads to more predictable results than the actual system. After completion of this experiment, the coal mine supporting this study made a real attempt to implement the new scheme; however, the observation time used for the test was short. The results of these experiments were considered positive by the mine staff. Unfortunately, comparisons between the real and simulated scenarios are not straightforward. To overcome this problem, a comparison of the equivalence of the two systems is carried out using the suggestion proposed by Law and Kelton5. Using the proposed statistical test, it is possible to confirms that both systems can be considered as having the same production throughput, based on the paired-t confidence interval probability for a 90 per cent significance interval and n = 19. The fundaments for this test are:
For i = 1, 2,..., let Xi1, Xi2, ..., Xin, be a sample of ni observations from system i, and let μi= E (Xij) be the expected response of interest; we want to construct a confidence interval for ζ = μ1- μ2 (it tests if the means are statistically different). Whether X1j and X2j are independent depends on how the simulations are executed, and could determine which of the two confidence interval approaches discussed below should be used.
If n1 = n2 (= n, say), or we are willing to discard some observations from the system on which we actually have more data, we can pair X1j with X2j to define Zj=X1j - X2j for j = 1, 2, ..., n. Then the Zj values are random variables and E(Zj) = ζ, the quantity for which we want to construct a confidence interval. Thus,
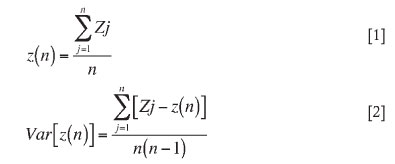
where z(n) is the z mean.
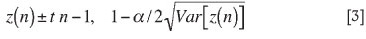
If Zj is normally distributed, this confidence interval is exact, i.e., it covers ζ with probability 1- α. Applying this test yields:
z(n) is -0,79 and Var [z(n)] is 8.29. For a 90 per cent confidence limit and n = 19:

The confidence interval is:
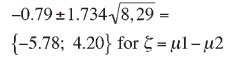
which allows us to conclude that the actual and simulated values do not differ, as the interval of confidence contains the mean of their difference.
The pre-defined equipment distribution scheme proposed here does not adversely affect production by reducing the number of available faces on the crosscuts compared to the actual system currently in use, as was previously believed at the mine site.
Conclusion
The results demonstrate that the pre-defined scheme of equipment allocation at Esperanga mine does not reduce production as expected by the mine staff. It is possible to maintain the same production using a more organized and safer operation. For this, the simulator developed for the room and pillar cycle mining was essential for allowing the comparison of different mining scenarios in terms of the number of mined faces and distribution of panel equipment.
References
1. Sturgul, J.R. Mine Design: Examples Using Simulation. Society for Mining, Metallurgy, and Exploration Inc. SME, Littleton, CO, 2000. pp. 13-31. [ Links ]
2. Koenigsberg, E. Cyclic queues. Operations Research Quarterly, 1958 pp. 22-35. [ Links ]
3. Rist, K. The solution of a transportation problem by use of Monte Carlo technique. APCOM 1. University of Arizona, Tucson, March 1961. [ Links ]
4. Suboleski S.C. and Lucas, J.R. Simulation of room and pillar face mining system. APCOM 1969, Salt Lake City. Society of Mining Engineers of the American Institute of Mining, Metallurgical and Petroleum Engineers, New York, 1969. pp. 373-384. [ Links ]
5. Law, A.M. and Kelton, W.D. Simulation Modeling and Analysis, 2nd edn. McGraw-Hill, Singapore, 1991. pp. 586-591. [ Links ]
6. Fjellström, N. Simulation of an Underground Haulage System, Renström Mine, Boliden Mineral. Master's Thesis, Luleå University of Technology, Sweden, 2011. 74 pp. [ Links ]
Paper received Apr. 2010
Revised paper received Jan. 2012

