


Services on Demand
Article
 English (pdf)
 Article in xml format
 Article references
Indicators

Related links
-
 Cited by Google
 -
 Similars in Google
Share

 Permalink
Journal of the Southern African Institute of Mining and Metallurgy
On-line version ISSN 2411-9717
Print version ISSN 2225-6253
J. S. Afr. Inst. Min. Metall. vol.112 n.6 Johannesburg Jun. 2012
TRANSATION PAPER
Mechanisms of large seismic events in platinum mines of the Bushveld Complex (South Africa)
D. MalovichkoI; G. van AswegenII; R. ClarkII
IInstitute of Mine Seismology, Australia
IIInstitute of Mine Seismology, South Africa
SYNOPSIS
Seismic events and pillar failures observed in two platinum mines in the Rustenburg area, South Africa, were investigated. We studied the sources of approximately 300 largest seismic events recorded in 2009. Moment tensors of these events were estimated from amplitudes and polarities of P- and S-waves. The inverted mechanisms contain isotropic implosive components in many instances. Analyses of uncertainty of the moment tensor solutions confirmed the significance of the implosive component in general. Several documented cases of pillar failure were considered in detail. For each of these a seismic moment tensor was calculated from an elastic stress model assuming an instant removal of a failed pillar. The geometries and magnitudes of the theoretical seismic moment tensors are in agreement with the observed (i.e. inverted from seismic data). The results indicate that either pillar failure or fracturing in the proximity of the reef (within a fraction of the dominant wavelength of seismic waves) are responsible for a significant portion of the large events recorded in these mines.
Keywords: seismic moment tensor, pillar failure, numerical modelling.
Introduction
The Bushveld Complex of South Africa hosts the majority of the world's known platinum group metal resources. A number of mines are operated in the Complex. Either one or two thin, planar, and shallowly dipping orebodies (the Merensky and UG2 Reefs) are extracted using scattered mining methods with regional stability pillars and crush pillars. The two mines near Rustenburg that are discussed in this paper extensively mine out Merensky Reef forming back areas of about 4 x 5 km2 each. The reef dips generally between 10 and 12 degrees. Current mining depth is about 1 200 m.
A common extensive seismic network based on 22 sites is operated at these mines. Most of the sensors are installed underground in tunnels parallel to the planar orebody, rendering the configuration of the sensors rather planar. Two surface sites add the much-needed third dimension to the network configuration in the area of interest. All sites are equipped with tri-axial geophones with 4.5 Hz natural frequency.
About 2 ,000 events are recorded by the network per year on average, with a recurrence time of events of moment magnitude (mw) >2.0 of about 35 days. The quality of seismic data is high - the seismic events generate clear signals in P- and S-waves not only for underground, but also for surface sites. The nearly planar configuration of the underground sensor sites results in a specific problem of location of the seismic sources -the position of the sources appears to be constrained within the reef plane but it is significantly uncertain in the direction normal to the reef. The ellipsoid of location error may have dimension of several hundreds of metres in that direction.
In general the observed seismic activity is spatially related to the recent stopes - either currently active or mined out within the previous several years. There is limited spatial association with geological features - dykes, faults and potholes. Dynamic failures of pillars were documented for some of the large seismic events. It was not, however, established whether the observed damage was reflecting the details of the seismic source or whether the damage was caused by transient waves from a nearby seismic event. Several flurries of events in the back area have been recorded, starting from the hypocentre of some large event and spreading out over several days or even, in one extreme case, over weeks. These flurries are interpreted to represent pillar runs, where the failure of one pillar initiates the loading of a next one to failure, causing a succession of seismic events. These back area pillars are generally not accessible, therefore the concept of pillar runs cannot be verified by direct observation.
Mining-related seismicity has been extensively covered in the seismological and rock mechanics literature. Many studies present evidence of a difference between the mechanisms of seismic events observed in mining and those in tectonic environments. In particular, the importance of implosive components in the inverted moment tensors is noted1-4 generally attributed to the interaction of shear failure with volumetric deformation of adjacent excavations.
Several studies of seismic source mechanisms were done for platinum mines of the Bushveld Complex. One of these5 presented results of the analysis of seismicity in two platinum mines in the Rustenburg area. The data was acquired by a near-surface site in each case. It was shown that a significant proportion of the events have enhanced amplitudes of P-waves relative to the expected radiation pattern from simple shear slip mechanisms. The interpretation was that these events originated from the punching of pillars into the footwall.
The objective of this study is to improve our understanding of the source mechanisms of the large seismic events in the mines under consideration to assist in developing appropriate mining and support strategies. We focus on:
Inversion of the moment tensors for a representative dataset of medium and large size seismic events
Analysis of seismic source mechanisms
Dataset
More than 300 events recorded by the network in 2009 were selected for detailed analysis of their sources. The following selection criteria have been used:
The size distribution of the selected events is shown in Figure 1. The largest, a mw 2.5 event, occurred on November 2 2009. More than 40 events had magnitudes greater than 1.5.

Verification of orientation and response of the seismic sensors
The study of source mechanisms is based on the examination of the patterns of the seismic radiation. The amplitudes and phases (polarities) of seismic waves radiated in different directions from the source are analysed comparatively. This sort of analysis requires a precise knowledge of the response and orientation of the seismic sensors, as corrupted components or errors in orientation characteristics (e.g. the flipping of the components by incorrect cable connection or incorrect software settings) may result in significant deviation of the inverted mechanism.
Special examination of seismic data recorded in 2009 was done to verify the response and orientation of the sensor sites. Three sorts of data were considered:
Application of these procedures resulted in the identification of a set of sites with reliable response and orientation characteristics.
Moment tensor inversion
The seismic waveforms recorded by the sites with reliable characteristics were used for the estimation of seismic moment tensors. The generally-observed simplicity of seismic waveforms recorded in these mines makes it possible to take advantage of a relatively simple and quick moment tensor inversion technique utilizing amplitudes and polarities of signals of the P- and S-waves. The amplitudes were calculated in the frequency domain, from the low-frequency plateau of displacement spectra. The amplitude and polarity data for different waves and sites were weighted according to the sharpness of the corresponding signals, i.e. the signals with strong coda had smaller influence on the results of the calculations. The mathematical function for minimization was formulated as the absolute difference (L1 norm) between the amplitudes of observed and synthetic signals, considering their polarities of course. The function was normalized in such a way that the maximum value (1.0) corresponded to equal amplitudes and opposite polarities of the observed and synthetic seismic waves for all components, while the minimum value (0.0) reflected a perfect fit. An intermediate value may be interpreted roughly as a portion of observed waves that is badly modelled. A misfit of 0.17 may, for example, be indicative of complete disagreement between observed and synthetic data (equal amplitudes but opposite polarities) for 17 per cent of seismic waves and perfect agreement for the remaining 83 per cent of the waves.
A simulation of the waveforms was done for each estimated mechanism. The simulated waveforms were compared with the recorded ones. Application of a low-pass filter below the corner frequency to both synthetic and observed waveforms provided validity of a point source approximation.
For both the source inversion and waveform modelling, the medium was assumed to be infinite and homogeneous. Inelasticity was taken into account by means of constant (frequency-independent) Q factors.
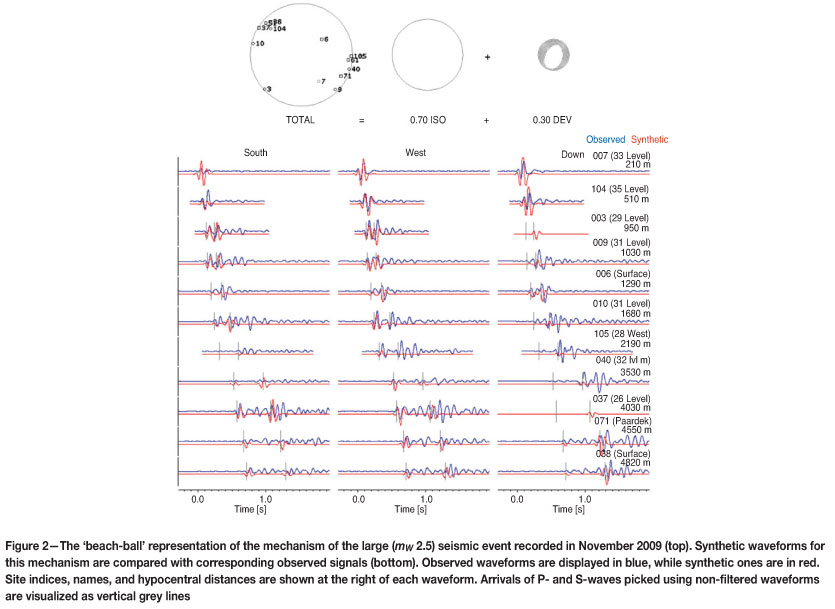
Figure 2 demonstrates the mechanism for the largest event in the dataset using the standard 'beach-ball' representation. The orientations of the source-to-site paths of sites used in the mechanism's inversion is shown on the 'TOTAL' lower hemispherical projection. The isotropic (ISO) and deviatoric (DEV) components are also displayed. The isotropic component is quite large in this case and is of negative sign, implying significant implosive co-seismic deformation in the source. Another remarkable feature is the nearly vertical orientation of the P axis (centre of 'white' area of the 'DEV' beach-ball).
The observed waveforms are compared with synthetic ones calculated for the inverted mechanism in the lower part of Figure 2. The agreement between observed and synthetic signals is acceptable - the polarities and amplitudes of the recorded initial impulses in the P- and S-waves are modelled correctly for most of the sites, resulting in a misfit of 0.12. The later signals (coda of P- and S-waves, reflection from the earth's surface) are predictably not reproduced in the synthetic waveforms as they conflict with the assumptions of a simple source and an infinite homogeneous medium.
The moment tensor solution for a smaller size event is shown in Figure 3. As in the previous case, the obtained mechanism has a significant implosive isotropic component and steep P axis. The quality of modelling of the observed waveforms in this case is a bit worse (lower part of of Figure 3). The amplitudes and polarities of the P-waves are properly modelled for most of the sites, while the S-waves are reproduced correctly for only some of the closest sites (located within about 2 000 m of the source). The misfit is 0.18 in this case.
Uncertainty of the moment tensor inversion
As it was shown in the examples above, the inverted mechanisms contain implosive components. The important question is whether the presence of this component in the solutions is significant, or whether it could be an artefact of the inversion procedure.
The standard moment tensor inversion procedure gives only a single 'best' solution. Different factors (poor network coverage, error in source location, incorrect picking of P- or S-wave arrivals) allow the possibility that another mechanism could reproduce the observed polarities and amplitudes of seismic waves as well.
A simple technique was applied to analyse the uncertainty of moment tensor inversion in relation to the presence of the isotropic component. The 6-dimensional space of possible moment tensors (corresponding to the six components of the moment tensor) was sampled and thus a significant population (~1 000 000 samples) of possible mechanisms was created. All these mechanisms (moment tensors) were tested in terms of their ability to reproduce the amplitudes and polarities of the observed seismic signals.
A 'source type plot' offered by Hudson et al.6 was found to be useful for the visualization and interpretation of the test results. Examples are shown in Figures 4 and 5. The source type plot displays mechanisms according to their volume change (along the vertical axis) and deviation from a double couple (DC) source (along horizontal axis). Note that this plot visualizes only two dimensions of the 6-dimensional space of moment tensors. For instance, a single central point of the plot includes all DC sources - a variety of orientations of the fault planes and directions of slip vectors, plus a diversity of scalar seismic moments. The details of the source type plot are described in the overview?.


The strange rhombic shape of the plot is the result of a special design condition - the areas of the plot are proportional to probabilities of the mechanisms. This makes it possible to perform uniform sampling in the space of the axes of this plot and calculate the probabilities of different source types according to the areas.
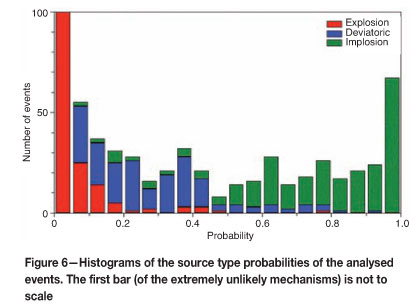
The source type plot was divided into three equal-area regions (Figure 4 and 5): the upper region corresponds to explosive sources (e.g. blasts), the middle one to the deviatoric sources (e.g. shear failures), and the bottom one to implosive sources (e.g. pillar bursts). The numerical integration (summation) over these regions gives the probability of these source processes.
In summary, the analysis of the source mechanism's uncertainty in case of each event involved three steps:
We demonstrate the application of this technique with the events shown in Figures 2 and 3.
The source type plot for the first (large) event (Figure 4) has a cluster of 'highly probable' mechanisms within the 'Implosion' region. The probability of mechanisms from the 'Deviatoric' and 'Explosion' regions is quite low. This indicates that moment tensor solution shown in the top of Figure 2 is well constrained in terms of presence of an implosive component, so the obtained implosive component could be considered as significant. This is reflected in the quantification of probabilities: 0.97 probability is assigned to the 'Implosion' source type, while only 0.03 is assigned to the 'Deviatoric', and 0.00 - to the 'Explosion' types (Figure 4).
The source type plot of the second (smaller) event (Figure 5) has a broad area of 'probable' mechanisms spreading along 'Deviatoric' and 'Implosion' regions. This indicates that besides the inverted ('Best MT') mechanism, a variety of other solutions (for instance 'Variant B' and 'Variant C' displayed in the figure) are also in agreement with the recorded seismic signals. In this case the confidence of the implosive component is less than for the previous (large) event - the probability of the 'Deviatoric' type is of the same order as probability of the 'Implosion' (0.35 vs. 0.59 - see Figure 5).
Results
These procedures of moment tensor inversion and source type uncertainty estimation were applied to all the selected events.
It was found that the overwhelming majority of events contain implosive components (similar to the samples shown in Figures 2 and 3). The analysis of uncertainties of the solutions confirms that this feature is significant - the distributions of probabilities of the source types (Figure 6) indicate that:
Analyses of particular pillar failure cases
Observations
In this section we briefly describe four seismic events for which underground information allowed particular pillars to be identified as the likely sources.
On 27 August 2009 an oversized (~ 5 x 5 m2) crush pillar dynamically failed in one of the deep levels of one of the mines. The pillar sidewall was ejected into the gully and into the stope for a distance of ~3 m (Figure 7). The network recorded a seismic event with moment magnitude 1.6. The event location is uncertain both in the north-east direction and the direction normal to the plane of the underground sensors, while the failed pillar is inside the 95 per cent location confidence region (Figure 7).

Five days later a neighbouring pillar of a similar size also failed in a similar fashion (Figure 7). This time a mw 1.8 seismic event had been recorded. As in the previous case, the location of the seismic source supports its association with the failed pillar, but does not exclude other options.
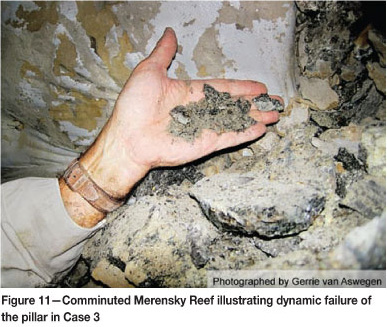
The largest of the four events, mw 2.5, occurred at the neighbouring mine on November 2 2009. In this case significant rockburst damage occurred along the sidewall of a haulage, positioned 18 m below an oversized crush pillar parallel to the tunnel (Figure 8). Several metres of the sidewall was shattered, and up to 2 m of broken rock was ejected along a plane of weakness parallel to the strata and just above the tunnel (Figure 9). On reef, the surrounds of the pillar also showed significant damage. At least 100 mm dynamic closure was observed on crushed concrete packs next to the pillar (Figure 10). Broken rock fragments from the pillar varied from very small pieces that could be scooped up like coarse grit (Figure 11) to fist-sized and larger. It appears that the pillar had a double effect on the tunnel. In the first place, the position of the pillar and its proximity to the tunnel caused anomalous stress concentration on the tunnel. Secondly, when the pillar failed the near field dynamic load on the already stressed pillar sidewall caused the observed dynamic failure (Figure 8). The location of the source of the seismic event is quite stable (Figure 8). The 95 per cent location confidence region spreads 250 m in the vertical direction, 170 m in the north-north-east direction, and 80 m in the east-south-east direction. The failed oversized pillar is within this region.


The fourth case is that of an mw 1.9 event on 27 March 2010, recorded at the same mine as Cases 1 and 2 described above. A dynamic failure of a crush pillar occurred with the event. Significant damage occurred in the E2 panel of a stope and severe damage in the gully next to the pillar in the E1 panel (Figure 12). The damage was in the form of broken rock, with fragment sizes varying from the centimetre scale to the metre scale, with most fragments being between 100 and 1000 mm in diameter. Timber props in the back area of the E1 panel opposite the failed pillar show dynamic shortening of up to 130 mm (Figure 13). The shortening was in the direction normal to the planar stope. The pillar sidewall was ejected along a plane of weakness which locally forms the stope hangingwall. This ejection mechanically scarred the (now exposed) plane of weakness leaving clear, fresh striations parallel to the direction of ejection. The naked tendons (parts of anchors exposed after the rock around most of their lengths has broken away - Figure 14) in the hangingwall above the gully were bent along this direction of ejection, i.e. parallel to the striations along the plane of weakness. The variation of this angle points backwards towards the pillar. Fractures observed in the remaining pillar in the E2 panel suggest the pillar is now failed throughout.
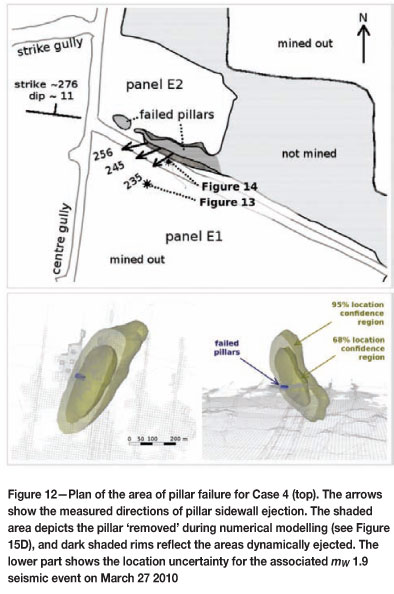


The location of the source of the mw 1.9 seismic event is uncertain (Figure 12), but since no other damage was observed in the general area of interest the association of the event with the failed pillar is reasonable.
Modelling of the source mechanisms
The observational cases described above are consistent with the hypothesis that pillar failure is a dominant component of the source of the recorded seismic events. To quantitatively verify this, modelling of seismic moment tensors for the observed pillar failures was done using a boundary-element stress modelling tool. The intention was to compare the geometry and magnitude of the modelled moment tensors with the corresponding characteristics of the observed moment tensors (i.e. inverted from the recorded waveforms as described previously).
Elastic stress modelling was performed for each of the considered cases using the in-house developed code (Integrated Static Stress Model - ISSM).
In each case the model took into account:
Two variants of the model were considered - with the pillar (initial state) and without it (final state).
The failed (removed) pillar was enclosed by a box with top and bottom surfaces laying parallel to the reef 11 m above and below it, respectively. The chosen box played the role of the 'source volume' (volume V with boundary Σ shown in the Appendix). The distributions of elastic displacement ((u(0) (x) and u(1) (x)) and traction (T(0) (x) and T(1) (x)) over the top and bottom surfaces of 'the source volume' were calculated for initial and final variants of the model, and their differences (Δu(x) = u(1) (x) - u(0) (x) and ΔT(x) = T(1) (x) - T(0) (x)) were used for the computation of the theoretical moment tensor according to the expression presented in the Appendix. The horizontal size of the 'source' box was chosen large enough to provide small amplitudes of Δu(x) and ΔT(x) over its perimeter and side sub-surfaces. In such a case the influences of the box sides in the moment tensor could be neglected.
To elucidate further we include Figure 15 showing, for the fourth case study, the relevant plans, and one section.

Results
Comparison of the modelling results with both underground observations and seismic data is summarized in Table I.
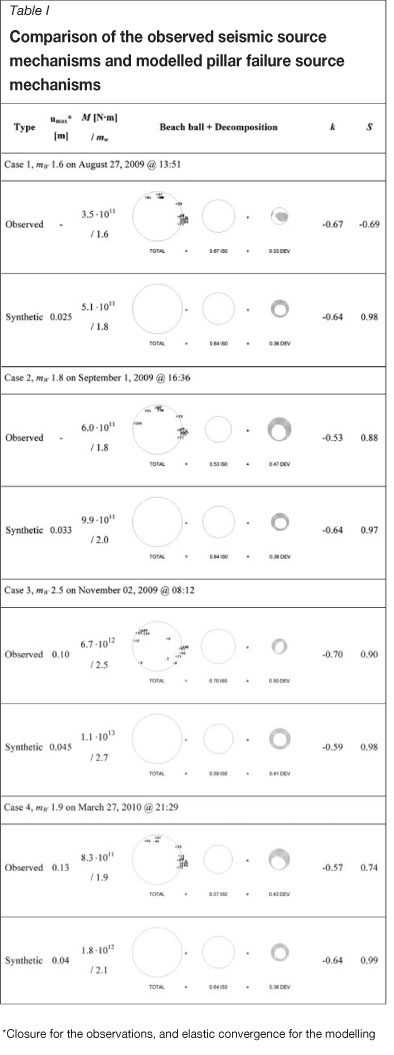
The amount of closure measured underground and elastic convergence derived from the elastic models of the initial and final states (with and without pillar) are shown in the column 'umax' For all cases the observed closure is much higher than the elastic convergence. This is an expected result as the former involves inelastic fracturing of rocks around the excavations, which is not taken into account in the 'elastic' modelling (e.g. see Figure 1.3.7 of the handbook8).
Comparison of the synthetic moment tensors (i.e. derived from the numerical model) with the observed moment tensors (i.e. inverted from waveforms of seismic events) has many aspects.
One is the 'size' of the source expressed either in terms of seismic moment M or moment magnitude mw.
Other aspects are related to the geometry of the mechanism. Particularly to quantify the implosive nature of the pillar failure mechanisms we used a standard measure of volume change of the moment tensors7:

where M(ISO) is the amplitude of components of the isotropic part of the moment tensor, M(DEV) is the amplitude of the largest principal component of the deviatoric part of the moment tensor.
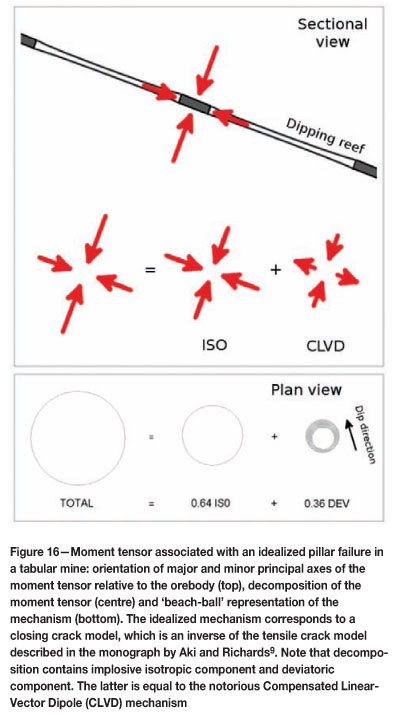
Orientations of the principal axes of both observed and synthetic mechanisms may be compared by means of their correlation with a hypothetical expected moment tensor Mij(CLVD). The latter describes the deviatoric component of the idealized pillar failure which has convergence only in the direction normal to the reef (top of Figure 16), i.e. the ride is neglected. Such an idealized mechanism will have the major principal axis of negative sign (compressive) oriented orthogonal to the reef, while the other two principal axes are of the same positive (dilatation) magnitude and located within the reef plane (centre of Figure 16). The similarity between the deviatoric part of the observed or theoretical mechanism Mij and the hypothetical expected mechanism Mij(DEV) was quantified using the normalized correlation coefficient:

where Mij(DEV) is the deviatoric part of the Mij.
As is seen from Table I, the scalar seismic moment of the modelled sources is 1.5-2.0 times higher than that estimated through seismological processing. This means that dynamic characteristics (amplitudes) of the recorded seismic waves may be explained by the modelled pillar failure only. Overestimation of the observed M value gives room for the tuning of the model. For instance, modelling of a partial (instead of complete) removal of the pillar should decrease the theoretical M value, reducing the difference between the modelled and estimated moments. Note, however, that the correspondence of the modelled to the seismologically estimated seismic moments is actually very good. It supports the pillar failure mechanism as the main contributor to the radiated low-frequency seismic waves.
The geometrical characteristics of observed and theoretical moment tensors are in agreement as follows:
Conclusions
The inversion of a large number of moment tensors for events of different size (from mw 0.5 to mw 2.5) recorded in two platinum mines in the Rustenburg area in 2009 has shown that the implosive component dominates the source mechanisms of the majority of the events. An analysis of the uncertainties of the moment tensor inversions has confirmed the significance of this result.
Four cases of dynamic pillar failure were investigated in detail. In each case the observed damage, geometrical parameters of the pillar, and closure have been documented. An elastic stress model accounting for the mined-out reef at the time of the failure was derived. Pillar failure was modelled by completely removing the pillar from the model. The resulting elastic displacement and stress change were converted to a theoretical moment tensor. In each case the magnitude (scalar seismic moment) and geometry (ratio between isotropic and deviatoric components, shape, and orientation of the deviatoric component) of the theoretical moment tensor is in general agreement with corresponding characteristics of the observed moment tensor (i.e. inverted from the waveforms of seismic events correlated with the pillar failure).
The results confirm that dynamic failure of pillars may be the general source of large and medium size seismic events recorded in the mines studied. However, the possibility of other source models is not excluded. For instance, shear failure in the proximity of the reef (within a fraction of the analysed seismic wavelengths, e.g. ~10 m for small events and ~50 m for large events) could also be described by a moment tensor with implosive component. Local-scale seismic observations constraining the vertical coordinate of seismic sources should be fruitful in discrimination between these two mechanisms (pillar failure and shear failure in the vicinity of the reef).
It is interesting to note a difference between the source mechanisms at these platinum mines and in deep-level gold mines of the Witwatersrand. Most of the large and medium size seismic events recorded in the gold mines have considerable deviatoric components in the moment tensors10. The geometry of this component (orientation of nodal planes and principal axes) makes it generally possible to associate the events either with a shear fracture of intact rocks ahead of mined-out panels (Ortlepp shear) or with a slip on geological structure.
Acknowledgements
The work has been done as a part of ISS International Ltd's self-funded research project 'Routine Modelling of Seismic Hazard'.
We are thankful to the rock engineers of the mines studied for organizing underground visits to investigate the pillar failure cases. The discussions of the cases with them were interesting and fruitful. We express gratitude to Gys Basson and Hermann Rabe from ISS International Ltd and the Institute of Mine Seismology for the modelling work.
References
1. McGarr, A. Moment tensors of ten Witwatersrand mine tremors. Pure and Applied Geophysics, vol. 139, no. 3/4, 1992. pp. 781-800. [ Links ]
2. Van Aswegen, G. and Meijer, O. The mechanisms of seismic events around faults in mines. Proceedings of the International Conference Eurock '94, 1994. pp. 605-613. [ Links ]
3. Sileny, J. and Milev, A. Seismic moment tensor resolution on a local scale: Simulated rockburst and mine-induced seismic events in the Kopanang gold mine, South Africa. Pure and Applied Geophysics, vol. 163, 2006. pp.1495-1513. [ Links ]
4. Julia, J., Nyblade, A.A., Durrheim, R.J., Linzer, L., Gok, R., Dirks, P., and Walter, W. Source mechanisms of mine-related seismicity, Savuka Mine, South Africa. Bulletin of the Seismological Society of America, vol. 99, 2009. pp. 2801-2814. [ Links ]
5. Aref, K., Spottiswoode, S.M., and Jager, A.G. A comparison of seismicity in two mines in the Bushveld Igneous Complex using different pillar systems. Proceedings of the International Workshop on Applied Rockbursts Research, Santiago, Chile, May 12 1994. pp. 113-125. [ Links ]
6. Hudson, J.A., Pearce, R.G., and Rogers, R.M. Source type plot for inversion of the moment tensor. Journal of Geophysical Research., vol. 94(B1), 1989. pp. 765-774. [ Links ]
7. Julian, B.R., Miller, A.D., and Foulger, G.R. Non-double-couple earthquakes. 1. Theory. Reviews of Geophysics, vol. 36, 1998. pp. 525-549. [ Links ]
8. Jager, A.J. and Ryder, J.A. A handbook on rock engineering practice for tabular hard rock mines. Safety in Mines Research Advisory Committee, Johannesburg, 1999. [ Links ]
9. Aki, K. and Richards, P.G. Quantitative Seismology: Theory and Methods. University Science Books, Mill Valley, California, 2002. [ Links ] .
10. Rebuli, D. and Malovichko, D. Slip-type vs fracture-type seismic events -testing the discrimination for a mine in Welkom area. Presentation at SANIRE2010, Northwest Branch. South African National Institute for Rock Engineering, Village Club, Western Levels, 14 October 2010, [ Links ].
Seismic moment tensor for a pillar failure
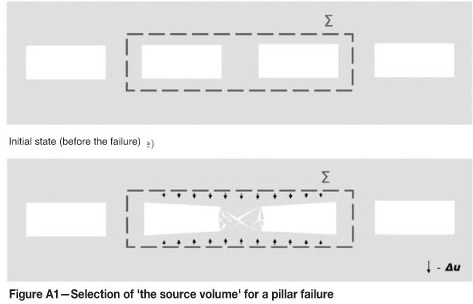
Seismic radiation from any dynamic process inside some volume V may be completely described using the time history of displacement and traction over the boundary Σ of this volume. There are two rules for selection of V and Σ:
The low-frequency part of seismic radiation could be described using difference/drop in displacements Δu(x) and tractions ΔT(x) on the Σ between initial and final states. This is equivalent to assuming a step-like behaviour of displacement and traction time histories, i.e. u(x, t) ≈ u(0) (x) + Δu(x) · H(t) and T(x, t) ≈ T(0) (x) + ΔT(x) · H(t), where H(t) is a Heaviside step function.
In the case of a pillar failure the selection of 'the source volume' shown in Figure A1 may be used.
The moment tensor is calculated from the Δu(x) and ΔT(x) distributions on the Σ1:

where n(x) is the inward normal to the Σ, ξ(0) is the point inside the Σ (centre of V may be chosen), λ(x) and μ(x) are the Lame elastic moduli, δij is the Kronecker delta tensor.
Erratum
This paper appeared in the Special Student Edition of The SAMM Journal, vol. 112, no. 4, pp. 309-322, titled 'Influence of gadolinium on the microstructure and mechanical properties of steel and stainless steel', by Z. Khan.
The author omitted to include the co-authors' names.
The co-authors should be listed as follows:
Z. Khan
School of Chemical and Metallurgical Engineering, University of the Witwatersrand
J.W. van der Merwe
School of Chemical and Metallurgical Engineering and DST/NRF Centre of Excellence in Strong Materials, University of the Witwatersrand and
A. Kapito
Advanced Materials Division, Mintek.

