


Services on Demand
Article
 English (pdf)
 Article in xml format
 Article references
Indicators

Related links
-
 Cited by Google
 -
 Similars in Google
Share

 Permalink
Journal of the Southern African Institute of Mining and Metallurgy
On-line version ISSN 2411-9717
Print version ISSN 2225-6253
J. S. Afr. Inst. Min. Metall. vol.112 n.5 Johannesburg May. 2012
JOURNAL PAPERS
Uncertainty assessment for the evaluation of net present value: a mining industry perspective
Ö. Erdem; T. Güyagüler; N. Demirel
Department of Mining Engineering, Middle East Technical University, Ankara, Turkey
SYNOPSIS
The investment decisionmaking process in the insurance and finance industries is affected by new advances such as simulation techniques. These advances have improved the discounted cash flow method (DCF). In DCF, a dynamic and flexible model construction is not possible because it does not consider uncertain conditions. Each project should be evaluated taking into account the related uncertainties because the related uncertainties determine the characterization of the project. Related uncertainties can be processed in dynamic DCF, which is applicable to both financial and non-financial industries with different kind of uncertainties, such as power generation and petroleum projects. The dynamic DCF method can estimate net present value (NPV) while managing related project uncertainties with a simulation method like Monte Carlo Simulation. The simulation method is preferred because its output is unbiased. Therefore, a more realistic financial evaluation of the project can be concluded. In spite of the improvement of dynamic DCF, this project evaluation method is not used frequently in mining industry. However, the mining industry is ideally suited to this concept because it is highly dependent on estimations such as orebody size and ore grade. During the project evaluation stage, these uncertainties can be included with the dynamic DCF method. This study aims to contribute to increasing the usage of this method in mining projects. A copper reserve in Turkey is selected as a case study to apply uncertainty assessment for the evaluation of NPV.
Keywords: uncertainty, Monte Carlo simulation, net present value (NPV), probability.
Introduction
The mining industry is a very risky industry compared to other industries because it depends on orebody estimations and decisionmakers must consider many uncertain inputs. The uncertainties have an important impact on project investment decisions. Identifying the potential sources of uncertainties is very important in order to obtain accurate results. Therefore, each uncertainty and its impact on the project should be analysed carefully. Snowden et al. (2002) stressed the importance of communicating and compiling all related mining uncertainties and their likelihood and distribution of occurrence in order to obtain reliable results for better decision making. If the upside at Sunrise Dam in Western Australia had not been considered, the deposit may never have been mined. The company produced 60 per cent more gold than the estimated value. Managing uncertainty does not mean minimizing risk, because this may result in loss of opportunities. However, there are so many mines where planning has been applied on the basis of the most optimistic estimates but in the end the companies encountered financial disaster. For example, Morley et al. (1999) indicated that the 70 percent of small mining companies in South Africa failed during the 1980s mainly because of over-estimation of the reserve tonnage and grade.
Analysis of uncertainty can help decision-makers and prevent possible errors. The modern approach in the evaluation of uncertainty in mineral resource estimation is based on determining the frequency distribution of each variable involved in the calculations and arriving at the result within some confidence interval. Managing of uncertainty related to mining can be done with the aid of the output of simulations like the Monte Carlo Simulation (MCS). Stochastic permutations of uncertainties are investigated and unbiased and consistent estimation can be obtained using MCS. The MCS procedure consists of generating random numbers according to assumed probabilities associated with sources of uncertainties. The estimated outcomes related to the random draws are then analysed to determine the possible results and associated risks. The MCS technique is widely used for dealing with uncertainty in many aspects of operations (Chance, 2008). In MCS, single-output estimation is represented as one iteration. The number of iterations is determined taking into account the project size and the importance of risks. It could be stated that as the number of runs increases, many more stochastic scenarios are evaluated in the solution space(Rezaie et al., 2007). This simulation method can be applied to estimate the Net Present Value (NPV) of mineral deposits. NPV will be obtained as a probability distribution from an output of simulation, so a decisionmaker can decide the probability of a mining project's success. The lower limit and upper limit of the NPV can also be indicated by the distribution.
There are many factors affecting the feasibility of mining investment. Traditionally, until now the effective factors have been taken as constant, although some uncertainties are involved in these factors. Since fixed values are considered as inputs in the estimations, the risks involved in the estimation cannot be defined. For a beter decision, the risk involved in the project should be determined before an investment has been made. In this study, such a model, which uses a simulation technique, has been prepared.
In this study, the importance of utilizing uncertainties in the estimation of NPV of orebody is underlined. A copper deposit (Derekoy copper deposit, Kirklareli, Turkey) is selected as a case study and it is modelled in a mine design software environment to estimate its size and copper grade. MCS method is applied to estimate NPV of the deposit while considering related uncertainties. The model has been successfully applied to a low-grade copper deposit that was regarded as mineral resources having no economic value. In the study, not only the uncertainties in the reserve estimation, but also the uncertainties involved in the economic analysis, were considered.
Dereköy copper deposit
Reserve estimation is the process that defines which part of the resource can be economically extracted (Morley et al. 1999) and in mining, the main uncertain source is the orebody, because knowledge of the orebody is based largely on estimates(Snowden et al. 2002). The importance of the reserve estimation for calculating the value of the mining project is emphasized by several researchers such as Dimitrakopoulos (1998), Yamamoto (1999), Morley et al. (1999), Snowden et al. (2002), Dominy et al. (2002), Rendu (2002), Ross (2004) and Emery et al. (2006). Dominy et al. (2002) and Morley et al. (1999) indicated that mineral resources and ore reserve reports generally contain a single tonnage and grade value. The tonnage and grade values do not contain any reference to the potential uncertainties in the estimations. 'Any resource and reserve estimation is guaranteed to be wrong. Some, however, are less wrong than others' (Morley et al. 1999). Variability of an ore reserve can significantly affect the critical decisions. Therefore, reserve estimation should be conducted using technological advances such as mine design software. Estimation of ore reserve size and average grade using mine design software can reduce the estimation errors. If the estimation risk of the reserve amount is low, the variance of NPV is reduced. In this study, to reduce the estimation errors, the Micromine 10 mine design software was used.
Derekoy copper deposit, a porphyry copper deposit in Kirklareli, Turkey, was selected as a case study to estimate the NPV of the deposit while considering related uncertainties. The location of the deposit is shown in Figure 1. The deposit was explored by the General Directorate of Mineral Research and Exploration (MTA) who drilled 25 boreholes with the total length of 8,776 m. Grade data of these drillholes was supplied from drillholes. The orebody was modelled in 3D with the data in a mine design software environment. The average grade of the deposit, reserve amount, and overburden amount were estimated as 0. 244% Cu, 210 Mt, and 140 million m3 respectively. The output of the software is presented in Table I.


Developing an uncertainty model for the deposit
Main uncertain inputs and defined distributions
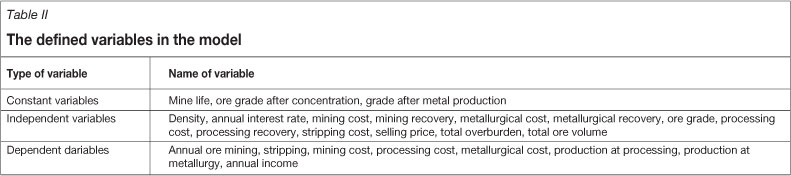
A financial model must be constructed to estimate value of a mining project. The economic value of a mining project can be determined by evaluation of cash flow. The aim of evaluation of the cash flow is to investigate the profitability of the project with related uncertainties. The economic value of a mining project is determined by the NPV (Nasuf and Orun, 1990). The main variables for the estimation of NPV in mining projects are defined. They number 20, and only three of them are defined as constant. These are mine life (20 years), ore grade after processing (20% Cu), and grade of the blister copper (99.99% Cu). The list of the all defined variables in the estimation of NPV is presented in Table II.
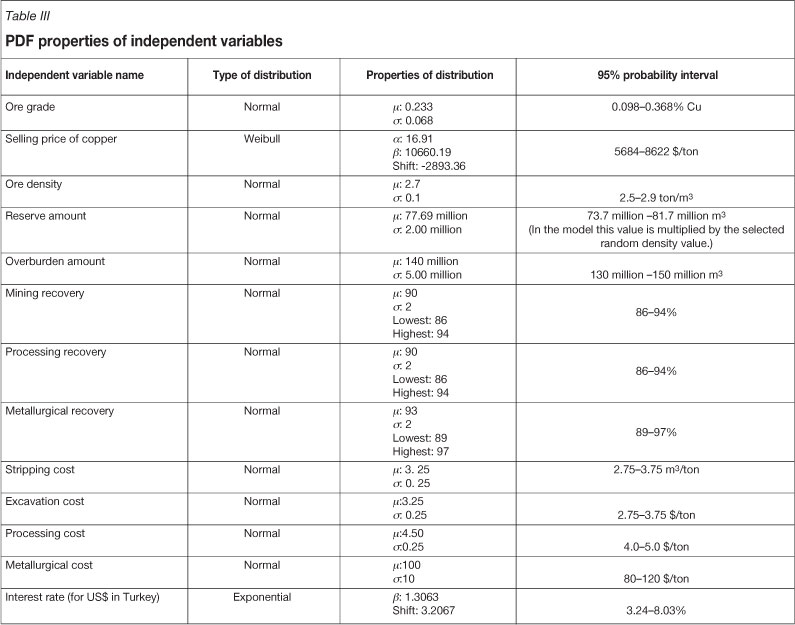
In the created model, independent variables are defined as a probability distribution function (PDF). Dependent variables are computed using independent and constant variables in the constructed model. PDF properties of independent variables are presented in Table III. Ore grade data was estimated by Micromine 10 by the block modelling technique, using each block grade. The distribution of ore grade is determined in Best Fit application of Palisade. Also, the PDF of the copper selling price and interest rate were determined by Best Fit application using historical data. The PDFs of the others were defined as normal distributions as seen in Table III. In this study, annual production amount is defined as a fixed value. The constructed model in @Risk environment selects a random value from the PDF of reserve amount, which is divided by mine life (20 years). Therefore, the fixed annual production value is estimated. This fixed value is used for estimation of a single NPV value. This cycle is repeated for each NPV value estimation.
Developed model
An uncertainty assessment model was created to simulate the NPV of the deposit. The model selects the uncertain variables from the related PDF randomly. In other words, the model is based on the Monte Carlo Simulation method. The principle behind the model is estimating revenue and cost per year. Estimation of both involves constants, independent and dependent variables. Annual cost estimation is more difficult than estimation of annual income because it includes more uncertain variables. Therefore, annual cost is divided into three main parts; namely annual mining cost, annual processing cost, and annual metallurgical cost. Estimations of the three costs were done independently in the model. After the estimations, their summation gives the annual cost. The estimation equations for annual costs and annual revenue in are illustrated in Equations [1]-[4]. In these equations, D is density in ton/m3, GAM is grade after metallurgy (It was defined as 99.99%), i is annual interest rate in percent, MC is mining cost in $/ton, Met. C is metallurgical cost in $/ton, Met. R is metallurgical recovery in percent, ML is mine life (it was defined as 20 years), MR is mining recovery in percent, n is number of year, OG is ore grade in percent (in situ), OGAP is ore grade after processing in percent (it was defined as 20 percent), PC is processing cost in $/m3, PR is processing recovery in percent, SC is stripping cost in $/m3, SP is selling price in $/ton, TO is total overburden in m3, and TOVis total ore volume, m3 (in situ).
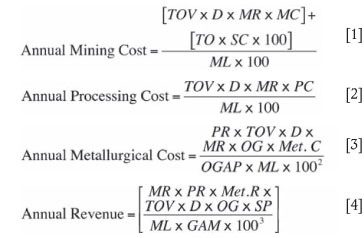
i = annual interest rate, %
MC = mining cost, $/ton
Met. C = metallurgical cost, $/ton
Met.R = metallurgical recovery, %
ML = mine life (defined as 20 years)
MR = mining recovery, %
n = number of year
OG = ore grade, % (in situ)
OGAP = ore grade after processing, % (defined as 20%)
PC = processing cost, $/m3
PR = processing recovery, %
SC = stripping cost, $/m3
SP = selling price, $/ton
TO = total overburden, m3
TOV = total ore volume, m3 (in situ).
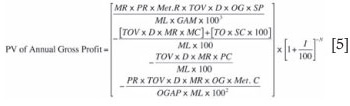
The profitability of the project can be determined by the NPV of the cash flow, which was found by the summation of the present value (PV) of the annual gross profit (AGP). The model estimates AGP independently for each year during the mine life. In a part of the model, Equation [5], the PVs of annual gross profits of the deposit are estimated independently, considering each year separately. In other words, to increase the accuracy of the model, selection of each input value in Equation [5] is not affected by the other years's selected values. For example, in the same scenario (in a single iteration) the first year's interest rate may be selected as 4.06 percent while the second year's interest rate is selected as 3.98 percent from the distributions. Annual gross profit, annual income, and annual operating costs were estimated by the model in the similar manner. Another important step in the model is the time value of money. Estimated annual gross profits are used to calculate NPV of the cash flow using a randomly selected discount rate from the related PDF.
Two important assumptions were made in the construction of the model. The inflation rate was assumed to be zero. It was also accepted that the deposit will be operated by the government and the annual gross profit will be net profit because there will be no related tax paid to the government, since MTA, which is a government institute, is the holder of the mining licence. Administration, environmental, and plant costs are not included in this study.
NPV estimation of the deposit under uncertainty
As mentioned previously, the MCS method is used by the model and 10 000 successive iterations were done. This means that 10 000 random scenarios were evaluated for the established uncertainty assessment model by @Risk 4.5.7 of Palisade. This number of iterations is selected because it is the maximum limit of the software. When iteration was conducted, the input variables were selected randomly from the related PDF and one output was estimated. In the estimation, 10 000 iterations are conducted and the results of iterations are saved by the @Risk 4.5.7 software. Probability distribution of NPV of the deposit is estimated using the results obtained by iterations. Therefore, all reliable information for the NPV was gathered.
Each year's net profit was estimated separately from the other years. Therefore, the cash flow of the project could also be observed from the model as seen in Table IV. After estimating the cash flow, the model finally, estimates 10 000 random NPVs for the Derekoy copper deposit. Using these random values, @Risk 4.5.7 established a probability distribution and cumulative density curve to indicate the probability of the profit for the deposit. The probability distribution and cumulative density curve are presented in Figure 2 and Figure 3 respectively. The type of the NPV distribution was checked with 'Fit Distribution' module of @Risk 4.5.7. The output of the fit distribution indicates that the NPV probability distribution is a normal distribution.
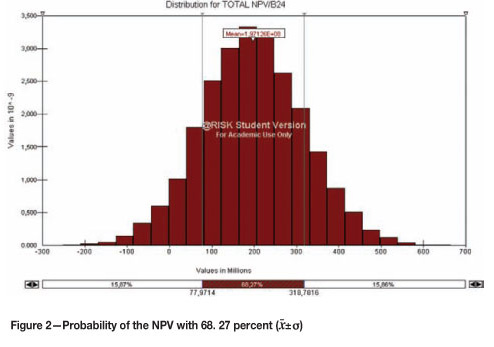


After the checking the type of the distribution, the properties of it were investigated. The mean of the NPV probability distribution is $197 126 000 and standard deviation (ó) of the distribution was found to be $120 709 600. One standard deviation interval (÷±ó = 68. 27%) and two 'standard deviation interval (÷±2ó = 95.45%) were evaluated on the probability distribution. In this case the NPV will be in the range of $77.97 million and $318.78 million with the probability of 68.27 percent as it seen in Figure 2. Considering the ÷±2ó, the range of NPV will be in the range of -$45. 37 million to $443.54 million with 95. 45 percent probability as seen in Figure 3. The probability of achieving positive NPV (profit) is 94.95 percent and probability of loss of money is only 5. 05 percent as indicated in Figure 4.

IRR estimation of the cash flow under uncertainty and sensitivity analysis
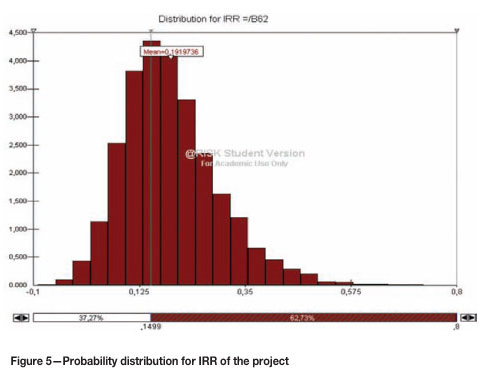
Apart from the NPV assessment of the project, the Internal Rate of Return (IRR) value of the investment analysis with uncertainty assessment was also conducted to check the profitability of the investment. In the model, a part is developed to estimate the IRR values of the project with the MCS method. The model calculates the possible IRR values and then creates a probability distribution with these values. The probability distribution for IRR is shown in Figure 5. As presented in the figure, the mean value of the distribution is 19. 2 percent. IRR value is higher than defined Maximum Allowable Rate of Return(MARR) value, 15 percent, with 62.73 percent probability. In other words, the IRR method indicates that the project is profitable with 62.73 percent probability.
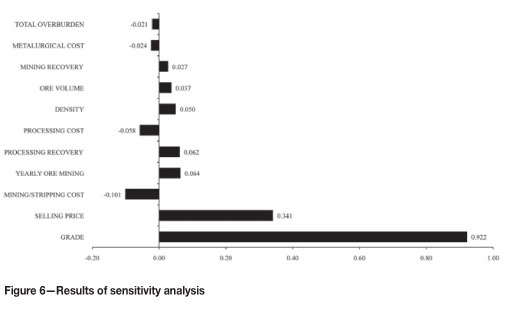
Sensitivity analysis is applied to the project to determine which variables affect the estimation of the NPV of the deposit. It is found that NPV was the most sensitive to grade, and secondly it was sensitive to the selling price of copper. The results of the sensitivity analysis are shown in Figure 6. This analysis illustrates that grade data should be updated when new data are available during the operation. The market conditions have also a significant impact on the NPV estimation because of the effect of the selling price.
NPV estimation with certain inputs
Apart from the NPV estimation with considering related uncertainties using the MCS method, NPV of the project was also calculated using the average values of the related variables. In the literature this type of estimation is called the classical NPV estimation method. The model also calculates this type of estimation by evaluating just one scenario. The same assumptions were used as in with the previous estimation technique. The average values are ore grade 0.244 percent Cu, density as 2.7 ton/m3, selling price of copper $7,434/ton, interest rate 4.68 percent, mining, processing and metallurgical recovery 90 percent, 90 percent and, 93 percent respectively, mining, stripping, processing and metallurgical cost as $3.25/ton, $3.25/ton, $4.50/ton of ore, and $100/ton of concentrate, annual ore mining 9 439 520 ton and yearly stripping cost 7 021 899 m3. Averages of historical data were applied for calculating the selling price and interest rate. It was also assumed that mine life is 20 years and annual ore production and stripping amount are constant.
The model estimated the NPV as $260 402 962. An IRR value was also estimated as 22.2% for the project. There is a big difference between the simulation and classical method. The output of the simulation is a PDF. Therefore, the uncertainty of the project can be evaluated. However, the output of the classical method is just a number and it cannot say anything about the estimation errors.
Results and discussion
There are many uncertain variables in the evaluation of the mineral reserves. A good financial model should be created to evaluate the ore reserves. Each uncertainty related to mining should be assessed carefully. In this case, accurate results can be obtained by the financial model. The decision on the mining investment is mostly related to the NPV of the project. A financial model construction needs accurate estimations of income and costs. Estimation of the revenue and costs includes many uncertainties. Therefore, a simulation method is the best tool to estimate them. Simulation can provide many scenarios related to the project. The success of the financial modeling simulation depends on the estimation of the uncertainties accurately. In other words, uncertainty assessment of the investment is not considered in the classical method. Therefore, the investor cannot answer questions such as, what is the probability of NPV exceeding $100 000 000?, or what is the probability of losing money? Mining is ae risky operation. When a mining project is evaluated, related uncertainties should be investigated and they should be included in the calculations and estimations.
In this study, Derekoy copper deposit was evaluated considering related uncertainties. After the evaluation of the deposit, the probability distribution of NPV was estimated instead of a fixed value and the type of the distribution was investigated as a normal distribution. The mean of the distribution is found as $197 126 000 and the probability of financial loss is found to be only 5.05 percent and the probability of the NPV exceeding $150 000 000 (capital cost at present) is 65.05 percent as seen in Figure 7.

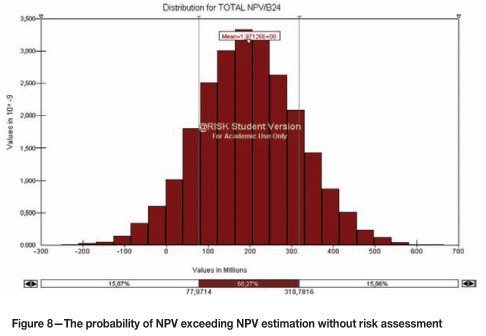
In classical estimation, a certain value was estimated. This is not a accurate approach to mining with high risks in different stages. The probability of the realization of a NPV equal to or more than $260 402 962 (estimated by model without uncertainty assessment) is 29. 44 percent as indicated in Figure 8. When the IRR values are analysed, the classical method estimates more IRR value than the other method. It means that the defined uncertainties affected the estimation of the NPV because the classical model made an overestimation. The overestimation may cause problems, such as losing money, for the investor because future of the investment is defined by the result of the NPV estimation. Therefore, NPV estimations should be conducted by including related uncertainties.
References
BADIOZAMANI, K. 1992. Computer Methods. SME Mining Engineering Handbook, (598-625). Colorado. Society for Mining, Metallurgy and Exploration. [ Links ]
CHANCE, D.M. 2008. Lecture notes: Monte Carlo Simulation. Louisiana State University, E. J. Ourso Collage of Business http://www.bus.lsu.edu/academics/finance/faculty /dchance/Instructional/TN96-03.pdf (accessed July 2008). [ Links ]
DIMITRAKOPOULOS, R. 1998. Conditional simulation algorithms for modelling orebody uncertainty in open pit optimization. International Journal of Surface Mining, Reclamation and Environment, vol. 12. pp. 173-179. [ Links ]
DOMINY S. C., NOPPE M.A., and ANNELS A.E. 2002. Errors and uncertainty in mineral resource and ore reserve estimation: the importance of getting it right. Exploration Mining Geology, vol. 11. pp. 77-98. [ Links ]
EMERY, X., ORTIZ, J.M., and RODRIGUEZ, J.J. 2006. Quantifying uncertainty in mineral resources by use of classification schemes and conditional simulations. Mathematical Geology, vol. 38. pp. 445-464. [ Links ]
ERDEM, Ö. and GÜYAGÜLER, T. 2009. REServe estimation of Derekoy copper deposit considering the Feasibility of the Project. Third Balkan Mining Congress, Izmir, Turkey, 1-3 October 2009. [ Links ]
MORLEY, C., SNOWDEN, V., and DAY, D. 1999. Financial impact of resource/reserve uncertainty. Journal of the South African Institute of Mining and Metallurgy, vol. 99. pp. 293-301. [ Links ]
NASUF, E. and ORUN, E.S. 1990. Madencilik Projelerinde Mikro-Bilgisayar Destekli Risk Analizi (in Turkish). Madencilik Dergisi, vol. 3. pp. 19-30. [ Links ]
RENDU, J.M. 2002. Geostatistical simulations for risk assessment and decision making: the mining industry perspective. International Journal of Surface Mining, Reclamation and Environment, vol. 16. pp. 122-133. [ Links ]
REZAIE, K., AMALNIK, N.S., GEREIE, A., OSTADI, B., and SHAKHSENIAEE, M. 2007, Using extended Monte Carlo simulation method for the improvement of risk management: Consideration of relationships between uncertainties. Applied Mathematics and Computation, vol. 190. pp. 1492-1501. [ Links ]
ROSS, J.G. 2004. Risk and Uncertainty in Portfolio Characterization. Journal of Petroleum Science and Engineering, vol. 44. pp. 41-53. [ Links ]
SNOWDEN, D.V., GLACKEN, I., and NOPPE, M. 2002. Dealing with demands of technical variability and uncertainty along the mine value chain. Paper presented at Value Tracking Symposium.. Brisbane, Queensland, Australia. [ Links ]
YAMAMOTO, J.K. 1999. Quantification of Uncertainty in ore-reserve estimation: applications to Chapada copper deposit, State of Goias, Brazil. Natural Resource Research, vol. 8. [ Links ]
Paper received Jun. 2011
Revised paper received Sep. 2011

