


Services on Demand
Article
 English (pdf)
 Article in xml format
 Article references
Indicators

Related links
-
 Cited by Google
 -
 Similars in Google
Share

 Permalink
Journal of the Southern African Institute of Mining and Metallurgy
On-line version ISSN 2411-9717
Print version ISSN 2225-6253
J. S. Afr. Inst. Min. Metall. vol.112 n.5 Johannesburg May. 2012
JOURNAL PAPERS
Metal-rock pair characterization in excavation engineering
M. CarduI, II; A. GiraudiI
IPolitecnico di Torino, Land, Environment and Geo-EngineeringDepartmentDITAG, Turin Italy
IICNR-IGAG, Turin, Italy
SYNOPSIS
Abrasivity and wear resistance are not intrinsic properties of materials, but rather parameters describing the interaction between the wear part and the material exerting the wearing action. Moreover, wear or, at least, that part of the wear which is due to the cumulative effect of minute scratches, is linked to the hardness disparity concept. Abrasivity, in this context, is a relative concept, pertaining to a metal-rock pair, rather than to a rock. Based on this assumption, a methodology has been developed and checked against actual cases, enabling description of the abrasiveness of a rock or the abrasion resistance of a metal through the ratio of comparable quantitative indicators. The paper describes the methods and provides examples of applications to practical cases (namely: rock cutting, excavation by means of tunnel boring machines (TBMs), rock crushing, and hydro-mill cutting).
Keywords: metal-rock, wear, microhardness, characterization, small scale.
Introduction
In rock excavation and comminution, metallic parts such as picks, cutters, drilling tools, crusher plates, impactors, etc. are employed to exert forces on the rock, in order to obtain rock failure. The parts are subjected to the same forces as the rock at the metal-rock contact points and, therefore, to more or less serious small-scale damage. Most of this damage is in the form of metal removal, due to scratches and pits on the metal surface (metal wear). Hence, the above listed parts are collectively known as 'wear parts'.
Metal wear is especially important because it dictates the 'service life' (and reciprocally, the 'replacement rate') of the wear parts.
When a particular operation is considered, it is known that, other things being equal, the rock type affects metal wear, (i.e. that different rocks show a different 'abrasivity'). In the same way, it is known that, for a particular rock type, the service life of a part is affected by the material it is made of (i.e. different metals show different 'wear resistance'). Both concepts, abrasivity and wear resistance, therefore, pertain to metal-rock pairs, rather than to rock features or metal features considered separately.
In metals, an increase in wear resistance is usually accompanied by a decrease in toughness, whereas, in rocks the opposite is usually true. Thus, the wear/breakage interplay is very complicated, with breakage usually being partly a consequence of wear. Furthermore, the wear/breakage borderline is arbitrarily set; how large damage must be to be considered breakage instead of wear is open to debate.
This paper focuses on the characterization of metal-rock pairs, with the goal of enhancing abrasivity/wear resistance prediction.
The hardness concept and measurement
The hardness concept refers to any indicator of the resistance of materials to forces exerted on a very small surface area, and therefore is linked both to the abrasivity and wear resistance concepts. Two classes of hardness evaluation criteria are known: one based on the Mohs hardness scale concept, the other on the penetration resistance, according to Prandtl1.
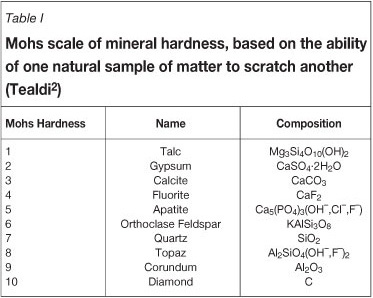
The Mohs system directly links hardness to abrasivity and wear resistance by assuming that all materials can be arranged along a scale, in which each material can scratch lower ranking materials (see Table I). Reference materials are chosen at points along the scale, and index numbers are assigned to them to simplify the expression of the relative hardness of the materials. The Mohs system works well in first approximation evaluations because the reference terms are widely spaced, but completely lacks resolving power. In fact, statements such as, 'the Mohs hardness of material A is 5.25,' are conceptually and practically meaningless2.
Prandtl's penetration hardness can be expressed either as the pressure needed to obtain penetration by ideal rigid body of small size into the tested material, or as the penetration depth obtained by the ideal rigid body under a standardized load. A variety of testing apparatus has been developed, and is currently employed3-6. The resolution power of these types of apparatus is quite good. The problem here lies in the fact that testing apparatus in most cases is 'specialized', meaning that it has been developed for a particular family of materials. A few, however, can be employed to test a wide variety of materials.
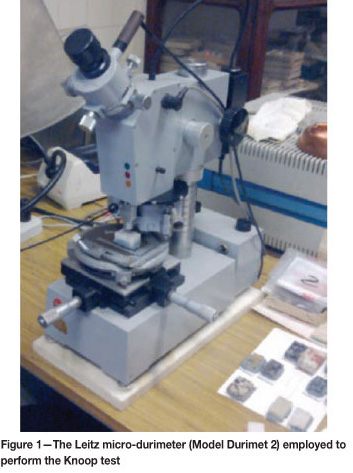
The only constraint posed by this method is that the sample to be tested must be polishable. Indentations caused by the diamond penetrator are observable only under a microscope. Hardness values quoted in this paper are obtained with a Leitz micro-durimeter (Model Durimet 2, see Figure 1) testing machine equipped with a Knoop penetrator, using a 200 g (1.962 N) load, considering the standards7,8.
A diamond penetrator shaped in a very obtuse angle and also (ideally) rigid is pressed with a known force against the polished surface of a sample. The material, at the start, is subjected to virtually infinite pressure at the point of contact. Then, pressure decreases as the contact surface area increases. Penetration stops when the pressure no longer exceeds the limit value, i.e. the load is no longer capable of producing plastic yield on the enlarged contact surface (so-called plastic hardness). The ultimate contact surface, which has been made observable by permanent deformation, is then examined under the microscope.
The Knoop apparatus was selected, because it can be utilized to measure the hardness of metals as well as of minerals, rocks, glass, and ceramics (brittle materials).
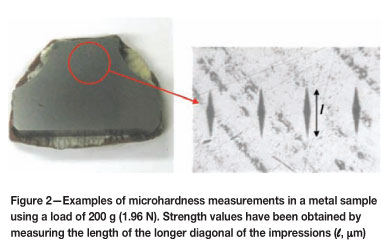
Thus, in this study, microhardness tests were performed on polished surfaces of different metal and rock samples (an example of a material tested is shown in Figure 2).
The problem of non-homogeneous materials
Hardness is easily defined in homogeneous materials, but metals and rocks are not homogeneous either at the scale of the minute scratches whose cumulative effect is wear, or on the micrometre scale of the impression left by the testing apparatus. For a given sample, hardness values measured at different points can be very different.
In principle, when testing hardness, the penetration area should be measured, and the force used divided by the area in order to determine the plastic hardness of the material at the testing point. In practice, however, a proxy variable for plastic hardness is measured that is called microhardness. The load is simply divided by the square of a selected size characteristic of the observed impression, then multiplied by a shape coefficient, accounting for the shape of the impression, which is different from one type of test to another due to the different shapes of the penetrators7,8.
In the case of the Knoop test, the standard formula is:
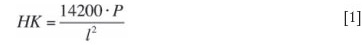
where HK is the Knoop microhardness (kgp/mm2), P is the applied force (g), and l the length of the longer diagonal of the rhombus-shaped impression (µm).
For the materials tested in this study, the length of the longest of the impressions ranged from 50 µm to 200 µm, with the longer impression occurring in the softer material. Lengths were measured to within ±0.5 µm, hence the microhardness values were measured to within ±2% in the hardest materials, and to within ±0.5% in the softer materials. Penetration depth h ranged from 1.6 to 6.6 µm.
The resolving power of the analysis, which is the minimum interval separating two measured points and still excluding any mechanical interference of the effects of the two measurements, is finer than 50 µm in the worst case, whereas soft materials led to large impressions; obviously, resolution power is finer in harder materials. The interval adopted, however, was 100 µm so as to exclude any possible interference.
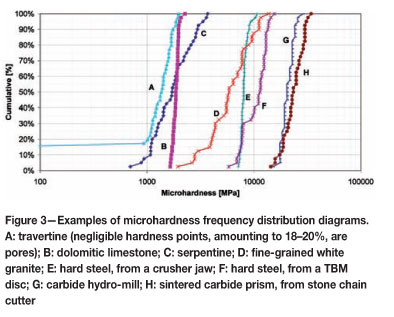
The average of readings taken at different points on a sample should not be used to characterize the sample. Rather, non-homogeneous materials should be represented with the cumulative frequency distribution of the hardness values found at all the test points. According to the literature9-12, a reproducible microhardness frequency distribution diagram can be drawn on the basis of 40 readings, even for non-homogeneous materials. Diagrams presented in this report are obtained in this way, both for rocks and for metals: examples are shown in Figure 3. Note the significant non-homogeneity at the micro-metric scale of visually homogeneous materials like metals. Only homogeneous glass is exempt from small-scale non-homogeneity.
Metal-rock pair characterization: methodology
For this study, it has been assumed that during operation the rock elements and the metal parts come in contact repeatedly, and that instantaneous contact points are randomly distributed on the surface of rock elements and metal parts. The hardness ratio between rock and metal at the contact point is directly correlated with the severity of the elementary wear event.
The metal-rock pair can therefore be characterized with a cumulative frequency distribution of the metal-rock hardness ratio at randomly distributed contact points.
A 40 by 40 matrix can be created from the 40 metal and 40 rock hardness tests that characterize the individual materials13, 14. The values in the 1600 cells of the matrix are the microhardness ratios (metal/rock), each of which has an equal probability of occurrence. Similar to before, the ratios can be graphed as a cumulative frequency distribution. How the microhardness measures influence the microhardness ratio will be explained and how the ratios should be interpreted will be discussed in the following sections.
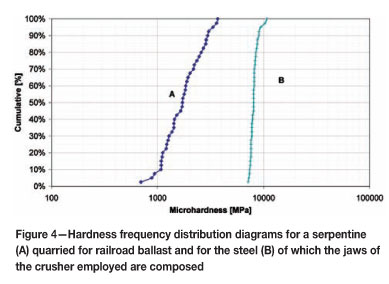
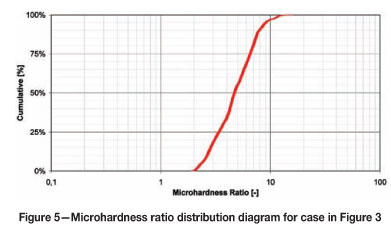
The cumulative frequency distribution diagram for serpentine (A) that was to be used for railroad ballast, and steel (B) from the jaw on the crusher employed to break the rock are shown in Figure 4. Note that in this case the steel was consistently almost an order of magnitude harder than the rock. As a result, the microhardness ratios are always greater than 1. The minimum hardness of the metal that interacts with the rock is always greater than the maximum hardness of the rock. The cumulative distribution diagram of the ratios is shown in Figure 5.
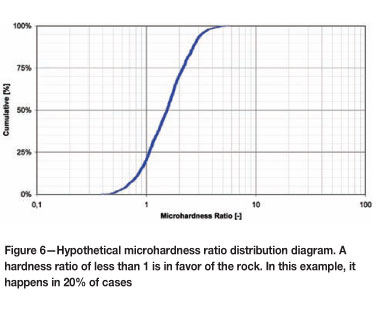
A metal-rock microhardness ratio of less than 1 occurs in situations where some test points on the rock were found to be harder than the metal. An example is shown in Figure 6 (a hypothetical microhardness ratio distribution diagram). In this case, the metal that is interacting with the rock undergoes wear at about 20 percent of the contact points, i.e. in 20 percent of cases the ratio of the hardness is in favor of the rock.
In the following sections some applications of the method described above are presented. In each case laboratory tests were conducted to determine the metal-rock hardness ratios, followed by field measurements of the tool-rock pair interactions. Conclusions were then drawn about the observed wear based on the metal-rock ratios.
Case 1: stone cutting
The service life of stone-cutting tools is strongly affected by the metal-rock hardness ratio. The microhardness ratio diagram shown in Figure 7 provides a quantitative description of the severity and frequency of the events that can damage a tool during the metal-rock interactions.
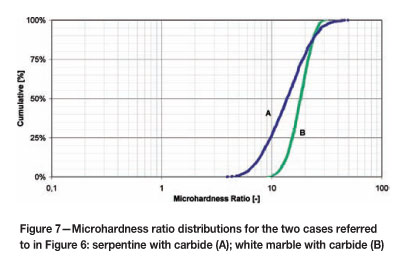
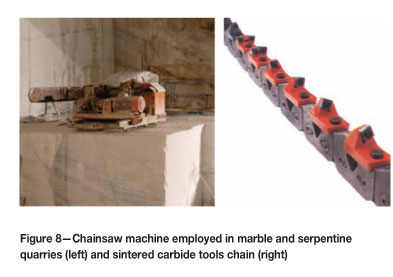
In this example, a type of chainsaw (see Figure 8) that had been employed in a white marble quarry in Carrara, Italy, and also in a serpentine quarry near Aosta, in northern Italy, was tested. In each case the saw was equipped with new sintered carbide cutting tools. And so, while both quarries use the same model of machine and the same cutting tools, the characteristics of the rocks to be cut are quite different. The hardness distribution diagrams of the sintered carbide (measured on a brand-new tool) and of the two stones are shown in Figure 9.
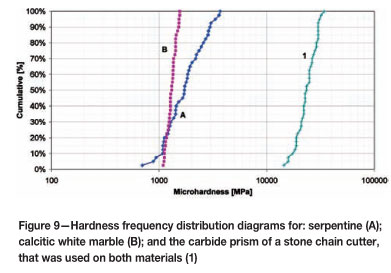
Tool damage results from the combined effect of dulling of the metal and microchipping of the rock. Tool consumption refers to the number of tools discarded per square metre of rock cut as a result of tool damage. In this test, the rate of the tool consumption as observed in the field was calculated at 0.45 for the marble quarry, and 0.75 for the serpentine quarry.
The process of microchipping the rock was a more significant wear factor in the case of serpentine than it was in the case of marble, and led to blunting of the tool. This occurred because the upper limit of hardness of serpentine approaches the lower limit of hardness of the carbide. Based on this test, it has been found that serpentines currently represent the practical upper hardness limit for cutting stone blocks with carbide-tipped chainsaws, i.e. sintered carbide cutting tools should not be used on stones that are harder than serpentine.
Case 2: stone crushing
Stone crushing can be accomplished using jaw, conical, or impact crushers. The wear life on the impactors of the former two types of equipment is longer than is the case for impact crushers. However, these types of machines tend to cost more than impact crushers and have a lower throughput rate. As a result, impact crushers are widely employed in aggregate production. They are simple and effective, resulting in high levels of throughput. Conversely, the impactors have a shorter service life than jaw or conical crushers.
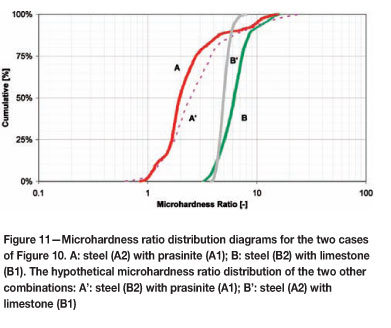
Due to the fact that impact crushers are more popular, the second case study focused on tool consumption by these machines in different applications. The tool wear was compared at two different operations that used the same type of machine, but processed different types of rock using different types of steel impactors. In case A, Hardox 500 steel impactors were used on prasinite rock material. In case B, Hardox 400 steel impactors were used on limestone rock material. The microhardness distribution diagrams and the microhardness ratio distribution diagrams of the limestone and prasinite are shown in Figure 10 (A1, B1 are the rocks; A2, B2 are the steels) and Figure 11 (A is the ratio A2/A1; B is the ratio B2/B1). The greater variability of ratio A compared to ratio B stems from the nature of the two rocks, limestone being highly homogeneous (i.e. 97 percent of CaCO3) where prasinite is composed of at least 12 minerals of varying hardness.
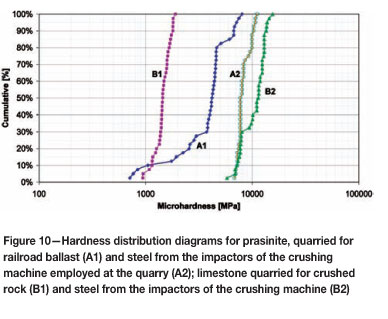
During field observations tool, wear rates were observed to vary significantly depending upon the type of rock being crushed. Wear rates were 0.18 kg/h in case A (prasinite) and less than half that rate in case B (limestone), 0.07 kg/h. The difference is even more apparent when metal wear per cubic metre is considered. Wear was calculated to be 18 g/m3 in case A, and just 2 g/m3 in case B.
Clearly, the microhardness ratio strongly affects both the hourly rate of wear and the rate of metal consumption, the latter more conspicuously. Prasinite consumes steel tools at a higher rate than limestone because it is much harder. It can be noted in Figure 10 that A1 is to the right of B1 for 90 percent of the microhardness tests. This means that the prasinite must be impacted more times than would limestone during the crushing operation to achieve the same final fragmentation. Moreover, each impact would be more damaging to the tool, which lead to the higher rate of metal removal from the tool face.
Although Hardox 400 steel tools were not being used on limestone, nor Hardox 500 tools on prasinite, at the operations visited, microhardness ratio for these hypothetical metal-rock pairs were calculated and are shown as A' for
Hardox 500-prasinite and B' for Hardox 400-limestone in Figure 11. About 3 percent of the time the microhardness ratio diagram for A' falls below a value of 1; however, 80 percent of the time A' lies to the right of A, indicating that the microhardness ratio is higher than A. This fact suggests that metal wear should be lower and tool life longer when Hardox 500 tools are used on prasinite. It is concluded that this type of steel tool could be employed when crushing prasinite or other rocks of similar hardness. Similarly, Hardox 400 steel tools are even more effective in crushing limestone than are Hardox 500 tools, which leads us to conclude that the choice of tool for use on limestone should be based on the relative costs of the two types of tools.
Case 3: tunnel driving by TBM
This case study applies microhardness ratios to the problem of tunnel boring machine (TBM) discs used to drive a hydropower tunnel. These cutting tools pose a special problem because both wear and breakage are major causes of shortened service life, and moreover, are interacting factors. For a given type of rock, the volume of rock removed, or metres of tunnel driven, will be a function of the thrust and torque of the bore head. Over time the cutting edge of the discs on the bore head wears down; the edge becomes less pointed resulting in a larger surface area contacting the rock. As noted previously, pressure decreases as contact surface area increases. Thus, to maintain the same pressure on the rock face and the same volume of rock removal, the thrust on the bore head must be increased. As thrust increases the rate of wear increases, and in addition, increased thrust makes breakage more likely.
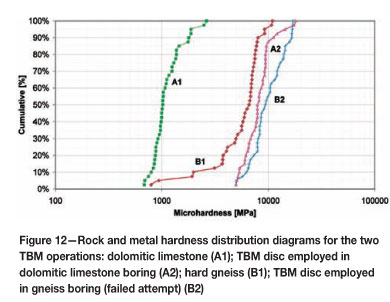
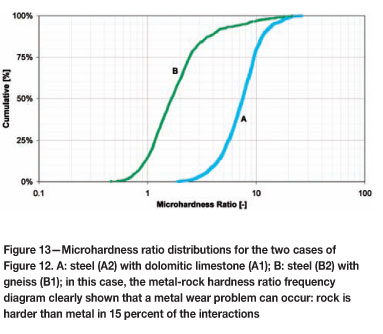
Disc wear was compared at different tunnel excavations. In this instance, the TBMs were similar though not identical. One tunnel was being bored through dolomitic limestone and the other through gneiss. The microhardness distribution diagrams and microhardness ratio distributions are shown in Figures 12 and 13.
The measurements on the discs were taken in the area highlighted in the left hand photograph of Figure 1, i.e. the measurements were concentrated near the cutting edge.
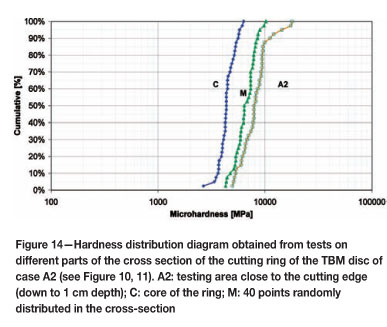
Additional hardness analyses of the cross-section of the disc revealed different metal hardening strategies for each disc. In the case of the disc B2, the same hardness distribution diagram was obtained, irrespective of the distance of the tested area from the cutting edge. In other case (disc A1), the metal close to the cutting edge was harder than the metal in the core. Figure 14 illustrates this result: the core is not as hard as the cutting edge, which means that the disc was comprised of two different hardened steels. Hardness distribution curve C refers to samples from the core area, curve A2 repeats the data from Figure 12 for the cutting edge area, and curve M reports hardness levels at points randomly distributed across the sample.
Tunnel A was successfully driven, with a level of tools consumption (0.0021 discs per cubic metre) typical of this type of operation in this type of rock. Case B, however, was unsuccessful. Operations were discontinued at 30 m chainage because all discs were out of service. Gneiss appears to have been beyond the practical limit for steel discs employed.
This result could have been predicted if the microhardness ratios had been calculated previously. About 15 percent of curve B (see Figure 13) falls bellow 1, indicting that this type of disc is not appropriate (hard enough) for cutting gneiss. It is concluded that large tunnel-boring projects should pretest discs and rocks that will be encountered, and microhardness ratios calculated, to ensure that appropriate tools are selected and that unnecessary expenses or outright failure are avoided.
Case 4: hydro-mill cutting
The final case study addresses wear of hydro-mill picks. The stations for the Turin, Italy, subway line 1 were excavated using this type of machine. The technique is fairly expensive to utilize, but is very effective and even irreplaceable in certain applications, including this one. Because of the importance of hydro-mill cutting, the microhardness of the cutting tools (picks) was tested to enable comparison with the three preceding cases. (i.e. stone cutting, stone crushing, and tunnel driving by TBM).
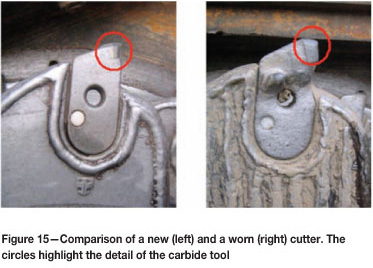
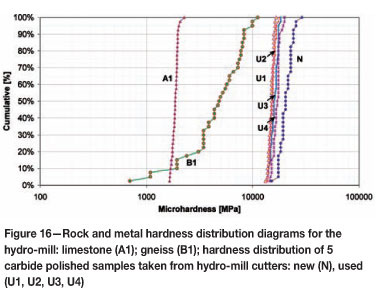
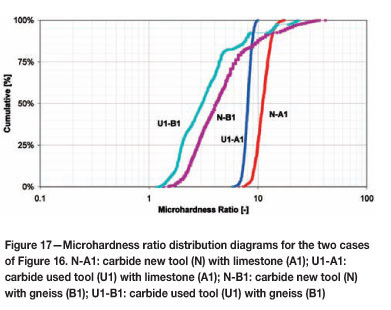
Both new and worn tools from the Turin subway station excavation were tested to study the possible decrease in metal cutting and crushing performance given the mixture of limestone and gneiss encountered during excavation cycles shown in Figure 15. As before, the circles on the photographs highlight the areas on the tools where microhardness tests were conducted. Five samples from the carbide tools (i.e. one new and four used) were obtained and polished in the laboratory. The microhardness distribution diagrams are given in Figure 16, after Munari15. Higher microhardness values are noticeable in new tool (N) compared to the used tools (U1-4), as would be expected. The two common rocks encountered in the subsoil of Turin (the limestone and the gneiss) were also tested and their microhardness distribution diagrams are included in Figure 16. The characterization of the metal-rock pairs is shown in Figure 17.
The carbide tool samples showed minimal microhardness fluctuation compared to the tools tested in some of the prior case studies or to the new pick, i.e. the microhardness distributions are almost vertical. From this observation two conclusions can be drawn:
The cutting tool material is very homogeneous (note that the sintered carbide prism from the stone cutter shown in Figure 3 G exhibits similar microhardness consistency)
From a rough estimation of wear on the cutters, a rate of tool consumption of 0.05 tools per cubic metre has been calculated, which means that 9 cutters had to be replaced each day. Given the microhardness data reported above, this rate does not appear to have been the result of an inappropriate metal-rock pairing. Alternatively, the wear may be due to other aspects of tool performance, suggesting that there may be opportunities for improvement in this area, i.e. reduction of tool consumption. Specifically, the steel tool-holder sustains heavy wear because of its contact with the rock. Note the degradation of the tool on the right in Figure 15. Tools have to be replaced due to this degradation rather than because the carbide cutting edge is worn down to the level of being ineffective. Thus, some reduction in tool consumption could be obtained by modifying the overall tool geometry. This change of the tool geometry due to the wear can also degrade the excavation performance, which leads to increased costs.
Conclusions
A method to characterize metal-rock pairs from the abrasivity point of view has been developed and tested in practical cases; the method is based on reproducible tests and provides an unambiguous means of comparing tool wear under varying circumstances, i.e. different machine, tool, and rock combinations. When supported by data from similar operations, the method correctly identifies the most suitable tool metal or predicts the changes in wear that would result from a change of the metal. Graphical representations of rock and metal tool microhardness, and metal-rock microhardness ratios have been given for each case study and their interpretation explained. These graphs are both simple and meaningful; conditions leading to a high likelihood of severe wear effects can be clearly seen.
As mentioned previously, to reduce the wear problem to a question of hardness ratios is an oversimplification; wear depends also on macroscopic strength features. Characterization at the micro-scale (for wear problems) should be complemented with characterization at a larger scale (rock and metal toughness), so that breakage problems usually superimposed on wear problems can also be dealt with. Moreover, the seriousness of the problem depends on the tolerance of wear of the operation considered. One indicator of tolerance of wear is the amount of metal that can be worn away during use without serious impairment of the efficiency of the machine part. In a percussion drilling operation, the loss of few cubic millimetres of carbide can be tolerated, but in chain cutting of marble the efficiency of the cutters is impaired by the loss of only tenths of cubic millimetres. In rock crushing the loss of many cubic centimetres, even decimetres, of jaw or impactor material can be allowed to occur, before the part is discarded.
To reduce metal wear and consequent costs of tool replacement or reshaping, it is essential to choose the most efficient and effective technology and the best-performing tool given the type of rock and the job at hand. In addition, the prior study of the microhardness of the metal-rock pair is strongly recommended in order to ensure that the right tool material is selected. Doing so will minimize the likelihood of project failure, such as occurred in the tunnel boring example, and will also assist in selection of the most appropriate cutting tool, which will reduce costs in the long term.
References
1. PRANDTL, L. Ueber die Harte plastischer Koerper. Nachrichten von der Koniglichen Gesellschaft der Wissenschaften zu Gottingen, Mathematisch Physikalische Klasse, 1920. pp. 74-85. [ Links ]
2. TEALDI, E. Mineralogia e Geologia: Vocabolario Florence, Amici Mineralogist: Fiorentini, 1991. pp. 54. [ Links ]
3. ISRM Suggested Methods, Rock Characterisation, Testing and Monitoring. Brown, E. T. (ed.). Pergamon Press, Oxford, 1981. [ Links ]
4. SZWEDZICKI, T. and DONALD, D. Assessment of mechanical parameters of rock using an indentation test. Proceedings AusIMM Annual Conference, Perth, 1996. pp. 33-36. [ Links ]
5. SZWEDZICKI, T. Indentation Hardness Testing of Rock. International Journal of Rock Mechanics and Mining Sciences and Geomechanical Abstracts, vol. 35, no. 6, Elsevier Science Ltd, 1998. pp. 825-829. [ Links ]
6. HOKKIRIGAWA, K., KATO, K., and LI, Z.Z. The effect of hardness on the transition of the abrasive wear mechanism of steels. Wear, vol. 123, no. 2, 1988. pp. 241-251. [ Links ]
7. UNI (Italian Standards) Norm n. 9724, Part VI., Materiali lapidei -Determinazione della microdurezza Knoop, 1990. pp. 6. [ Links ]
8. EN 14205. Natural stone test methods. Determination of Knoop hardness, 2003. pp. 12. [ Links ]
9. FRISA MORANDINI, A. and MANCINI, R. Application of microhardness tests to the technical evaluation of dimension stones. Proceedings: 4th International Congress of the International Association/or Engineering Geology, New Delhi, vol. 6, 1982. pp. 321-331. [ Links ]
10. MANCINI, R., CARDU, M., FORNARO, M., and LINARES, M. Scale effects in the "micro-scale" rock mechanics problems. II International Workshop on Scale Effects in Rock Masses, Lisbon, 1993. pp. 151-158. [ Links ]
11. MANCINI, R., INNAURATO, N., CARDU, M., and GAJ, F. MEtal wear prediction in mine and quarry operations, Proceedings of the International Symposium on Mining, Science and Technology, Xuzhou/China, 1996. pp. 627-632. [ Links ]
12. RIBEIRO, R.P., PARAGUASSU, A.B., and RODRIGUES, J.E. Sawing of blocks of siliceous dimension stone: influence of texture and mineralogy. Bullitin of Engineering Geology and the Environment, 2007. vol. 66, pp. 101-107. DOI 10.1007/s10064-006-0049-y. [ Links ]
13. MANCINI, R., LINARES, M., CARDU, M., FORNARO, M., and BOBBIO, M. Simulation of the operation of a rock chain cutter on statistical models of inhomogeneous rocks. Proceedings of the Third International Symposium on Mine Planning and Equipment Selection, Istanbul, 1994. pp. 461-468. [ Links ]
14. MANCINI, R., CARDU, M., GAJ, F., MARINI, P., and GIORGIO, C. Metal wear in comminution and in excavation of different rocks. Proceedings: IV Congresso Italo-Brasileiro de Engenharia de Minas, Canela-RS/Brazil, 1996. pp. 48-54. [ Links ]
15. MUNARI, D. Il secondo lotto del Passante Ferroviario di Torino: Utilizzo dell'idrofresa, Master degree thesis, Politecnico di Torino, 2009. pp. 36-47. [ Links ]
Paper received Feb. 2011
revised paper received Oct. 2011

