


Servicios Personalizados
Articulo
 Inglés (pdf)
 Articulo en XML
 Referencias del artículo
Indicadores

Links relacionados
-
 Citado por Google
 -
 Similares en Google
Compartir

 Permalink
Journal of the Southern African Institute of Mining and Metallurgy
versión On-line ISSN 2411-9717
versión impresa ISSN 2225-6253
J. S. Afr. Inst. Min. Metall. vol.112 no.5 Johannesburg may. 2012
TRANSACTION PAPER
Predicting the compressive and tensile strength of rocks from indentation hardness index
S. KahramanI; M. FenerII; E. KozmanIII
IMining Engineering Department, Nigde University, Turkey
IIGeological Engineering Department, Nigde University, Turkey
IIIGraduate School of Natural and Applied Sciences, Nigde University, Turkey
SYNOPSIS
The prediction of rock properties from indirect testing methods is important, particularly for preliminary investigations since indirect tests are easier and cheaper than the direct tests. In this study, we investigate the predictability of the uniaxial compressive strength (UCS) and Brazilian tensile strength (BTS) of rocks from the indentation hardness index (IHI) obtained using point load apparatus. Forty-six different rock types, 14 of which were igneous, 15 were metamorphic, and 17 were sedimentary were tested in the laboratory. The UCS and BTS values were correlated with the corresponding IHIvalues and the results were statistically analysed. The influence of rock classes on the relationships was also investigated. A strong correlation between UCS and IHI was found for all data. The correlation between BTS and IHI is not as strong as the correlation between UCS and IHI. However, it is in the acceptable limits. When the regression analyses were repeated for igneous, metamorphic, and sedimentary rocks, the correlation coefficients were generally increased.
The results show the UCS and BTS can be estimated from IHI. In addition, the effect of rock classes on the relationships between IHI and both UCS and BTS is important.
Keywords: uniaxial compressive strength, Brazilian tensile strength, indentation hardness index
Introduction
Rock engineers have commonly used the uniaxial compressive strength (UCS) and Brazilian tensile strength (BTS) of rock for designing surface and underground structures. Determining these rock strengths is time-consuming and expensive, particularly for the preliminary studies of projects. For this reason, indirect tests such as Schmidt rebound number and, ultrasonic test are often used for predicting rock strength. Since indirect tests require less or no sample preparation and the testing equipment is less sophisticated, these tests are very easy to carry out. In addition, these tests can usually be performed in the field. The indentation hardness test is a simple and easy test and can be conducted using a point load test apparatus. The test is of particular value when only a limited amount of rock material, e.g. a thin disc of core or a small lump sample, is available1. The UCS and BTS can easily be predicted from the indentation hardness index (IHI) for the preliminary investigations, if strong predictive correlations are established.
Since rock indentation is the basic process in drilling and boring, numerous researchers2-16 have carried out indentation tests to understand the indentation phenomena or to develop prediction models for drilling or boring. Kahraman et al.15 also investigated the relationships between the slope of load-indentation curves and the rock properties. They found good correlations between the slope of load-indentation curves and the rock properties. Kahraman and Gunaydin17 investigated the sawability prediction of carbonate rocks from indentation hardness tests carried out by attaching a dial gauge to the point load apparatus for measuring penetration. They concluded that the indentation hardness test can be used for predicting the sawability of carbonate rocks. Recently, Yagiz18 suggested a new brittleness index and rock brittleness classification based on type, strength, and density of rock together with the results of punch penetration tests.
A standard indentation test was recommended by ISRM1 and Equation [1] was suggested for the prediction of UCSfrom IHI

where UCSis the uniaxial compressive strength (MPa) and IHIis the indentation hardness index (kN/mm).
Equation [1] was obtained from the IHI testing performed on ultramafic and basaltic rocks. In this study, the relation between IHI and both UCS and BTS was investigated for igneous, metamorphic, and sedimentary rocks.
The main objective of this study is to investigate the predictability of the UCS and BTS of rocks from the IHI obtained using a point load apparatus. For this reason, 46 different rock types, including igneous, metamorphic, and sedimentary rocks were tested in the laboratory. The test results were statistically analysed and the UCS and BTS values were correlated with the corresponding IHI values. In addition, the influence of rock classes on the relationships was investigated.
Sampling
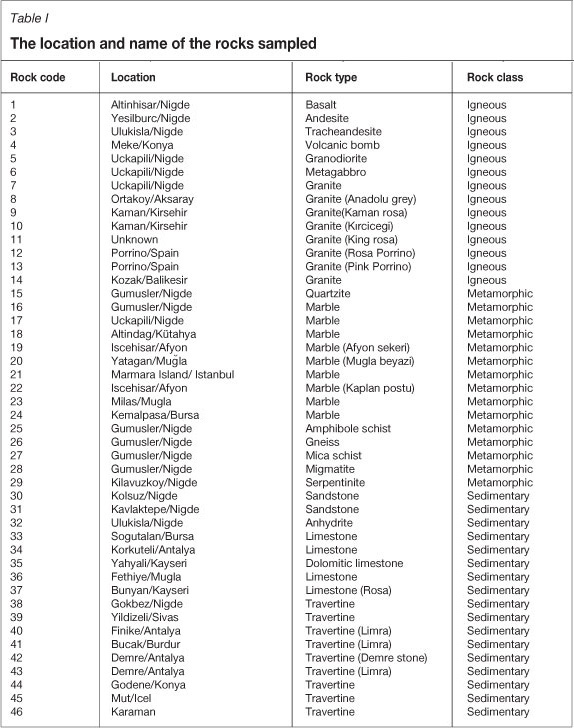
Rock blocks were collected from natural outcrops, stone and marble quarries, and stone processing plants in the Nigde, Kayseri, Konya, Antalya, and Afyon areas of Turkey for laboratory testing. Block samples were inspected for macroscopic defects to provide test specimens free from fractures, partings, or alteration zones. A total of 46 different rock types were sampled, 14 of which were igneous, 15 were metamorphic, and 17 were sedimentary. Table I shows the locations and names of the rocks sampled.
Experimental studies
Indentation hardness test
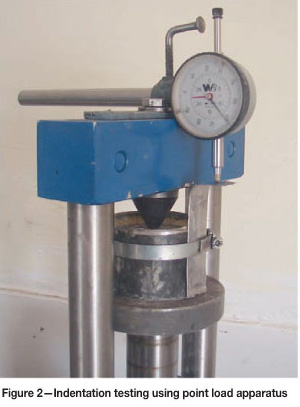
The indentation hardness test suggested by ISRM1 requires a loading system having a capacity of 30 kN and a conical platen having a 60° cone and 5 mm radius spherical tip. A point load apparatus is suitable for this purpose. After attaching a dial gauge to the point load apparatus for measuring penetration, indentation hardness tests can be carried out.
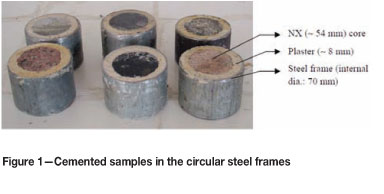
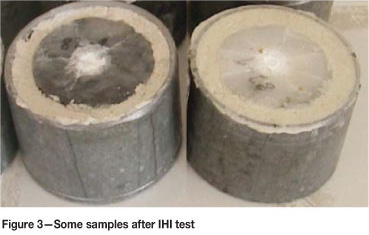
NX core samples having a height-to-diameter ratio of at least 0.75 were used in the tests. The surfaces of the samples were diamond-sawed. The samples were cemented into a steel frame using a high-grade plaster having a compressive strength of 60.6 MPa (Figure 1). After placing the sample into the centre of the steel frame, viscous plaster was filled into the gap between the steel frame and the sample. The samples were placed on the lower platen of the point load apparatus and loaded up to 20 kN as suggested by ISRMi. The corresponding penetration was read from the dial gauge (Figure 2). At least three tests were conducted on intact and fine grained samples. On the coarse-grained samples, more than three tests were carried out. IHI values were calculated by dividing the maximum load (20 kN in all tests) by the maximum penetration (mm). Figure 3 shows some samples after the IHI test.
Uniaxial compressive strength test
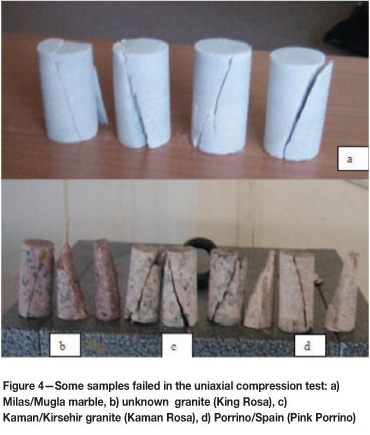
Uniaxial compressive strength tests were conducted on prepared core samples, which had a diameter of 38 mm and a length-to-diameter ratio of 2-2.5. The stress rate was applied within the limits of 0.5-1.0 MPa/s. At least five tests were done for each rock type and the average value was recorded as the UCS. Figure 4 shows some samples that failed in uniaxial compression tests.
Brazilian tensile strength test
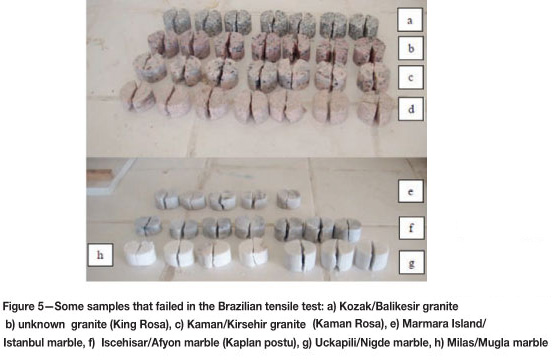
Brazilian tensile strength tests were conducted on core samples having a diameter of 38 mm and a height-to-diameter ratio of 0.5-1.0. The tensile load on the specimen was applied continuously at a constant stress rate such that failure took place within 5 minutes of loading. At least five samples were tested for each rock type and the results were averaged. Figure 5 shows some samples that failed in Brazilian tensile tests.
Results
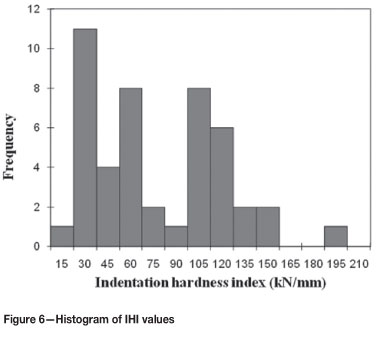
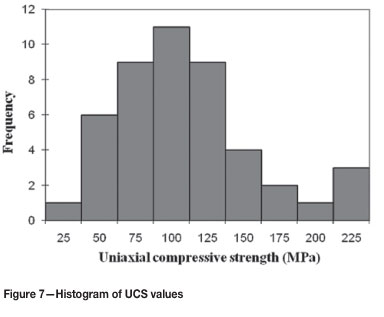
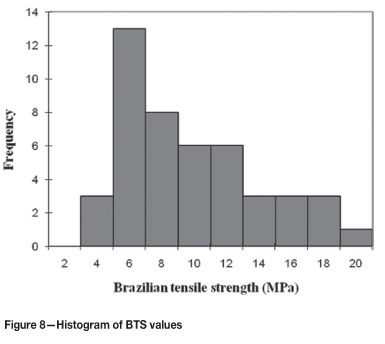
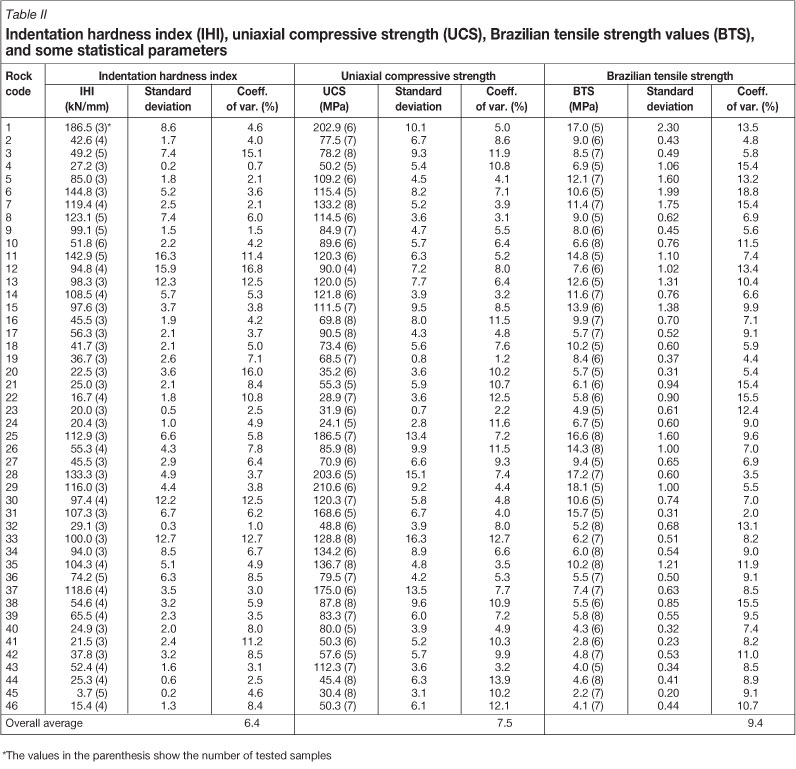
The average values of the IHI, UCS, and BTS are listed in Table II. It can be seen that IHI, UCS, and BTS values have wide ranges. Figures 6, 7, and 8 show the histograms of IHI, UCS, and BTS values. The IHI values range from 3.7 kN/mm for the Mut/Icel travertine to 186.5 kN/mm for the Altinhisar/Nigde basalt. The UCS values range from 24.1 MPa for the Kemalpasa/Bursa marble to 210.6 MPa for the Kilavuzkoy/Nigde serpentinite. The BTS values range from 2.2 MPa for the Mut/Icel travertine to 18.1 MPa for the Kilavuzkoy/Nigde serpentinite.
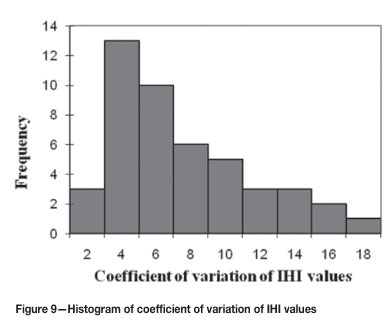
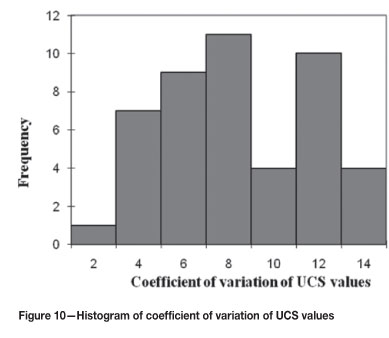
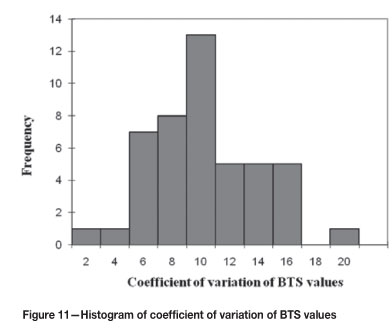
The coefficients of variation (CoV) were determined to evaluate the variability of the test results for each test and each rock type. The CoV is calculated by dividing the standard deviation by the population mean and expressing it as a percentage. The higher the CoV, the more variable are the results of a given test. Figures 9, 10, and 11 show the histograms of CoV of IHI, UCS, and BTS values respectively. The histograms of CoV were plotted for each rock type for IHI, UCS and BTS, respectively and examined. It was seen that these plots reflects the plots for all rocks. The same conclusion can be drawn from the CoV values in Table II. For this reason, these plots were not included in this paper. The CoV of IHI values of ranges from 0.7 percent for the Meke/Konya volcanic bomb to 16.8 percent for the Porrino/Spain granite, with an overall average of 6.4 percent. The CoV of UCS values of ranges from 1.2 persent for the Iscehisar/Afyon marble to 13.9 persent for the Godene/Konya travertine, with an overall average of 7.5 persent. The CoV of BTS values ranges from 2.0 percent for the Kavlaktepe/Nigde sandstone to 18.8 percent for the Uckapili/Nigde metagabro, with an overall average of 9.4 percent. The variability of each test is within the acceptable limits for most engineering purposes.
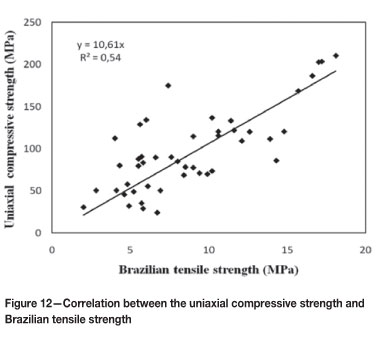
Most of rocks have a compressive strength that is approximately 10 times greater than the tensile strength20. The data was evaluated to check whether the UCS is correlated to the BTS. As shown in Figure 12, there is a fairly good correlation between the UCS and the BTS, although the data is slightly scattered. The ratio between the UCS and the BTS is consistent with the literature.
Evaluation of the results
The test results given in Table II were analysed using the method of least squares regression. Linear, logarithmic, exponential, and power curve fitting approximations were executed and the best approximation equation with highest correlation coefficient was determined for each regression.
Uniaxial compressive strength - indentation hardness index correlation
A good linear correlation between the IHI and the UCS was found for all data (Figure 13). The equation of the line is:
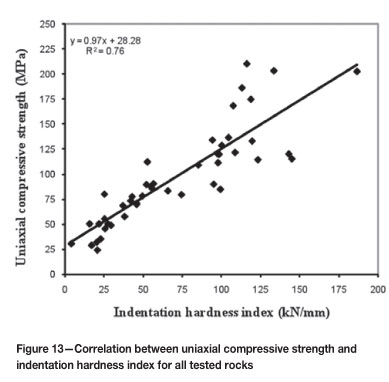

where UCS is the uniaxial compressive strength (MPa) and IHI is the indentation hardness index (kN/mm).
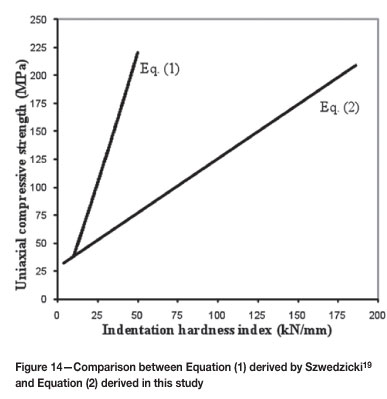
Figure 14 shows the difference between Equations. [1] and [2]. The difference is probably due the fact that the rock types tested are different in the two studies. Equation [1] was derived from the study carried out on ultramafic and basaltic rocks.
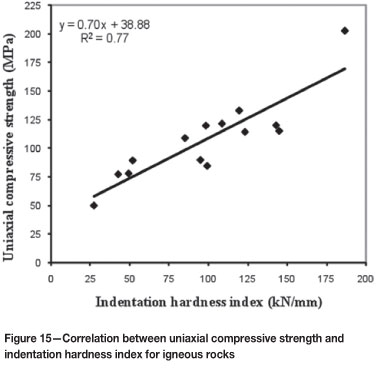
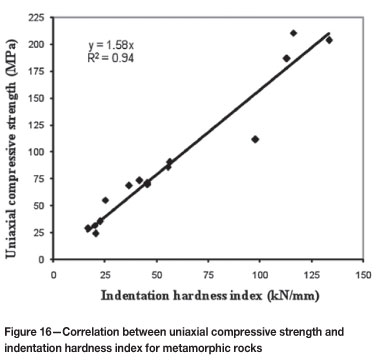
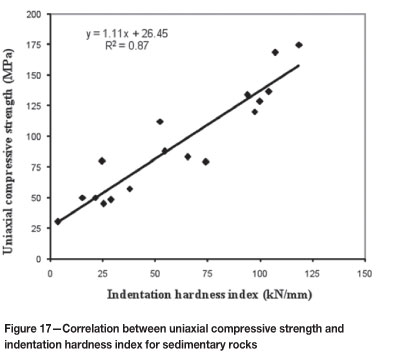
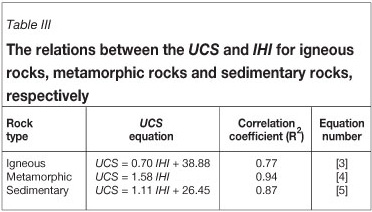
The data points in Figure 13 are scattered at high strength. To see how the correlation varies with the rock class, separate regression analyses were performed for igneous rocks, metamorphic rocks, and sedimentary rocks. As shown in Figures 15-17, the correlation coefficients are generally higher than that of Figure 13. The equations of the curves are given in Table III.
Tensile strength - indentation hardness index correlation
A linear correlation between the IHI and the BTS was found for all data (Figure 18). The equation of the line is:
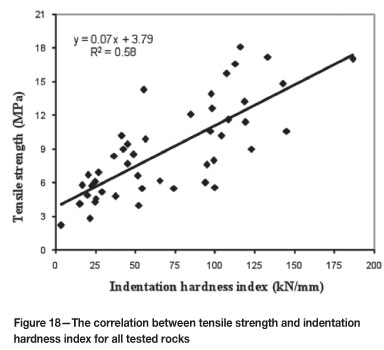

where BTS is the Brazilian tensile strength (MPa) and IHI is the indentation hardness index (kN/mm).
The data points in Figure 18 are relatively scattered comparing to Figure 13, indicating the relationship between between the IHI and the UCS. The scattering of data is probably due to the fact that the average CoV value (9.4 percent) of the BTS values is higher than the the average CoV value (7.5 percent) of the UCS values.
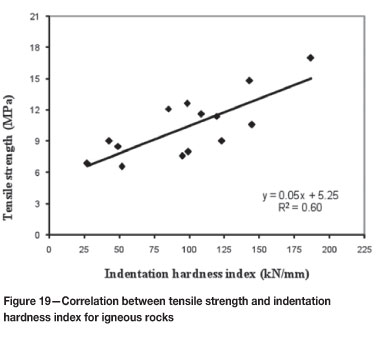
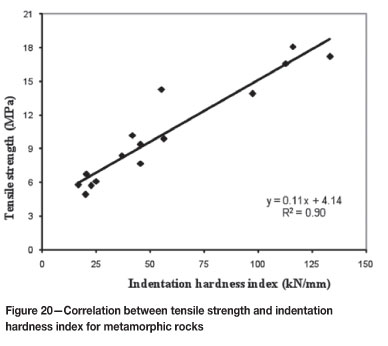
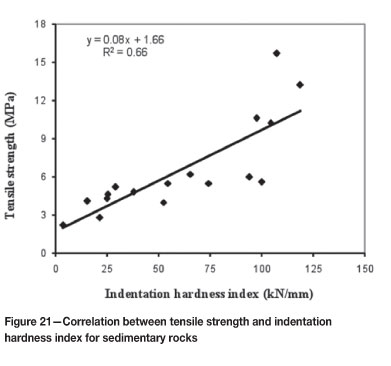
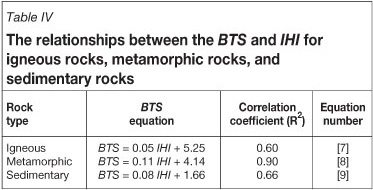
To see how the correlation varies with the rock class, separate regression analyses were performed for igneous rocks, metamorphic rocks, and sedimentary rocks, respectively. As shown in Figures 19-21, the correlation coefficients are generally higher than that of Figure 18. The equations of the curves are given in Table IV.
Validation of the derived models
As shown above, the correlation coefficients of all the equations are good, but they do not necessarily show the validity of the model. Validation of the equations was checked by the t- and F -tests.
The significance of R2 values can be determined by the t-test, assuming that both variables (dependent and independent variables) are normally distributed and the observations are chosen randomly. The test compares the computed t-value with the tabulated t-value using the null hypothesis. In this test, a 95 percent level of confidence was chosen. If the computed t-value is greater than the tabulated t-value, the null hypothesis is rejected. This means that R2 is significant. If the computed t-value is less than the tabulated t-value, the null hypothesis is not rejected. In this case, R2 is not significant. As seen in Table V, the computed t-values are greater than tabulated t-values for the all equations except Equation [3]. All models except Equation [3] are valid, and there is some doubt about Equation [3].
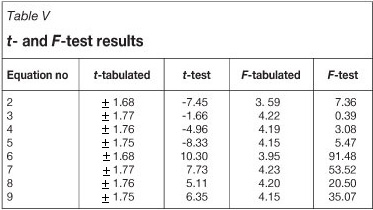
The significance of the regressions was determined by analysis of variance. In this test, a 95 percent level of confidence was chosen. If the computed F-value is greater than tabulated F-value, the null hypothesis that there is a real relation between dependent (UCS and BTS) and independent variables (IHI) is rejected. Since the computed F-values are greater than tabulated F-values for the all equations except Equations [3] and [4], the null hypothesis is rejected (Table V). Therefore, it is concluded that all models except Equations [3] and [4] are valid, although there are some doubt about Equations [3] and [4].
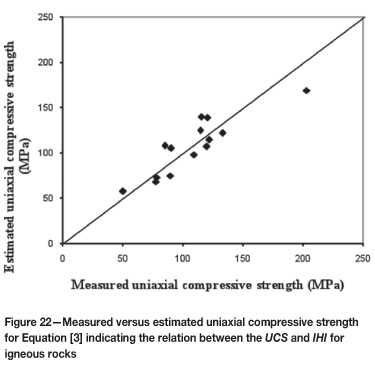
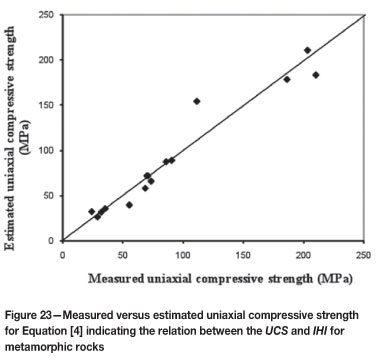
Since there are some doubt about Equations [3] and [4], the estimation capabilities of these equations were investigated using the scatter diagrams of the observed and estimated values. Ideally, on a plot of observed versus estimated values the points should be scattered around the 1:1 diagonal straight line. A point lying on the line indicates an exact estimation. A systematic deviation from this line may indicate, for example, that larger errors tend to accompany larger estimations, suggesting non-linearity in one or more variables. As shown in Figures 22 and 23, the points in the plots of estimated versus observed values for Equations [3] and [4] are scattered uniformly about the diagonal line, suggesting that the models are reasonable.
Conclusions
The prediction of rock properties from indirect tests is useful and economical particularly for preliminary investigations. The predictability of the UCS and BTS of rocks from IHI tests carried out using the point load apparatus was investigated in this study. Forty-six different rock types including igneous, metamorphic, and sedimentary rocks, were collected from the field and tested in the laboratory. The test results were statistically analysed and the UCS and BTS values were correlated with the corresponding IHI values. The data were evaluated for all rock types and for rock classes separately. A strong correlation (R = 0.76) between UCS and IHI was found for all data. The correlation between BTS and IHI is also good (R2 = 0.58), but not as strong as the correlation between UCS and IHI. To see the influence of rock classes on the relations, regression analyses were repeated for igneous, metamorphic, and sedimentary rocks separately, and it was shown that the correlation coefficients were generally increased. Confirmation of the derived models was carried out by the t-test, and F-test and the scatter diagrams of the observed and estimated values, and it was concluded that the derived models were valid.
The study covers the three rock classes igneous, metamorphic, and sedimentary, and a remarkable number of samples were tested. The samples were collected from almost all over Turkey. Therefore, it is thought that the derived relationships are expected to be stable for different geotechnical regions.
The main conclusion of this study is that the UCS and BTS can be estimated from the IHI. The effect of rock classes on the relationship between IHI and both UCS and BTS is important.
References
1. SZWEDZICKI, T. Draft ISRM suggested methods for determining the indentation hardness index of rock materials. International Journal of Rock Mechanics and Mining Sciences & Geomechanics Abstracts, vol. 35, 1998. pp. 831-835. [ Links ]
2. CHEATHAM, J.B. An analytical study of rock penetration by a single bit-tooth. 8th Annual Drilling and Blasting Symposium, University of Minnesota, 1958. pp. 1-21. [ Links ]
3. GNIRK, P.F. and CHEATHAM, J.B. Indentation experiments on dry rocks under pressure. Journal of Petroleum Technology, September, 1963. pp. 1031-1039. [ Links ]
4. PAUL, B. and SIKARSKIE, D.L. A preliminary theory of static penetration by a rigid wedge into a brittle material. 7th Symposium on Rock Mechanics, Pennsylvania State University, 1965. pp. 119-148. [ Links ]
5. CHEATHAM, J.B. and PITTMAN, R.W. Plastic limit analysis applied to a simplified drilling problem. ISRM, Proceedings of. 1st Congress, Lisbon, vol.2, 1966. pp. 93-97. [ Links ]
6. HARTMAN, H.L. The effectiveness of indexing in percussion and rotary drilling. International Journal of Rock Mechanics and Mining Sciences & Geomechanics Abstracts, vol. 6, 1966. pp. 265-278. [ Links ]
7. GNIRK, P.F. An experimental study of indexed single bit-tooth penetration into dry rock at confining pressures of 0 to 7500psi. ISRM, Proceedings of. 1st Congress, Lisbon, vol. 2, 1966. pp. 121-129. [ Links ]
8. PARISEAU, W.G. and FAIRHURST, C. The force-penetration characteristic for wedge penetration into rock. International Journal of Rock Mechanics and Mining Sciences & Geomechanics Abstracts, vol. 14, 1967. pp. 165-180. [ Links ]
9. MILLER, M.H. and SIKARSKIE, D.L. On the penetration of rock by three-dimensional indentors. International Journal of Rock Mechanics and Mining Sciences & Geomechanics Abstracts, vol. 5, 1968. pp. 375-398. [ Links ]
10. BENJUMEA, R. and SIKARSKIE, D.L. A note on the penetration of a rigid wedge into a nonisotropic brittle material. International Journal of Rock Mechanics and Mining Sciences & Geomechanics Abstracts, vol. 6, 1969. pp. 343-352. [ Links ]
11. MORRIS, R.I. Rock drillability related to a roller cone bit. Society of Petroleum Engineers, Paper No. 2389, 1969. pp. 79-83. [ Links ]
12. LUNDBERG, B. Penetration of rock by conical indentors. International Journal of Rock Mechanics and Mining Sciences & Geomechanics Abstracts, vol. 11, 1974. pp. 209-214. [ Links ]
13. PANG, S.S., GOLDSMITH, W., and HOOD, M. A force-indentation model for brittle rocks. Rock Mechanics and Rock Engineering, vol. 22, 1989. pp. 127-148. [ Links ]
14. BILGIN, N., ESKIKAYA, S., and DINCER, T. The performance analysis of large diameter blast hole rotary drills in Turkish Coal Enterprises. 2nd International Symposium on Mine Mechanization and Automation. Rotterdam, Balkema, 1993. pp. 129-135. [ Links ]
15. KAHRAMAN, S., BALCI, C., YAZICI, S., and BILGIN, N. Prediction of the penetration rate of rotary blast hole drills using a new drillability index. International Journal of Rock Mechanics and Mining Sciences & Geomechanics Abstracts, vol. 37, 2000. pp. 729-743. [ Links ]
16. COPUR, H., BILGIN, N., TUNCDEMIR, H., and BALCI, C. A set of indices based on indentation tests for assessment of rock cutting performance and rock properties. Journal of The South African Institute of Mining and Metallurgy, vol. 103, no. 9, 2003. pp. 589-600. [ Links ]
17. KAHRAMAN, S. and GUNAYDIN, O. Indentation hardness test to estimate the sawability prediction of carbonate rocks. Bulletin of Engineering Geology and the Environment, vol. 67, 2008. pp. 507-511. [ Links ]
18. YAGIZ, S. Assessment of brittleness using rock strength and density with punch penetration test. Tunnelling and Underground Space Technology, vol. 24, 2009. pp. 66-74. [ Links ]
19. SZWEDZICKI, T. The indentation hardness testing of rock. International Journal of Rock Mechanics and Mining Sciences & Geomechanics Abstracts, vol. 35, 1998. pp. 825-829. [ Links ]
20. SHEOREY, P.R. Empirical Rock Failure Criteria, Rotterdam, A.A. Balkema, 1997. 176 pp. [ Links ]
Paper received Jan. 2012
Revised paper received Jan. 2012

