


Serviços Personalizados
Artigo
 Inglês (pdf)
 Artigo em XML
 Referências do artigo
Indicadores

Links relacionados
-
 Citado por Google
 -
 Similares em Google
Compartilhar

 Permalink
Journal of the Southern African Institute of Mining and Metallurgy
versão On-line ISSN 2411-9717
versão impressa ISSN 2225-6253
J. S. Afr. Inst. Min. Metall. vol.112 no.3 Johannesburg Mar. 2012
JOURNAL PAPERS
Classifying quarries vis-à-vis prospects of profitability
J. DvořáčekI; R. SousedikováI; J. SterbaI; P. BartákII; R. ZapletalováIII
IFaculty of Mining and Geology, VSB-Technical University of Ostrava, Czech Republic
IIKamen Ostromer, Czech Republic
IIIKamenolomy CR s.r.o., Ostrava, Czech Republic
SYNOPSIS
Similar to the case of any other business venture, the activities of mining industries are profit-oriented. Nothing will stop successful businesses in their quest for new localities to be prospected for minerals of their choice, because the useful economic life of any mine is limited. Before starting the process of land acquisition, it is important for any mining company to be able to forecast the profitability of the venture.
The focus of this paper has been on the prospects of success, concerning the case of the opencast extraction of aggregates for construction. A set of 70 successful and loss-making quarries was subjected to investigation. An international company owns the quarries, which are located in seven European countries. The method of discriminate analysis provided the criteria for assessing future economic performance. The same criteria served the purpose of classifying other quarries belonging to the company.
Keywords: quarries, economic results, prediction of economic performance.
Introduction
In the latter part of the 20th century, the extraction of minerals in the East European countries declined owing to cutting of production and closure of mining facilities. The main reasons for this process were unprof-itability and discontinuation of state subsidies. Another characteristic feature of the period was privatization which occurred concurrently with the overall restructuring of the mining industry. However, the extraction of building materials increased, being very often assisted with investment from abroad.
Nevertheless, public attitudes to mining were getting progressively worse, and it was difficult to implement new projects. The economically strong companies could ensure their future development by buying existing mining facilities. The reason for this was not only a desire to valorize standing capital, but also the mines' limited economic life, which is principally defined by a mineable reserve and the rate of deposit exploitation.
A decision to buy a new mining facility is strongly influenced by a forecast of its future economic development. Whether the business will be profitable influences not only the decision on acquisition itself, but also the purchase price. In providing a forecast of future economic development of a specific mining facility, it is necessary to be able to classify it vis-á-vis prospects of its future profitability. The following process can be used for such classification:
Create a basic file from the category of profitable businesses and the category of loss-making facilities
The standard method of discriminate analysis was used to define the criterion for classifying a mining facility's prospect of profitability.
Discriminate analysis method
The discriminate method of classification, according Meloun and Militký (2004), evaluates relations between groups of m independent attributes, discriminators, and single qualitative dependent variables. In the simplest case, this variable is a binary variable with a value of 0 or 1. An object belongs to Class I if the binary variable value is 0, and to Class II if the binary variable value is 1. The objective is to find a prediction model that would enable classification of new objects.
We start with two classes of objects, where each object is characterized by the discriminator values. Class I consists of objects, n1, and the class can be described by the matrix n1 x m, rows of which are formed by the discriminator values of a specific object, and the columns are formed by the specific discriminator values for various objects. In analogy to this, Class II consists of objects, n2, and can be described by the matrix n2 x m. It is of advantage if both classes have the same number of objects, namely n1 = n2. The sample averages (these are vectors whose components are calculated as the discriminators' average values),  a
a  , are calculated, as well as the common covariance matrix:
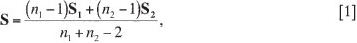
where S1 and S2 are covariance matrices of individual classes.
An appropriate method will provide for an a priori probability assessment of an object belonging to Class I or Class II, the simplest assumption being  .
.
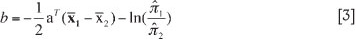
The vector a is specified (linear discriminate function coefficients are its components) by means of sample averages and , and inversion matrix, S-1, to a common covariance matrix, S:

and the coefficient b by means of the vector aTtransposed to the vector a and the above-mentioned selective averages, x1 and x2.
Classifying new objects with attribute values, XO, a rule is applied that puts an object in Class I if aTxO + b > 0.
If aTxO + b < 0, the object is put in Class II.
The linear discriminate analysis was applied to a number, n, of quarries that were structured into two classes of profitable (n1) and loss-making (n2) facilities. To each business, a set of discriminators, m, was attributed. The objective is to find a discriminate function that would provide for classifying any other business characterized by the defined discriminators as profitable or loss-making.
If Class I of profitable businesses, n1, is characterized by the mean value vector,

and the covariance matrix, S1, the Class II of loss-making firms, n2, provides for mean values,

and the covariance matrix, S2, then the discriminate function coefficients,

are calculated by means of the equation:

If the mean value vectors for Class I and Class II are substituted in the discriminate function, we can calculate average values,  and
and  .
.
The optimal threshold value, C, which determines objects as belonging to Class I or Class II, can be calculated as follows:
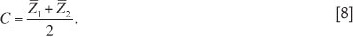
Non-classified businesses whose linear discriminate function values are in excess of C can be classified as profitable. If the linear discriminate function values are less than C, companies are classified as loss-making.
Input information
The issue of classifying mining facilities as profitable or loss-making was investigated concerning opencast extraction of minerals for building purposes. Specifically, it concerned those mining facilities specializing in extraction of minerals used for building of roads and railways. The facilities are in owned by a major company located in Central Europe*.
The basic set of input information (2010) is from 70 quarries in seven eastern and central European countries. These quarries are part of a holding company. Each quarry issues individual reports on their economic performance, inclusive of all their revenues and costs. Higher management costs are presented as part of the overheads of individual quarries. These overheads are calculated as percentages of the revenues from sales of extracted materials to external customers. One half of the quarries were profitable in 2010; the other half operated at a loss. To keep both sets equal, not all mining facilities were taken into consideration. Note that the costs comprise both external costs (for example, invoices of suppliers) and internal costs implied in the hierarchical order of management (for example, costs of land acquisition in the extraction area). As such, the actual economic result differs from the accounting result, and is called an operative economic result. Nevertheless, the method of creating the
Selecting specific parameters
Specific parameters, which characterize both profitable and loss-making mining facilities, were taken largely from companies' internal documents. A special investigation was needed to provide for two specific parameters. In assessing the predictive value of individual parameters vis-á-vis the economic performance, the following parameters were considered:
- Proportion of fixed costs in total costs—The parameter reflects cost structure from the point of view of production volumes. Depreciations, machinery and real property hiring costs, fixed components of wages, interests, costs of aggregates test, taxes, insurance, and other costs are taken as fixed costs.
- Proportion of personnel costs in total costs—The parameter reflects workforce numbers and labour productivity and indirectly shows the quality and level of technical equipment of the facility.
- Proportion of area costs in total costs—The area costs represent depreciations of investments in the industrial estate acquisition, inclusive of internal interest on the capital invested in the acquisition. The parameter reflects the natural condition of the mineral deposit and the price of the industrial estate needed for the operation of the mining facility.
- Proportion of subcontracting costs in total costs— Drilling and blasting operations, loading, transport of run-of-mine to the crushers, and mobile crusher operations are outsourced. The parameter reflects the level of technical equipment of the facility and its utilization.
- Proportion of industrial estate costs in total costs— The industrial estate costs include depreciation of buildings and construction and costs of renting the estates without mineral deposits. The parameter reflects the level of fixed assets of the facility.
- Earnings per ton of aggregates—In fact, it is the price that has been adjusted to included the conditions for delivering the product. This parameter is influenced by natural conditions and the current market standing of the mining facility.
- Sale of aggregates—The parameter shows the quarry's resources, natural conditions, and exploitation of market and trade opportunities.
- Proportion of variable costs in 1 ton of aggregates— The parameter is given by combined functioning of technological and organizational factors.
- Los Angeles testing—The parameter shows the resistance to wear of aggregates and crushed rock; that is, it reflects the quality of the quarry product, and its suitability of construction purposes, for example, for building of roads or railways.
- Quarry tenure period—The parameter shows the period in which the company could organize and manage the operations of the facility.
The average values of the parameters for the set of profitable and loss-making quarries are given in Table I.
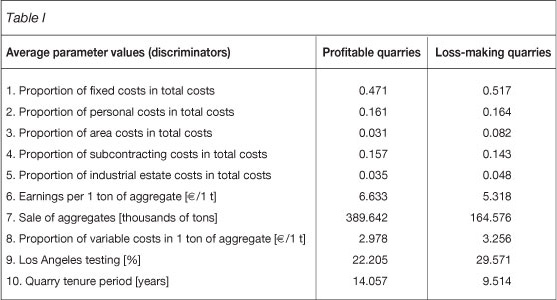
It is obvious from the Table that the differences between the values of profitable and loss-making facilities are statistically significant at the 5% level, for the following parameters: proportion of area costs in total costs, proportion of industrial estate costs in total costs, earnings per 1 ton of aggregates, sale of aggregates, and quarry tenure period. This means that profitable quarries are, on average, bigger, and the period of their tenure is longer; they produce higher priced aggregates, and the industrial estates have longer past records, which usually means that their original price of acquisition was lower.
Application of discriminate analysis
The method of discriminate analysis was applied to the input file of 35 profitable and 35 loss-making quarries. The most important output for the evaluation of the quarries was the determination of the discriminate function coefficients and the value of the optimum threshold point. This data is part of Table II.
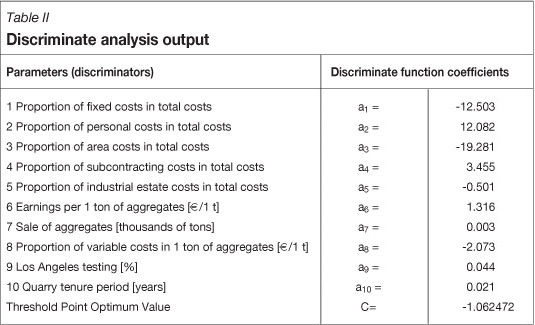
As based on the data shown in Table II, it is possible to verify the success of the discriminate function application. Using the parameter values (discriminators) for individual quarries in the basic input file, it is possible to calculate fi and compare it with the value of the optimum threshold point, C. By this method, it is possible to classify a specific quarry as belonging to either the profitable or the loss-making category. The proportion of correctly classified facilities in the original number of quarries of the specific input file (i.e. 35 quarries in each category) determines the percentage of successful classification. The results of the verification are given in Table III.
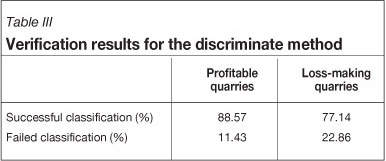
It is obvious from Table III that, in the category of profitable quarries, four operations were classified as loss-making. In the category of the loss-making facilities of the basic input file, eight operations were assessed as profitable. It is important to identify the reasons for these erroneous assessments.
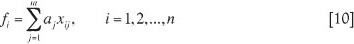
From the mathematical point of view, the optimum threshold point value, C, for the basic input file and the value of the discriminate function for a specific quarry, fi can be calculated as follows:
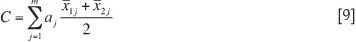
where:
aj is the discriminate function coefficients for specific parameters (discriminators)
xij is the specific parameter (discriminator) value for an individual quarry
 is the average parameter (discriminator) value in the category of profitable quarries
 is the average parameter (discriminator) value in the category of loss-making quarries.
Classifying an individual quarry, if:
fi>C then the quarry is classified as profitable,
fi<C then the quarry is classified among the loss-making facilities.
From the above, it follows that the difference between the values fi and C is influenced by the difference between arithmetic averages of the same parameter (discriminator) and the value for the individual quarry. Multiplying the difference by the discriminate function coefficient, we can establish the value of the difference for individual parameters. As such, it is possible to identify the parameter that most negatively influenced the classification, to the point where a profitable facility was erroneously assessed as a loss-making one. Concerning the category of the loss-making facilities, it is possible to identify the most positive influencing parameter that erroneously placed the loss-making facility among successfully operating quarries.
This method was applied to four profitable quarries that were erroneously classified as loss-making ones and to eight loss-making facilities that were falsely assessed as profitable. If we consider causes of erroneous classification of profit-and loss-making quarries, the major factor of influence were earnings per ton of aggregates, which means that
Discussion
A mining facility's economic performance is influenced by many circumstances, including natural conditions, equipment, and level of technology, as well as organizational factors and management style. Our effort to classify mining facilities is limited by access to data that would assist the purpose.
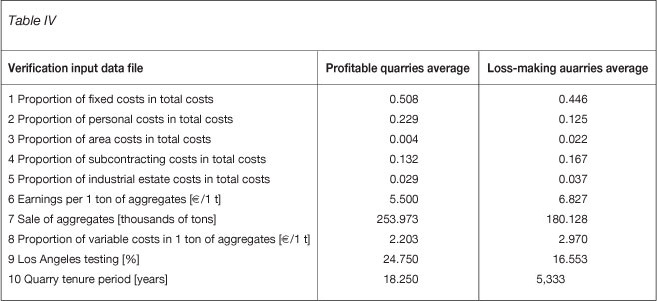
The first step of applicability of the proposed method of classification is to verify its success as regards the initial file of input data. The second step is to verify the method using data from other mining facilities. Several quarries owned by the same company, which had not been part of the input data file, were used for this verification. The verification data file consisted of seven quarries. Four of these were successful in 2010; three operated at a loss. The discriminator average values of the verification data file are given in Table IV.
The discriminate function coefficients in Table II and the discriminator values of the individual quarries were used for the calculation of the discriminator function value. This value was compared with the value of the optimum threshold point, and the quarries were classified either as profitable or loss-making. All these quarries were owned by the same company that owned the 70 quarries of the input data file, which meant that their economic results were known. As regards the verification file for the seven quarries, five of them were successfully classified, which represents success of 71.43 per cent. The same method as for the input data file was applied to identify reasons for erroneous classification in the verification file, of which two loss-making facilities were qualified as profitable. It was established that the most influential factors were a high value of earnings per ton of aggregate and a low proportion of fixed costs. Nevertheless, the other factors also contributed to the loss.
The application of discriminate analysis for classifying potential acquisitions entails a problem. From the point of view of the discriminator, quarry tenure period, the value would be zero. Nevertheless, the experience of analysing the operations of a single company shows that the quarry must go through a process of some restructuring for about 2-3 years. In such a case, the discriminator values can be estimated on a level that would correspond to an ownership of at least 2 years.
Conclusion
By their nature, decision-making processes are subjective. If these processes are assisted by quantifiable procedures, decision-making accuracy may improve. For that very reason, the method of discriminate analysis was applied for the prediction of the quarries' future economic performance.
It can be assumed that the method can be of advantage where decision on new acquisitions or development of individual mining facilities is concerned. Nevertheless there is scope for further improvements to this method.
Reference
Meloun, M. and Militký, J. Statistická Analýza Experimentálních Dat (Statistical Analysis of Experimental Data). Praha, Academia, 2004. pp. 387-405. [ Links ]
* For the purpose of this paper, it is unnecessay to reveal the real identity of this company operative economic result is the same in all the countries concerned. The Euro currency unit has been used for the calculations throughout.

