


Servicios Personalizados
Articulo
 Inglés (pdf)
 Articulo en XML
 Referencias del artículo
Indicadores

Links relacionados
-
 Citado por Google
 -
 Similares en Google
Compartir

 Permalink
Journal of the Southern African Institute of Mining and Metallurgy
versión On-line ISSN 2411-9717
versión impresa ISSN 2225-6253
J. S. Afr. Inst. Min. Metall. vol.112 no.3 Johannesburg mar. 2012
JOURNAL PAPERS
A practical application of geostatistical methods to quality and mineral reserve modelling of cement raw materials
T.Y. Yunsel
Department of Mining Engineering, Cukurova University, Balcali, Adana, Turkey
SYNOPSIS
Estimation techniques such as polygonal, triangular prism, trapezoid, isopach maps, and inverse distance methods are often used in ore or industrial minerals deposit evaluation. These techniques do not express the variability of the deposit and do not allow a determination of the reliability of the estimates. However, geostatistical methods can express a measure of the error associated with the estimates, by finding weighting coefficients for a given mining block, and can also help with data configuration that minimizes the error. This work addresses an application study on the quality and reserve characteristics of the cement raw materials of the Adana Cement Factory in Adana, Turkey, based on the spatial distribution and variability of the chemical components (SiO2, CaO, Al2O3, Fe2O3). The study has been carried out using a geostatistical procedure that is useful for site assessment, characterization, and monitoring situations where data are collected spatially. Directional and omnidirectional experimental variograms of the cement raw material variables showed that neither strong geometric nor severe zonal anisotropy exists in the data. The most evident spatial dependence structure expressing the continuity for omnidirectional experimental variograms were characterized by exponential and spherical variogram models. These models have been used in cross-validation analysis, which proved that these models, their parameters, and kriging parameters are applicable for the study area. Quality contour maps of the deposits at given levels underground were estimated using a kriging interpolation technique. Anomalies such as bullseyes and drift were not observed in the maps that were generated. Kriged maps showed the spatial distribution of quality continuity and variability of the deposits. Grade-tonnage curves and total tonnage estimates in the particular grade were determined using ordinary kriging in order to improve the mining operation and planning. Consequently, local uncertainty and the probability of extreme values occurring are tools of prime importance for the mine planning, the optimum mix of raw materials coming from different quarry stopes.
Keywords: cement raw materials, geostatistics, variogram, quality and reserve estimation, kriging.
Introduction
The economic evaluation of natural resources depends on the accuracy of reserve estimates. Such estimates are necessary in making decisions about opening new mines or in planning future investment for operating mines or industrial deposits. Resource estimation and grade control establish a basis for successful mining operations. Both the overestimation and underestimation of mineral reserves can have severe consequences for future mine planning. Underestimation may result in a potentially feasible operation being disposed of when it actually represents a potentially profitable mine. The more likely consequence is an underdesigned plant. Overestimation may lead to construction of a mine where no profitable orebody exists. More commonly, it will result in the lifespan of the mine operation being shorter than anticipated.
Generally, reserves are estimated by the traditional methods such as polygon, triangular prism, trapezoid, isopach maps, and geological section. These techniques do not allow for a determination of the reliability of the estimate. The estimation error may be high and the actual mean value cannot be determined. Geostatistical techniques do not only provide estimations for any point, but also make it possible to find weighting coefficients for a given mining block and also data configurations that minimize the error or obtain the associated variance.
The application of geostatistics in mining dates back to the late 1970s (Krige, 1951; David, 1977; Journel and Huijbregts, 1978; Clark, 1979). Geostatistics was applied primarily in the mining industry and then developed in the areas of environmental problems and oil reservoir modelling (David, 1988; Isaaks and Srivastava, 1989; Clark and Harper, 2000). A few studies have been found relating to the application of geostatistics to cement raw material deposits (e.g. Almedia et al., 2004; Marcotte et al, 2005).
Geostatistical analysis provides a powerful tool for enhancing the prediction and decisionmaking capabilities of planners and engineers in the cement raw materials industry. Geostatistical methods are useful for site assessment, characterization, and monitoring situations where data is collected spatially. The approach preferred in a geostatistical study is to apply an iterative three-step approach involving:
Exploratory data analysis
There are several types of variogram models. However, in this study, Gaussian, spherical, and exponential variogram models were used due to the appropriate fitting of the data to these models.
This paper is a case study and aims to assess the spatial structure of the distributions of quality and reserve information for cement raw materials. The geostatistical results are determined from variograms and ordinary kriging using core samples from drillholes. The qualities and reserve estimation were carried out for a successful raw materials operation and production planning. Kriging contour maps and a three-dimensional estimation of the study area were constructed for future planning.
The study area
The study area is located 10 km southeast of Adana County and 1 km south of the E-90 motorway in Turkey (Figure 1). The study area belongs to Adana Cement Industry, which is the first and biggest cement factory in Turkey. The factory uses 4 Mt of cement raw materials, and produces approximately 2.5 Mt of cement, per year. The factory has the capacity to produce 3.5 Mt of cement annually. The Adana cement industry has 65 kt stock capacity of preblending, four raw crushers, four raw mills, four rotary kilns, five cement mills, and six packing-weighing machines. Different types of cement (e.g. Portland, composite, white Portland, sulphate-resistant, blended, tras, blast furnace slag, Portland composite, and pozzolanic cement) are produced. Approximately 25% of the cement produced is exported to European and Middle Eastern countries.

Geology in the area of interest consists of limestone, clayey limestone, marl, and , which were formed during the Upper Miocene. These rocks are thought, on the basis of their lithology and texture, to have been deposited in a shelf environment. Clayey limestone is widespread and the dominant material in the area. Its thickness is very variable, and it gradually passes into other lithologies. The rock is very fine-grained and is composed of microcrystalline calcite, clay minerals and microcrystalline quartz, and fossil fragments make up the remainder of the rock. Limestone with an mixture of silica, clay substance, and iron oxide is called marl. Geologically, marls are generated by the simultaneous sedimentation of calcium carbonate and clay minerals. Marls are an excellent raw material for cement production, because they contain the lime and the clay component in an already homogenized condition, are easy to operate, crush, mill, and burn for the cement process. Marls appear different in colour, mainly yellow-green and blue-grey-black. There is little difference in terms of chemical content for the different coloured marls. The rocks in the north of the study area have a high silica content, whereas the marls in the south of the study area are high in carbonate. The rock contains a considerable amount of fossil fragments. Sandstone is fine-grained, fossilferous, dispersive, and varies in thicknesses. The rock consists of 20-30% free silica (quartz), 25-30% calcite, and 5% fossil fragments. The surface of the cement raw materials in the area is covered by caliche, which is 1-2 m in thickness and Quaternary in geologic age. This rock is classified as secondary limestone, and is widespread in the region. It is formed by evaporation in dry climatic conditions.
Open pit mining is employed for the production. The produced material is transported by lorries to the factory. The study area is approximately 500 000 m2 in extent.
The data
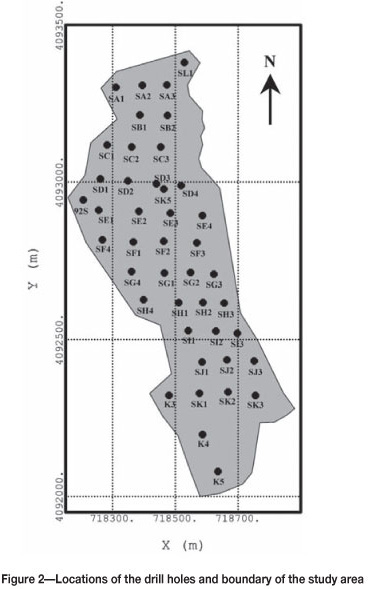
The data consisted of core samples obtained from 43 drillholes, the locations of which are shown in Figure 2. A grid design was applied for the drillhole locations. The distance between the collar locations was approximately 80-100 m and the average depth of the holes 20 m, on the basis of the topographical and geological conditions of the area. All holes were drilled to 40 m altitudes above sea level, because of problems with ground water which is costly to drain. Approximately 900 m of drilling was completed. The borehole intersections were logged. These logs include the thickness of the intersection, chemical contents and geological description of the raw materials, and depth and coordinates of the drill hole. Core samples were taken from each of the different geological formations. A total of 220 representative core samples were collected.
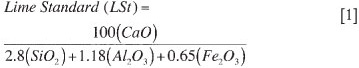
The samples were analysed in order to determine the concentrations of CaO, SiO2, Al2O3, Fe2O3, MgO, Na2O, K2O, and loss on ignition (LOI). The raw material quality depends on these compounds (especially CaO, SiO2, Al2O3, and Fe2O3). Distribution of the compounds varies greatly according to sampling location in the study area. A set of parameters is currently used in cement manufacturing to characterize the quality of the raw material and to ensure the quality of the produced cement. Most of cement industries in the world uses quality parameters such as the LSt-lime standard, SiM-silica modulus and AlM-alumunium modulus.
The LSt represents the relationship between the amount of calcium in the cement and the maximum amount theoretically possible for combining with other elements. It has a major influence in the manufacturing process and on the quality of the final product. If there is an excess of uncombined lime (existing as free lime) in the cement, it may cause damage in mortar or concrete as a result of expansion. The lime standard provides a criterion for determining the optimum lime content. An LSt value of 100 represents the optimum CaO content.
The equations of the modulus are given as follows, when expressed in weight percentage.
The object of the proportioning formula is to provide a means to calculate the maximum proportion of lime that can be made with the acidic oxides (SiO2, Al2O3, and Fe2O3).
In the study area, carbonate rocks are classified into two categories, either as limestone or as clayey limestone, on the basis of CaO content. If CaO is lower than 45%, the raw material is called clayey limestone; whereas if the CaO content is higher than 45%, then the material is called limestone. However, there are small amounts of clay in the limestone. For example, if the limestone contains 50% CaO, the clay content is only 1-2%. Quality and reserve modelling of limestone and clayey limestone are done separately in this study.
The SiM is the second most important parameter for controlling the final product, and it is calculated through the relationship between the grade of silica and the sum of the alumina and iron grades:
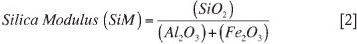
This modulus characterizes the ratio of solid to liquid during clinkering of the material, because at clinkering temperatures the SiO2 is predominantly present in the solid phases, whereas the other two oxides occur in the liquid phase (Duda, 1985). A high SiM has the advantage of producing cement with a high silicates content, consequently with high mechanical resistance. The preferred values range between 2.2 and 2.6.
The AlM represents the relationship between the alumina and iron contents in the raw material:
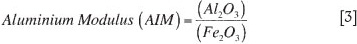
This modulus expresses the composition of the liquid phase in the clinker. If the iron oxide content is higher, the modulus is lower, and the viscosity of the melt decreases (Alsop, 1998). In industrial cements, the optimum values should range between 1.3 and 2.8. However, in special types of cement the value may be much lower.
This modulus is used as a quality or grade criterion for all cement raw materials in the study area in terms of production planning, and mixing and preparing of the raw materials for the clinker and cement production process. The lime standard is considered to be a characteristic quality criteria for limestone and clayey limestone. Marl quality is characterized by both the aluminium and the silica modulus (AlM, SiM). Also, sandstone having high SiO2 content is not required as a cement raw material in cement manufacturing. Raw materials from the marl and limestone quarries are combined to obtain optimal mixtures, with additives if necessary so that the final product presents quality parameters within adequate ranges.
Results and discussion
Two commercial software packages (Isatis and Surfer) were used for the data assessment and interpolation of the quality (grade) and mineral reserve characteristics of the cement raw materials in the study area. The results from the analyses were included as exploratory data analysis, variogram analyses, cross-validation tests, and the quality mapping and tonnage distributions, and three-dimensional views of the study area.
Exploratory data analysis
Regularization of the sample lengths is an essential phase of a geostatistical study using 3D data, especially in the mining industry, although the principle is much more general. Regularization is a well-known method to obtain composites of the same size from an irregular line sampling (compositing). The algorithm used in the regularization process is a 'weighted average' of the original properties, the weights being the length of the analysed 'cores' that fall inside the new regularized composites. The data is regularized into 2.5 m composites. This composite length was chosen by taking into consideration the minimum and maximum thicknesses of the formations. The summation of grade times length and length values were the same before and after compositing. Both data and composites were unbiased, because the average grades of all composites were centred on the same mean value. All geostatistical analyses were carried out on the composite data.
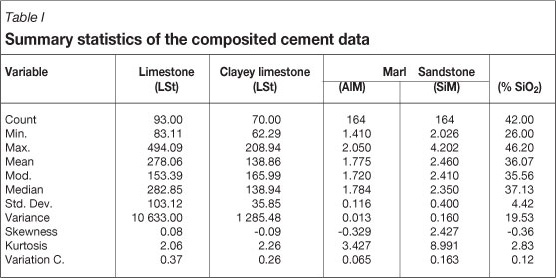
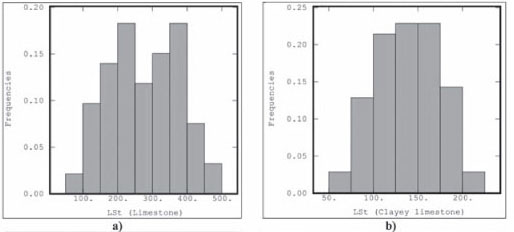
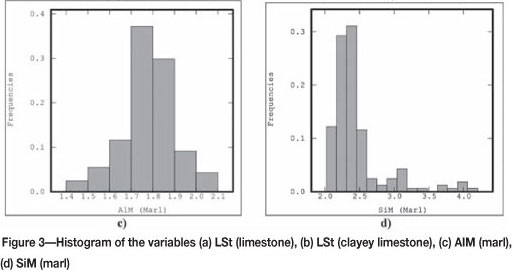
The summary statistics of the composite data are shown in Table I. It is important to check the effect of the regularization on the statistics for each variable. We have seen that the mean remain unchanged, but the variance decrease. From Table I, it can be seen that the values of the central tendency measurement for LSt (limestone and clayey limestone), AlM (marl), and sandstone are very close to each other. This also indicates that these modulus or materials are normally distributed. The histograms of the variables, except for sandstone, are presented in Figure 3. The histograms show that the variables approximately a Gaussian distribution except for SiM (marl) (Figure 3d). The histogram of the SiM (marl) is skewed to the right, showing a departure from the symmetrical shape of the normal distribution. The coefficients of skewness and kurtosis for SiM (marl) are high in comparison to the coefficients of the normal distributios. Although it is not a mandatory, it is expected that a variable is normally distributed for the Kriging technique. Thus, a 'normal score' transformation is applied to the SiM(marl). Consequently, the data distributions provide that statistical assumptions for the geostatistical analysis are obtained. The next stage is the variogram analysis.
Variogram analysis
The variogram is used in various procedures during mineral resource and mineral reserve evaluation to quantify the geological factors that affect the accuracy of estimates. The variogram is a critical input to geostatistical studies: firstly, it is a tool to investigate and quantify the spatial variability of the phenomenon being studied, and secondly, the geosta-tistical estimation or simulation algorithms require an analytical variogram model that will reproduce the statistical properties of the variable depending on direction and distance.
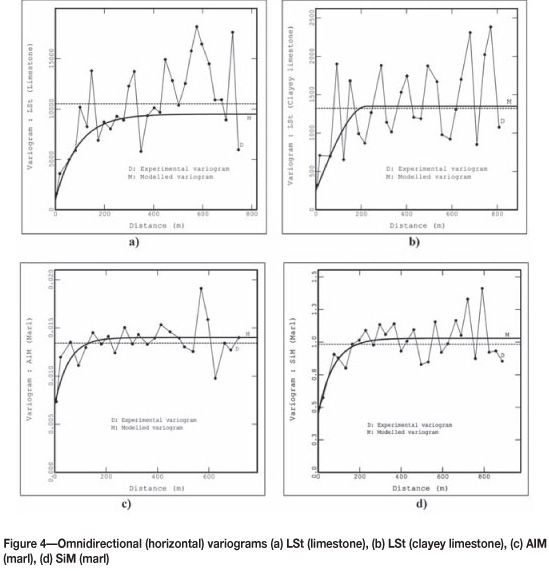
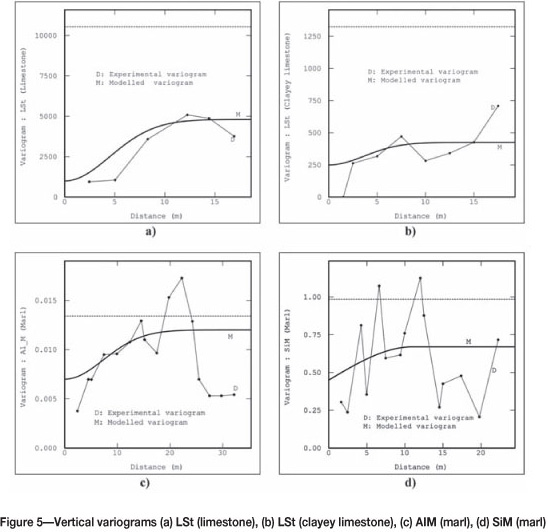
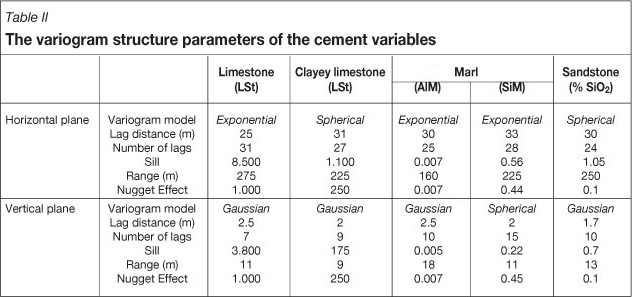
The semivariogram analyses have been carried out in both the horizontal and vertical planes on the data observed. Both directional (for the directions of 0°, 45°, 90°, 13° respectively) and omnidirectional experimental semi-variograms for LSt (limestone, clayey limestone), AlM (Marl), SiM (Marl) and SiO2% (sandstone) were performed separately. Omnidirectional horizontal and vertical variograms of the variables, except for SiO2 (sandstone), are shown in Figure 4 and Figure 5 respectively. Directional experimental semivariogram graphs of the raw material variables show neither severe geometric nor strong zonal anisotropy. The horizontal and related vertical variograms could not be shown in the same figures because of different range values of the planes (about 20 m and 1 200 m in the vertical and horizontal planes respectively), which degrade the clarity of parameters on the graph. It should be noted that horizontal and vertical variogram graphs of sandstone (% SiO2) are not presented here, but they were calculated and evaluated as part of the study. The parameters of both the horizontal and vertical variogram structures are given in Table II. In the variogram graphs, the jagged continuous lines and bold continuous lines represents the experimental and modelled variograms respectively. Visual examination of the experimental variograms suggested that the modelled spherical, exponential, and Gaussian models are reasonably in agreement with the data. The horizontal variogram graphs exhibit clear spatial structures. It is important to highlight that the sill values of the theoretical models of each variable were found close to the variance of the variables (Table I and 2, Figure 4). The ranges were 275 m, 225 m, 160 m, 225 m, and 250 m for LSt (limestone, clayey limestone), AlM (Marl), SiM (Marl) and sandstone (% SiO2) respectively (Table II). On the other hand, the vertical variograms did not show a clear structure relatively to the horizontal plane, although both plane variograms share the same nugget effect. This implies that there is no important spatial variation in the vertical plane in contrast to the horizontal plane. The maximum distance between two samples in the study area is about 1 300 m. Approximately half of the maximum distance between two samples is considered appropriate for variogram analysis in practise. Thus, a distance about 650-800 m is considered to be optimum for the variogram analyses on the study area in the horizontal plane, and 20-25 m in the vertical plane (Figure 4). Consequently, the variogram analysis findings showed that the sampling layout is effective in that the distance between samples is large enough to determine the spatial structure.
Kriging implementation
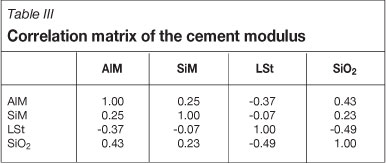
There are several forms of kriging including ordinary, universal, lognormal, outlier restricted, indicator, probability, multi-Gaussian, and disjunctive. Ordinary kriging is a method that calculates point or block values directly from the semi-variogram (or covariogram) relationship without having to provide additional qualifying data or modification of the sample data or kriging results. Several authors (Fytas et al., 1990; Dominy et al., 1997 and Roy et al., 2004) have stated that for grade distributions with a coefficient of variation of less than about 1.5, meaningful semivariograms can be produced. Fytas et al. (1990) explained that parametric geostatistics like ordinary kriging works well in deposits with a coefficient of variation of around one or less. Coefficients of variation of all the variables for the study area are below 0.4 (Table I). Ordinary kriging was chosen as the estimation method to evaluate in this study. The correlation matrix of the cement modulus is given in Table III. The table shows that there is no correlation amongst the modulus. Therefore, co-kriging was not applied to estimate grade and reserves of the cement raw materials.
Cross-validation tests
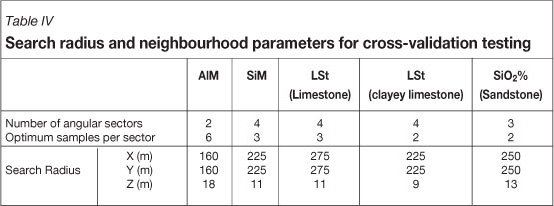
Cross-validation is a procedure that checks the compatibility between a set of data and a structural model. This procedure considers each data point in turn, removing it temporarily from the data set, and using its neighbouring information to predict (through a kriging procedure) the value of the variable at its location and using the model previously fitted. The estimation result is compared to the actual value to produce the estimation error, standardized by the standard deviation of estimation. Another essential parameter of this process is the neighbourhood concept, which tells the system which data points, located close enough to the target will be used in the estimation. In this case study, because of the small number of points, we use the unique neighbourhood, which means that all information will be systematically used for the estimation of any target point in the field. In the case of cross-validation, each data point is estimated from neighbouring data. Rotation angles were not used for anisotropy as this was not present in the variogram models. The search geometry was an ellipsoid. The ellipsoid is unique in the horizontal plane and different in the vertical plane. Four kriging sectors for clayey limestone, marl, and sandstone, and two sectors for limestone, were chosen respectively. The number of sectors, optimum sample points used in the sectors, and the range of the variables were individually adjusted on the basis of the best cross-validation results. Related neighbouring and search radius parameters are shown in Table IV.
The procedure followed by Isatis (Geovariances, 2006) is cross-validation performed to cross-check the models and the data. The mean of the standardized squared error (MSSE) and mean error (ME) of the exponential and spherical models produced the most favourable results, indicating that the search strategy, neighbourhood parameters, model, and model parameters etc. used in the estimation were appropriate. Furthermore, the ME of the exponential and spherical models proved that the unbiasedness condition of the kriging algorithm worked properly. Therefore, the exponential, spherical and Gaussian models were chosen to calculate the variables for the cement raw materials.
Cross-validation of the model is shown in Figure 6 for the variable LSt (limestone). Cross-validation graphs of the other variables are not presented here, as the results for these variables showed the same behaviour as those for LSt (limestone).
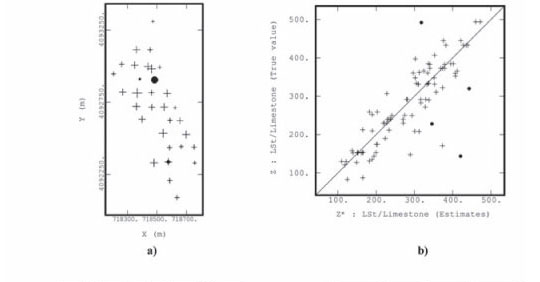
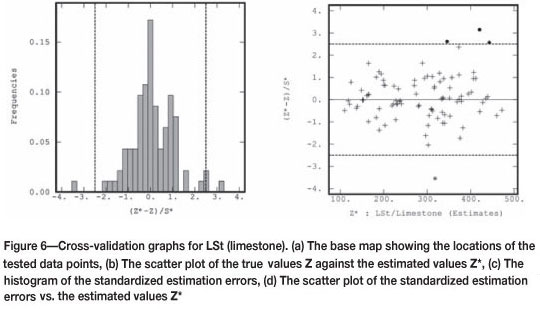
Cross-validation tests were carried out as a 95% confidence interval. Dashed lines (Figure 6c, 6d) delineate the outliers from the valid points. The pluses (Figure 6d) indicate that the data is included into the 95% quantile of a normal distribution, that is, to the samples lying inside the 95% confidence limit of a normal distribution. It is likely that the points outside the confidence limits imply that the data is over/underestimated outliers resulting from estimation error.
A sample is considered as an outlier when its standardized estimation error (SEE) is larger than a given threshold in absolute value (Geovariances, 2006). Outliers are depicted on the base map (Figure 6a). A scatter diagram of the observed data versus estimated value is shown in Figure 6b, the histogram of the SEE is shown Figure 6c, and a scatter diagram of the estimated value versus the SEE is shown in Figure 6d. Outliers of the variables did not follow any particular pattern, as is shown in Figure 6a-d.
Scatter plots of observed data versus estimated values with conditional expectation curves (the 45° diagonal line) in Figures 6b show a slight conditional bias. This indicates that true and estimated values do not match exactly. Cross-validation graphs of estimated values versus SEE showed that the errors in estimation are within acceptable limits, excluding the outliers (Figure 6d). Histograms of SEE for all the variables (Figure 6c) were in good agreement with the findings of the cross-validation analyses mentioned above.
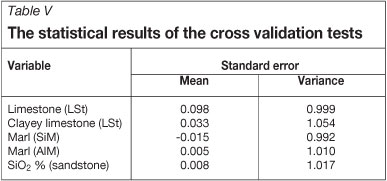
The tabulated statistical results of the cross-validation on the estimation error and standardized error (mean and variance) are presented in Table V. Each model satisfies the global unbiased condition reasonably, where distributions of errors are centred on a zero mean. The spread of the errors and the correlation coefficient of the known values against the kriged estimates were used to determine an adequate search strategy. On this basis, a search radius and the use of the nearest points for each variable were selected as an optimal model. In theory, it is expected that the mean error and the variance of the estimation are equal to 0 and 1 respectively. The mean error proves that the unbiased condition of the kriging algorithm worked efficiently. The variance of the estimation standardized error measures the ratio between the experimental estimation error and the kriging variance. Consequently, the cross-results showed that the estimation is reasonably acceptable (Table V).
Grade (quality) and mineral reserve estimation
The objective of geostatistical estimation for an industrial deposit evaluation is to provide a continuous representation of grade variation that accounts for structural, lithological, and mineralogical discontinuities.
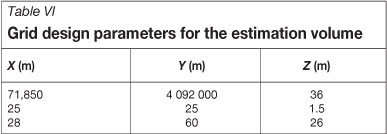
At this stage, a grid design was applied over the study area (Table VI). The neighbourhood and variogram parameters were used for the estimation. The grade-tonnage curves and tonnage estimations were carried out using the ordinary block kriging method. Co-kriging is another interpolation technique that allows one to better estimate map values by kriging with auxiliary data. Co-kriging requires much more for estimation, including estimating the autocorrelation for each variable as well as all cross-correlations. Through the interpretation of the correlation matrix of the variables at the same points, there is no correlation among the variables (Table III). For this reason, multivariate techniques were not performed for the estimation process.
The ordinary block kriging method has mostly been applied to sedimentary deposits such as coal and industrial raw mineral deposits.
The total tonnage above cut-off grade is calculated using the following equation:

where
∑Ti = Total tonnage of 1 block in percentage
Vb = Volume in m3 of 1 block
d = Density (t/ m3).
Mean grade above cut-off is calculated using the following equation:
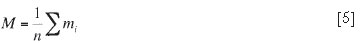
where
mi = Mean grade unit
n = Number of samples above cut-off.
Bulk densities of the cement raw materials were determined from core samples. The mineral reserve estimate of the raw materials was made within the polygon boundary (Figure 2).
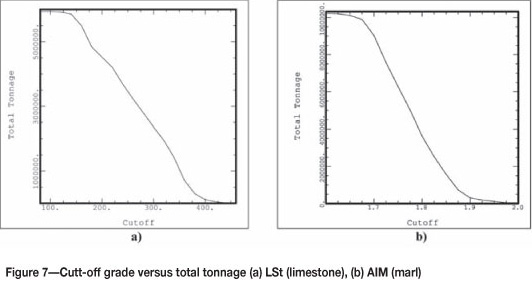
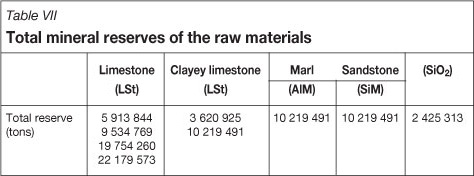
As mentioned previously, LSt for limestone > 45 % CaO, clayey limestone < 45 % CaO, AlM and SiM for marl, and SiO2% for sandstone have been used as the quality (grade) criteria. The cut-off grade for cement raw materials is determined as a minimum value of the cement modulus (such as LSt, AlM, SiM, and SiO2 content of sandstone). Sometimes, minimum values of the modulus are required, because of proportional mixing of the raw material. Figure 7 shows the cut-off grade or quality of the cement raw materials versus the tonnage for LSt and AlM (marl). From the figures, raw material tonnage in a given quality value or in particular quality intervals can be easily seen. The total mineral reserves of the raw materials are given in Table VII. Consequently, these results can form the basis of production design and future planning of raw materials, clinker and cement production.
Quality mapping
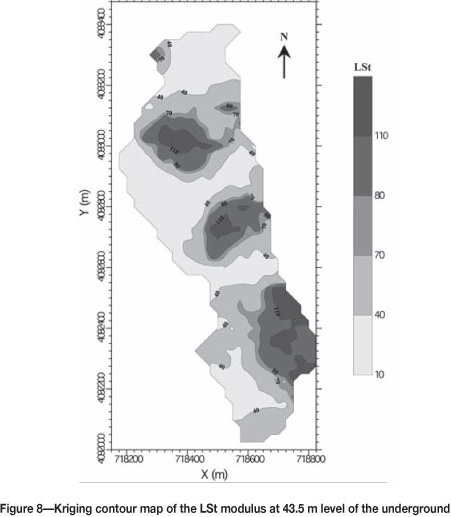
The procedure of evaluating normal distributions of data, variogram analysis, and cross-validation tests was carried out prior to constructing a contour map of the cement modulus. The distribution of the modulus in all geological formations of the area was considered in quality mapping. The values at the 43 680 grid nodes of each quality modulus were estimated by ordinary block kriging using the exponential, spherical variogram, and Gaussian models of the modulus. Greyscale maps were produced by using gridded data to determine quality distribution and variability of the cement modulus in all the raw materials in the study area. It should be noted that a map of each quality modulus was plotted at specific levels in the ground (at 40.5 m, 43.5 m, 46.5 m, 49.5 m, 52.5 m, 55.5 m, and 58.5 m). The maps at these specific levels are not illustrated here, and only the contour map of the LSt modulus at the 43.5 m level is shown in Figure 8. Interpretation of the maps is relatively simple and practical. These maps assist the operational and production management of the raw materials, and in identifying mix and the proportions of the materials for the cement manufacturing process.
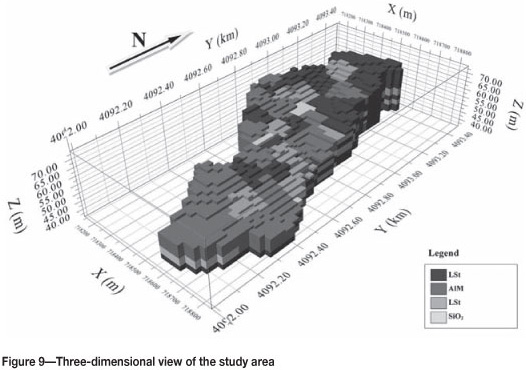
A three-dimensional (3D) perspective view for the study area is shown in Figure 9. This figure shows the distribution of the main variables in the area. When preparing this diagram, each estimated cell was designated with different colours according to the presence of each related variable, resulting in a four-colour 3D view of the study area was obtained. The vertical plane scaling has been exaggerated to show the variable locations in the deposit. This solid model enables an operational design and future production planning of the deposit (such as monthly or yearly production).
Conclusions
The following conclusions can be drawn from this case study.
References
Almedia, J., Rocha, M., and Teixeira, A. 2004, Spatial Characterization of Limestone and Marl Quality in a Quarry for Cement Manufacturing, vol. 1, Leuangthong, O. and Deutsch, C.V. (eds.). Springer. Geostatistics Banff, 2004. [ Links ]
Alsop, P.A. 1998. Cement Plant Operations Handbook for Dry Process Plants. 2nd edn., Tradeship Publications Ltd. [ Links ]
Clark, I. and Harper, W.V. 2000. Practical Geostatistics 2000. Greyden Press, Columbus. [ Links ]
Clark, I. 1979. Practical Geostatistics. Elsevier Science Publications, London. 1979. [ Links ]
David, M. 1997. Geostatistical Ore Reserve Estimation, Elsevier Scientific Publishing, Amsterdam. [ Links ]
David, M. 1988. Handbook of Applied Advanced Geostatistical Ore Reserve Estimation. Elsevier Science Publishing, Amsterdam. [ Links ]
Dominy, S.C., Annels, A.E., Camm, G.S., Wheeler, P., and Barr, S.P. 1997. Geology in the resource and reserve estimation of narrow vein deposits. Exploration and Mining Geology, vol. 6. pp. 317-333. [ Links ]
Duda, W.H. 1985. Cement Data Book: International Process Engineering in the Cement Industry, vol.1, 3rd edn., Bauverlag GMBH. [ Links ]
Fytas, K., Chaoval, N., and Lavigne, M. 1990. Gold deposit estimation using indicator Kriging. CIM Bulletin, vol. 934. pp. 77-83. [ Links ]
Geovariances. 2006. Isatis Software Manual, France. [ Links ]
Isaaks, E.H. and Srivastava, R.M. 1989. An Introduction to Applied Geostatistics. Oxford university Press, New York. [ Links ]
Journel, A.G. and Huijbregts, Ch.J. 1978. Mining Geostatistics. Academic Press, London. [ Links ]
Krige, D.G. 1951. A Statistical Approach to Some Basic Mine Valuation Problems on the Witwatersrand. Journal of the Chemical, Metallurgical and Mining Society of South Africa, vol. 52, no. 6. pp. 119-139. [ Links ]
Marcotte, D., Naraghi, K., Bellehumeur, C., and Gloaguen, E. 2005. An application of multivariate simulation in the cement industry. Mathematical Geology, vol. 37, no. 55. pp. 493-512. [ Links ]
Roy, D., Butt, S.D., and Frempong, P.K. 2004. Geostatistical Resource Estimation for the Poura Narrow-vein Gold Deposit. CIM bulletin, vol. 97, no. 1077. pp. 44-51. [ Links ]

