


Services on Demand
Article
 English (pdf)
 Article in xml format
 Article references
Indicators

Related links
-
 Cited by Google
 -
 Similars in Google
Share

 Permalink
Journal of the Southern African Institute of Mining and Metallurgy
On-line version ISSN 2411-9717
Print version ISSN 2225-6253
J. S. Afr. Inst. Min. Metall. vol.112 n.3 Johannesburg Mar. 2012
JOURNAL PAPERS
Performance improvements provided by Mintek's FloatStar™ advanced control system on reverse flotation of iron ore
B.D.H. KnightsI; J.C. SatyroII; R.A. DiasII; A.C. de Araújo FreitasIII
IMintek, Measurement and Control Division, South Africa
IIVale Caue, Brazil
IIITecnologia de Sistemas de Automafizo, Brazil
SYNOPSIS
In November 2009 Mintek installed the FloatStar™ advanced flotation stabilization system on Vale's Cauê iron ore beneficiation plant in Brazil. In September 2010 the system was upgraded to include flotation optimization.
The circuit consisted of two parallel cleaner circuits producing final concentrate. The tailings from the cleaner section passed through a scavenger circuit. Large, well-instrumented feed sumps played an important role in circuit stability, presenting a good opportunity for advanced control. Previously the plant was controlled using distributed control system (DCS) level control only. The flotation circuit processes roughly 30kt/day.
The FloatStar system provided advanced control of the flotation circuit as well as of the sumps feeding the circuit. The system underwent a lengthy trial to assess the benefit that it provided. Two data sets were analysed, showing performance under advanced stabilization and optimization respectively. Several validation and consistency criteria were employed to ensure the quality of the analysis.
Iron recovery and iron tailings grade were used to measure system performance. The analysis showed that the system increased recovery by up to 2.7%. In addition, the system decreased the iron tailings grade by between 1.2% (from 23.5% to 22.3%) and 4.3% (from 31.3% to 27.0%) during different test campaigns.
The analysis also showed that the entire FloatStar stabilization system was active for 72.7% of the time from first activation to the end of the first data set (approximately 200 days).
From the analysis it was concluded that under similar conditions for 'ON' and 'OFF' tests, the system provides a clear benefit. It was also found that over the longer term, the system continues to provide a benefit. This finding suggests that the results were not simply due to a short-term advantage.
The size of the data set, as well as the magnitude of the recovery improvements, lends considerable confidence to these results. Therefore, it can be concluded that the FloatStar control system provides substantial benefit to operations at this site.
Keywords: iron ore, reverse flotation, advanced process control, FloatStar.
Introduction
As minerals processing operations are forced to process increasingly difficult and complex ores and the margin of profitability becomes smaller, it becomes necessary to operate ever closer to operational constraints. By providing stability and consistency, advanced process control allows plants to operate under these tighter tolerances.
Mintek's stabilization and optimization systems have been installed worldwide on flotation circuits, milling circuits1, leaching circuits, and furnaces. The FloatStar™ level stabilizer has repeatedly been shown to provide considerable benefit to flotation circuits, through the increased stability that it provides2-4. However, to date this system has been installed only on 'direct' flotation circuits.
In 2009 Mintek was given the opportunity to test the FloatStar system on Vale's Cauê iron ore beneficiation plant in Brazil. This would be the first FloatStar system installation on a reverse flotation circuit. In November that year the stabilization system was installed. In September 2010 the system was upgraded to include higher-level control of circuit mass pull as well as other stabilization upgrades.
This paper describes the system installed, its scope of influence, and the results achieved.
Circuit description
Flotation forms only part of the Cauê circuit, which includes magnetic separation, cyclone separation, thickening, dense media separation, and high-frequency pellet feed screening.
The feed is from an open-pit mine, which undergoes crushing but does not pass through a milling (grinding) stage. Several stages of cyclone separation ensure a feed size distribution of under 150 µxim Feed grade (%Fe) is in the order of 61%. Product quality is rated according to the level of silica contamination in the concentrate. The targeted product range is 0.8 to 1.5% silica, although the product is usable with a silica grade of up to 3%. The tailings grade target is a maximum of 30% Fe with a metallurgical recovery of 92.75% and a mass recovery of 86.5%.
Flotation occurs in two parallel trains of cleaners and two sets of scavengers in a serial arrangement. The conventional role of roughers is achieved through the preceding magnetic separation process. Since the process uses reverse flotation, the flotation froth stream forms the tailings and the underflow is the concentrate. This terminology is used throughout this paper.
The concentrate from the flotation scavengers is separated by high-frequency screening followed by a cyclone. The screen oversize is sent to final tailings (residue), the cyclone overflow is fed back to the flotation feed, and the cyclone underflow is upgraded through a third cleaner section. Flotation cleaner trains 1 and 2 are each fed between 500 and 700 t/h, with a total feed of up to 1400t/h.
The aim of the reverse flotation is primarily to remove the siliceous gangue. An extremely high final mineral grade is required while maintaining an acceptable recovery.
The final product is passed either to a sintering plant or a pelletization plant, depending on the granularity.
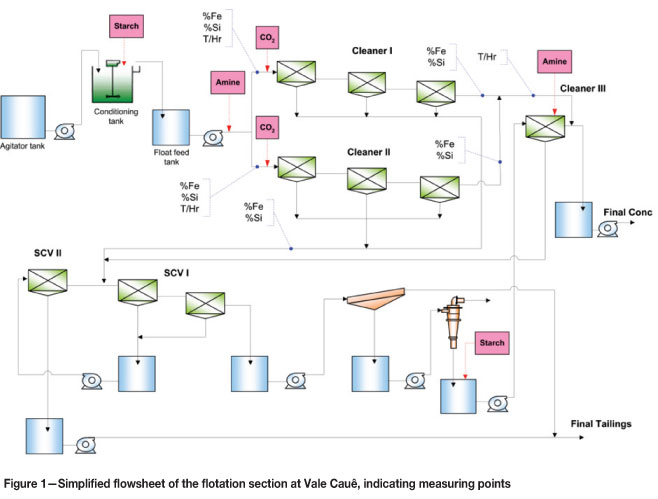
With reference to Figure 1 the flotation circuit feed is first conditioned in a large conditioning tank. From there it flows to an overflow conditioning tank and then to the circuit feed tank. The conditioning tank has considerable surge capacity; however, the feed tanks thereafter are much smaller. The feed tanks were easily overwhelmed by a high outflow from the conditioning tanks.
The flotation circuit consisted of three trains of three cells each, with cleaner 3 functioning as an isolated cell. It is well known that a series of flotation tanks can be difficult to control. However, the short trains at this site made it questionable as to the degree of benefit likely from advanced level control.
Mass pull (to tailings) was highlighted by Vale as being of extreme importance. Mintek has installed concentrate flow and mass pull controllers on a number of sites worldwides. In all these cases the froth flow (mass or volumetric) was controlled. However, at Vale Cauê only the concentrate streams were measured (flotation cell underflow). This flow rate could be influenced only by adjusting the amount of tailings produced, in the form of flotation froth. Again, it was not clear at the start of the project whether this would have a measureable effect on the concentrate flow.
Control system description
Due to this being Mintek's first control system installation on a reverse flotation circuit, as well as the first iron-ore circuit, the initial approach was to investigate any areas where advanced control could provide an improvement. Mintek's StarCS control platform is well suited to customized solutions and provides the commissioner with considerable flexibility in the nature of the solution implemented.
After a short plant audit of instrumentation availability, with the intention being to provide the greatest benefit with the maximum simplicity, it was decided that three control modules would be implemented. The feed to the circuit would be stabilized using advanced sump control. Thereafter the FloatStar Level Stabilizer would stabilize the flotation circuit. Finally the FloatStar Flow Optimizer would perform mass-pull control to stabilize circuit flows.
The installation took place over two visits. Approximately 10 days of commissioning were spent on site during each visit. Mintek was assisted by Tecnologia de Sistemas de Automação (TSA), for technical assistance, overcoming the language barrier as well as general logistics.
The first visit focussed primarily on stabilization of the sumps and the flotation circuit levels. On the second visit the sump controllers were upgraded and the mass-pull controllers were installed.
Sump control system
The conditioning tank was controlled through a cascade system. The slave loop controls flow to a specified setpoint by manipulating the pump speed. The master loop makes use of Mintek's safety loop controller.
In normal control a rate of change of level is calculated. This is controlled sluggishly to be near zero with the intention of simply maintaining a stable sump level. To prevent overflow or running dry, safety controllers are linked to maximum and minimum levels. An additional safety control loop looks at the downstream sump level (feed sump) and ensures it does not exceed a maximum. The conditioning tank outflow is automatically decreased if the feed sump level exceeds the specified maximum.
The feed tank is controlled in a similar fashion, with a rate of change controller and minimum/maximum safety control loops. As with the conditioning tank this is a master loop, providing a flow setpoint to the cascaded slave loop which adjusts the pump speed. An additional feed-forward controller pre-emptively adjusts the pump speed to account for flow differences between the outflow of the conditioning tank and the feed tank.
FloatStar level stabilizer
All 10 flotation cells are included in the advanced stabilization algorithm. Cleaner 1, cleaner 2, and the Scavengers each consist of an interacting train of three cells. The standard multivariable FloatStar algorithm was used on these cells. Cleaner 3 is a single stand-alone cell, which is fed by a variable speed pump. A feed-forward controller was used to attenuate feed fluctuations, with an aggressive proportional integral differential (PID) controller providing level control.
FloatStar flow optimizer
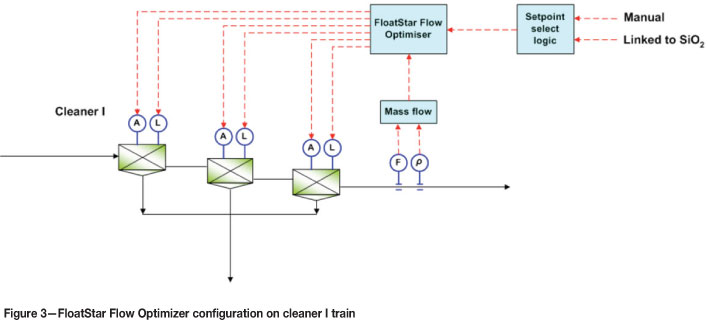
Mass-pull control was installed on the cleaner 1 and 2 trains (Figure 3). This controller adjusted the air-flow and level setpoints, within operator-specified limits, to control the concentrate (product) flow measured on the flotation underflow stream. These variables can be enabled or disabled individually as per process requirements or limitations.
Although it was possible to directly specify the mass-pull setpoint, an intelligent system was implemented to provide suggested setpoints. Several months of data was analysed to determine relationships between mass-pull and other circuit measurements. A strong link was found with the feed silica grade. A simple model was created linking the mass-pull setpoint to the silica feed grade. To provide flexibility, the operator can select 'fast', 'medium', or 'slow' behaviour of the controller to account for particular instances of circuit behaviour. The operator is also able to provide a custom setpoint.
System testing
For the remainder of this paper the notation 'ON' and 'OFF' will be used to relate to the state of the system activation. The 'ON' state shall refer to the Mintek control system being activated. The state described as 'OFF' is normal plant operation using the existing manual operation or automatic controllers that were available prior to the Mintek system being installed.
To determine if the system was able to provide any benefit to Vale, an analysis was conducted which compared the flotation performance with the system 'ON' and 'OFF'. The data included relevant grade measurements, feed tonnage, and reagent dosage. The data was retrieved from Vale's historian from 2009-02-01 to 2010-09-13 (stabilization variables) and 2010-09-01 to 2010-10-21 (optimization variables). Grade measurements were available on a 2-hourly basis, while the rest of the data was at a 15-minute resolution.

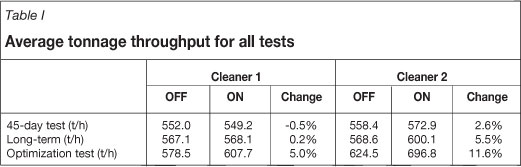
The analysis focussed on the cleaner 1 and 2 trains. Feed and product grade measurements were available for each cleaner train (see Figure 1), although the tailings grade measurement was for the combined tailings stream. A combined feed grade was calculated using a weighted average of each train's grade measurement according to the feed tonnage. A similar weighted average was done with the product grade, also using the feed tonnage. This allowed the overall performance of both trains to be evaluated. It should be noted that both trains are physically identical and received similar feed tonnage (refer to Table I).
The recovery was calculated from the feed, concentrate, and tailings grades, using the two-product formula:
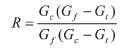
Where Gc is the concentrate grade, Gf the feed grade, and Gt the tailings grade.
Data was considered valid only if the feed tonnage to both cleaner trains was above 100 t/h, and the recovery was between 30% and 100%. These values were selected by plotting a histogram of the relevant data to establish the cutoff point for outlier information. The acceptable data was taken over a very wide band to minimize bias that may be introduced through outlier elimination.
Two analyses of the stabilization performance were done, with the first being a general test over a long period of time. The second analysis was over a shorter period, during which specific 'ON'-'OFF' step tests were conducted. The system was considered 'ON' when all of the FloatStar flotation stabilization loops were activated (excluding the sump controllers). Only when the entire system was deactivated was it considered 'OFF'.
The long-term analysis compared all the data when the advanced stabilization system was active with a similar number of data points from prior to the system installation. Applying the validity criteria resulted in an 'ON' dataset of approximately 19 700 points. Generation of an 'OFF' dataset with a similar number of points resulted in the overall period running from 2009/05/31 until 2010/09/13. The total period represented by the data was approximately 200 days each during 'ON' and 'OFF' periods (400 days in total).
A shorter analysis was done using data directly after the initial system installation. The 'ON'-'OFF' tests were conducted over a period of roughly 45 days from 2009-11-01 to 2009-12-16. The same criteria as the long-term test were used, and approximately 1900 valid points during each period resulted. This is equivalent to 20 days each for 'ON' and 'OFF'.
Finally, a short analysis similar to the stabilization analysis was done on the most recent data set to assess the benefit provided by the optimization system. Shortly after the optimization system was installed, Vale ran another test campaign to collect good comparative data. The system was run through several 'ON'-'OFF' cycles. The initial data analysis revealed that for some of the cycles the system was either not completely activated, or not completely deactivated. To ensure sufficient data for comparison, the 'ON'- 'OFF' criteria were made more lenient. The system was considered 'ON' when half (6) of the optimization variables were activated. It was considered 'OFF' when fewer than 3 variables were in optimization mode.
Note that the FloatStar stabilization system was also deactivated when the optimization loops were 'OFF' during the optimization test campaign. The resultant data set was from 2010-09-28 until 2010-10-21. There were approximately 1000 data points for each 'ON' and 'OFF' set, equivalent to 10.5 days of data under each mode of operation.
Comparison of plant conditions during 'ON' and 'OFF' tests
To ensure a fair analysis, the plant conditions during each 'ON' and 'OFF' period were compared. This was to determine whether changes in performance were due to the control system or simply due to differing operating conditions. The quality of the feed and the product, and the amount of feed processed, were used to compare the plant conditions.
Table I shows that in almost all the tests, both trains processed more feed when the Mintek system was activated. In particular, during the optimization test, both trains were fed considerably more feed when the Mintek control system was activated.
Table II shows the feed and concentrate grades calculated from the separate measurements on Cleaners 1 and 2. In all the tests it can be concluded that very similar feed was provided when the Mintek system was 'ON' and 'OFF'.
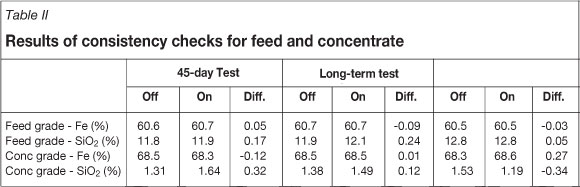
During the 45-day test of the stabilization system, the concentrate produced when the Mintek system was activated had a silica contamination level above the target of 1.5%. In both the other tests the silica level was within the main targeted band (0.8% to 1.5%) when the system was 'ON'.
Assessment of benefit
To assess the benefit provided by the system, both recovery and tailings grade were compared. As described earlier, feed and concentrate grades were calculated as a weighted average of the individual train measurements, according to the feed tonnage to each train. Overall cleaner recovery was then calculated using the two-product formula shown previously.
A comparison of the tailings grade during the 'ON' and 'OFF' operating modes is also provided to confirm the recovery performance.
Figure 4 shows the results of the 45-day test, conducted shortly after the Mintek stabilization system was installed. This clearly shows the increase in recovery and decrease in variability when the system was activated.
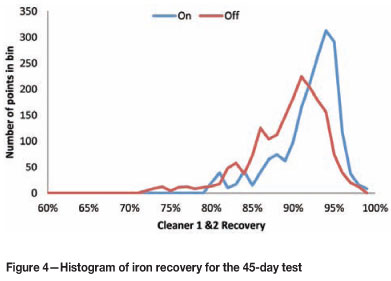
Referring to Figure 5, the tailings grade was also clearly lower when the FloatStar system was 'ON'. This supports the increase in recovery shown in Figure 4.
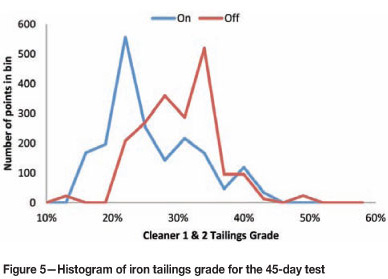
Figure 6 shows the results for the long-term stabilization test. Clearly the recovery of iron was higher when the system was 'ON' than when it was 'OFF'. The 'ON' peak was also sharper than the 'OFF' peak indicating less variation in the recovery.
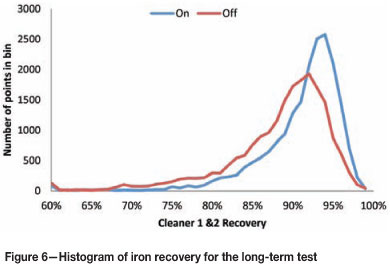
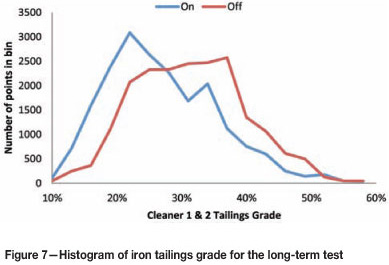
Figure 7 shows that the iron tailings grade was lower when the system was 'ON' than when it was 'OFF'. This confirms the recovery improvement shown in Figure 6.
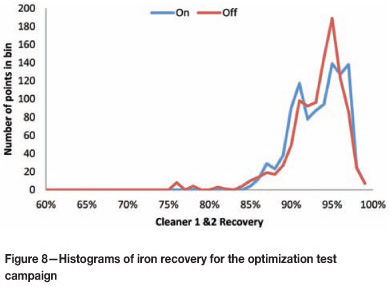
It was difficult to determine from the histograms whether there was an improvement in recovery under optimization mode (Figure 8). The recovery performance under both 'ON' and 'OFF' was similar, although there was a slight overall improvement in recovery when the system was 'ON'. The tailings grade results (not shown) were similarly inconclusive.
The actual improvement values are shown in Table III. These values were validated by conducting a single-sided unpaired t-test. The null hypothesis was that the means were equal. Rejecting the null hypothesis would indicate that the mean recovery when the system was 'ON' is higher than the mean recovery when it was 'OFF'. For both the 45-day test and the long-term test the null hypothesis was rejected at the 95% confidence limit. The null hypothesis for the optimization test was rejected at an 88% confidence limit.
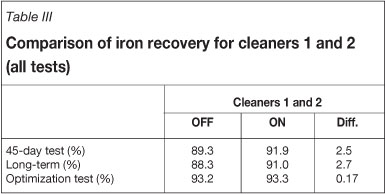
By considering the amount of concentrate produced it is possible to gain further insight into the results achieved. This is shown in Table IV.
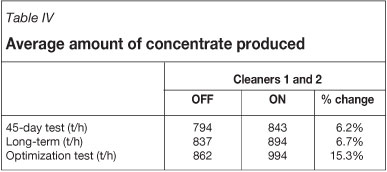
It is interesting to note that in all tests the amount of concentrate produced increased when the Mintek system was 'ON'. Under optimization mode in particular the production rate increased considerably.
Table V shows the combined tailings grade for each of the test campaigns. In all the tests the tailings grade decreased, confirming the recovery improvement.
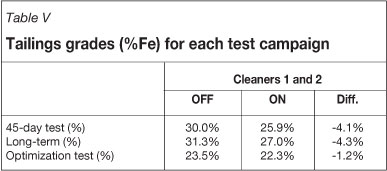
The tables and figures show that the Mintek system provides a clear and quantifiable benefit to Vale Cauê. Although there was only a slight increase in recovery during the optimization test, overall more concentrate was produced and the tailings grade decreased (as shown in Table IV and Table V).
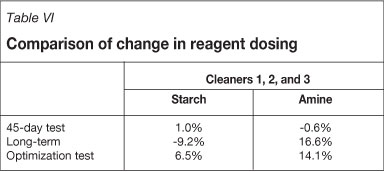
Table VI shows the increase or decrease in reagent dosing for each of the test campaigns. Due to the length of the long-term test (more than one year of data) it was expected that the reagent dosing would change. The dosing increase during the optimization test was also to be expected, given the increase in feed tonnage.
Using only data from the date of first activation to the end of the available data, it was determined that the full flotation stabilization system was active 72.7% of the time.
This analysis considered all datapoints where the feed rate was over 100 t/h, after the first activation date of 2009-1119. The system was considered 'ON' only when the entire flotation circuit controller was activated (excluding sump controllers). Periods where a portion of the system was deactivated (due to plant maintenance or other plant operational issues) were not included, and these will account for a portion of the 'OFF' period.
Discussion of results
Given the amount of data used and the magnitude of the improvement, considerable confidence can be given to the data analysis. Using three different periods of analysis and including the latest modifications to the circuit, a clear benefit was shown whenever the Mintek system was activated. Statistical hypothesis tests confirmed that the recovery improvements were real with a high degree of confidence.
During the 45-day test the recovery improved by 2.5% and the tailings grade was shown to decrease by 4.1%. However, the level of silica contamination in the concentrate increased. The FloatStar stabilization system does not have a direct handle on the product quality, and this result was achieved directly after the system was first installed. It is postulated that during the period in which the operators were gaining familiarity with the system, the quality of the concentrate decreased briefly. The silica contamination was reduced to acceptable levels over the long-term test period (which included the 45-day test period data).
For the long-term test the analysis showed that the FloatStar system was able to provide a clear improvement in recovery of 2.7% averaged over both trains.
The average concentrate production rate further validated the result, since it showed an increase of 6.7% when the system was 'ON'. Although the quality of the concentrate was lower when the system was 'ON', it was within the target band.
The utilization analysis showed good system acceptance, considering that the system was fully active more than 70% of the time.
The optimization test campaign had the least data of all the tests, and the comparison of feed showed that the 'ON' and 'OFF' periods had very different operating regimes. During this test campaign, 5% more feed was processed by cleaner 1, and almost 12% more feed was processed by cleaner 2 when the system was 'ON'. In total, the circuit produced over 15% more concentrate when the FloatStar system was active. Despite this, the system managed to decrease the combined tailings grade when compared to 'OFF' data, and showed a small increase in recovery.
The optimization system has a more direct handle on the silica contamination level, since it adjusts the mass pull to the tailings stream. The results in Table II show that there is a distinct reduction in the silica in the product stream when the optimization system is activated.
Conclusions
The analysis of the results shows clearly that the Mintek system provided considerable benefit. It was very interesting to note the magnitude of the benefit from advanced stabilization alone. The long-term test in particular showed that improvements in performance were not simply temporary, or limited to a short period directly after the commissioning.
The data from the optimization test campaign, while only representing a short operating period, confirms the improved performance under the Mintek system. In particular it is interesting to note the dramatic increase in throughput that was achieved, while still maintaining and even improving process performance.
It can be concluded that even on circuits with a low number of flotation units, using reverse flotation, that advanced control can provide considerable benefit.
Acknowledgements
Mintek would like to thank Vale for permission to mention the results, and for their assistance in compiling this paper. This paper is published with the permission of Mintek.
References
1. Smith, G.C., Jordaan, L., Singh, A., Vandayar, V., Smith, V.C., Muller, B., and Hulbert, D.G. Innovative process control technology for milling and flotation circuit operations. Journal of The South African Institute of Mining and Metallurgy, vol. 104, no. 6, 2004. pp. 353-366. [ Links ]
2. Schubert, J.H., Henning, R.G.D., Hulbert, D.G., and Craig, I.K. Flotation control—a multivariable stabilizer. International Mineral Processing Congress, San Francisco, 1995. [ Links ]
3. Henning, R.G.D., Atasoy, Y., and Schubert, J.H. Improved Flotation Performance at Fimiston Plant Through Better Level Control. The Canadian Institute of Mining, Metallurgy and Petroleum. International Symposium on Gold recovery, Montreal,1998. [ Links ]
4. Schubert, J.H., Henning, R.G.D., Gebbie, I.R., and Valenta, M. Improved flotation performance at Karee Platinum Mine through better level control. Journal of The South African Institute of Mining and Metallurgy, vol. 99, no. 1, 1999. pp. 35-40. [ Links ]
5. Singh, A., Louw, J.J., and Hulbert, D.G. Flotation stabilization and optimization, Journal of the South African Institute of Mining and Metallurgy, vol. 103, no. 9, 2003. pp. 581-588. [ Links ]

