


Servicios Personalizados
Articulo
 Inglés (pdf)
 Articulo en XML
 Referencias del artículo
Indicadores

Links relacionados
-
 Citado por Google
 -
 Similares en Google
Compartir

 Permalink
Journal of the Southern African Institute of Mining and Metallurgy
versión On-line ISSN 2411-9717
versión impresa ISSN 2225-6253
J. S. Afr. Inst. Min. Metall. vol.112 no.2 Johannesburg ene. 2012
TRANSACTION PAPER
A risk evaluation model for support design in Bushveld Complex underground mines: part II-model validation and case studies
W.C. JoughinI; A. JagerII; E. NezombaIII; L. RwodziIII
ISRK Consulting
IIIndependent Consultant
IIIUniversity of the Witwatersrand
SYNOPSIS
A risk evaluation model has been developed that enables the quantification of expected injuries and economic losses resulting from rockfalls associated with a support system in a given geotechnical environment, which is described in Part I (Joughin et al., 2011b). Part II presents the validation of the risk evaluation model. Underground mapping of joints and rockfalls was carried out to provide data for field calibration of the model. This survey was limited to small rockfalls,due to the relatively short period of mapping. Therefore the model was also correlated with rockfall and rockfall injury data collected by mine personnel. The analyses showed that the model provides a reasonable estimate of the expected frequency and size of rockfalls and the frequency of rockfall injuries, but further work is required to enhance the model. Three case studies are presented, which show the benefits of improved support systems from both economic and safety perspectives. This work has demonstrated that the risk evaluation model and the software developed are immediately useful, but further work is required to develop and improve the tools.
Keywords: risk evaluation, risk based design, probabilistic design, statistical keyblock analysis, support design, joint mapping.
Introduction
The risk evaluation model is described in Part I (Joughin et al. 2011b), which is included in this issue. This paper describes the validation and testing of the risk evaluation model followed by case studies.
Validation of the risk evaluation model
This section describes an exercise to correlate simulated rockfall data with underground rockfall data. The exercise has been split into two: firstly to correlate the rockfall size distribution, and secondly to check that the number of large rockfalls and rockfall injuries generated through this process are representative of the actual numbers recorded on the operation. Due to the relatively short duration of the underground rockfall mapping, the mapped rockfalls are all relatively small. This was the only data available for reliably correlating the rockfall size distribution. The mine's rockfall database and rockfall injury data were used for the second part of the analysis. A sensitivity analysis was also carried out to investigate the influence of various input parameters on the results.
Field calibration of simulated rockfalls
The objective of this investigation was to determine whether the JBlock (Esterhuizen, 2003) software reliably simulates the actual frequency and size distributions of rockfalls that occur underground.
Underground mapping data
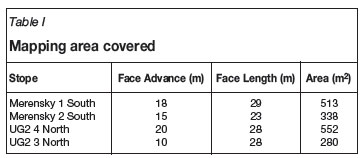
Underground mapping was carried out at UG2 and Merensky panels at Mine A, a platinum mine in the Bushveld Complex, over a period of 5 weeks (Table I). The shaft was selected due to the structural complexity, which would ensure a blocky environment. When specific panels were selected, it was apparent that the structural complexity affected the Merensky Reef hangingwall and not the UG2 hangingwall. The underground mapping exercise and data are described in more detail in Joughin et al. (2011a).
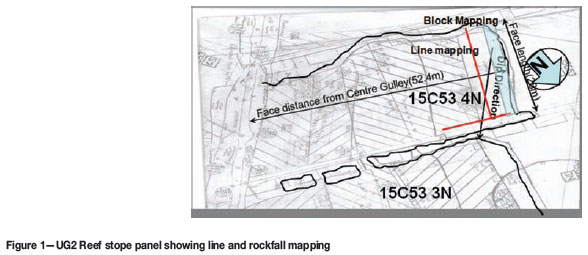
One of the UG2 stope panels is shown in Figure 1. The UG2 stopes are supported with mine poles, and the Merensky stopes are supported with mine poles and hydrabolts, due to the blocky nature of the reef.
Geotechnical Line mapping was carried out in the dip and strike directions as indicated by the red lines in Figure 1. The following information was collected:
Distance along line (to determine joint spacing)
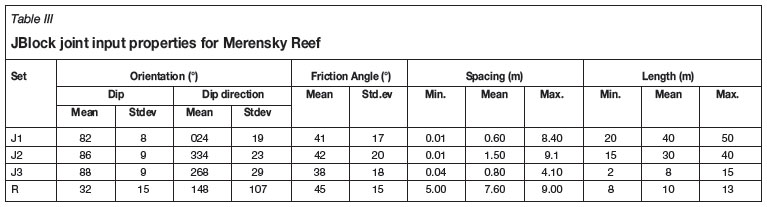
Parting planes were determined from geological borehole data. The mapping results are presented in Table II and Table III.
The rockfalls were mapped on the face during each shift, on a daily basis (Monday to Friday), in the area indicated by the pale blue shading in Figure 1. The mapping team started by marking all the rockfalls that had occurred after the blast on the previous shift during the early morning examination. The boundaries of the rockfall moulds in the hangingwall were painted. The following characteristics of each rockfall were captured:
- Rockfall length was taken to coincide with the dimension almost parallel or parallel to face
- Rockfall width was taken in a direction perpendicular to face
- Rockfall height was taken as an average of maximum and minimum height for each rockfall,
The statistics of rockfalls recorded underground and their respective times of failure are listed in Table IV.
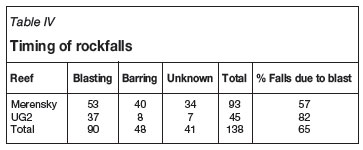
Some rockfalls, however, displayed fractures forming some of the release surfaces of the rockfall wedge. It could not be established with confidence whether these fractures were formed as a result of blast or stress effects on the rock. However, fractures formed keyblock release surfaces, particularly for the Merensky Reef where there was a significant number of low-angle blast fractures recorded.
Unfortunately, despite the effort, the time dedicated for recording rockfalls underground and the small dataset of rockfalls has been deemed to be inadequate to do a conclusive rockfall correlation exercise. A much larger data set specific to each ground control district from several mines around the Bushveld Complex is required to better understand rockfalls.
JBlock simulation and correlation
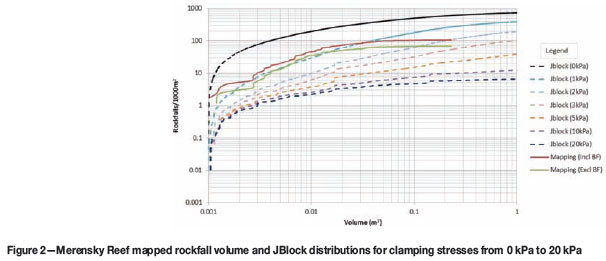
The objective of this investigation was to determine whether JBlock reliably simulates the actual rockfall frequency and size distributions that occur underground. A JBlock analysis was done to simulate a set of rockfalls for comparison with mapped rockfall data. The joint set data from underground mapping presented in Table II was used to statistically simulate keyblocks in JBlock for both the UG2 and Merensky reefs. The correlation of Merensky mapped data with JBlock simulated data is presented in Figure 2.
The curve for the mapped rockfall data for the Merensky Reef has a good correlation at low clamping stresses for rockfalls between 0.003 m3 and 0.03 m3, but for larger rockfalls, the curve crosses several clamping stress curves as the size increases. This trend indicates that JBlock needs to be modified to allow increasing clamping stresses for increasing rockfall size or in fact rockfall height.
The mapped rockfall data set includes very small rockfalls, but is limited to maximum rockfall size of 0.46 m3. It is clear that applying some low value of clamping stress to this range of block sizes greatly improves the correlation between mapped and simulated results. However, it is quite apparent that the JBlock program needs to be modified further to improve the correlation. The actual clamping stress in the hangingwall increases with increasing height above the stope, and the results show that a low clamping stress is appropriate for small rockfalls, while a higher clamping stress is appropriate for larger rockfalls. A longer and more extensive rockfall data collection exercise will be required to collate the full range of rockfall sizes.
Correlation of risk evaluation with mine rockfall and injury data
A validation of the risk evaluation model, which included the RiskEval program, was undertaken in order to measure its performance against observations at the mines. The objective of this exercise is to determine whether the simulated results correlate with the actual number of rockfall injuries and large rockfalls recorded at the mines.
Mine rockfall and injury data
A large database of rockfalls has been accumulated at Mine A. Strata control observers at the mine record rockfalls that occur in their respective working areas on a monthly cycle. In addition to this, rockfalls are recorded, by exception, when an injury or a major rockfall incident occurs. In these records there are over 17 000 recorded rockfalls since 1969, but more comprehensive records have been maintained since 2000. However, most of the records were measured from brows and only the height was recorded. There are approximately 1 200 complete and detailed records of rockfalls. In addition to the dimensions, each record includes information regarding the location, reef, and whether the fall occurred in stoping or development. There is other information, but this is not always consistently recorded. In analysing these rockfalls, only the rockfalls that fell in the stopes have been considered, since stope rockfalls are the focus of this research.
The number of large (>15 m2) rockfalls was determined from the database to be 0.013 per 1000 m2. The area of these rockfalls is approximately 0.42% of the area mined. It should be noted that while the data has been diligently collected and the database is very large, it clearly does not contain all the rockfalls that have occurred. It is expected that the larger rockfalls will be more consistently recorded and a clear bias toward large rockfalls was evident in the database. However, it was not possible to establish a level of confidence in the numbers of rockfalls of any size recorded in the database.
An analysis of rockfall-related injuries at a number of shafts over an 8-year period is presented in Table V. The proportions of the different injury categories have been calculated both including and excluding the non-lost time injuries. For the purposes of calculating the cost of injuries, the non-lost time injuries have been excluded, as these have no significant financial impact.
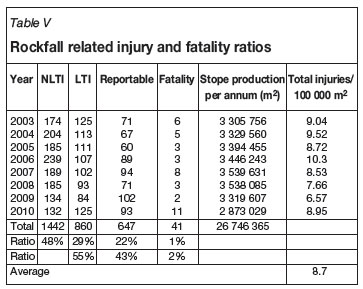
Considering only the lost-time injuries, reportable injuries, and fatalities it was established that injuries and or fatalities occurred at an average of 8.7 times per 100 000 m2 mined.
JBlock simulation and correlation
Rock blocks for this case study have been generated in JBlock using the UG2 and Merensky reef geometry and joint properties determined during the project (Joughin et al. 2011a). Rockfalls were simulated using these block sets and the UG2 and Merensky support standards. The expected frequency of injuries as a result of these rockfalls was simulated using RiskEval (Joughin et al. 2011b). The clamping stress was varied from 0 kPa to 20 kPa. The results are presented in Table VI and Table VII. Note that dilution is reported as the average thickness of dilution (dilution volume /simulated area).
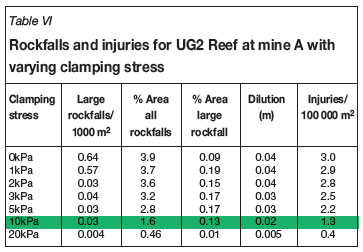
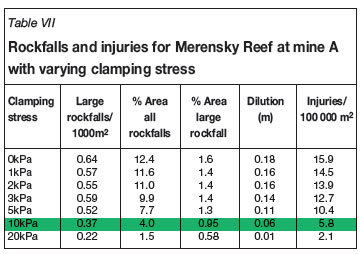
The number and percentage area of large rockfalls determined from the mine A rockfall database was 0.013 rockfalls per 1000 m2, which is in the same order as the 10 kPa clamping stress analysis for the UG2. The Merensky 10 kPa analysis shows a much higher frequency of large rockfalls. However, the injuries reported in Table VII are in the same range as the historical injuries reported in Table V. The rockfall injury data is considered more reliable than the large rockfall data.
For the purposes of this project, it was therefore decided to use a clamping stress of 10 kPa based on the Merensky Reef injury results for the case studies. However, this again highlights the requirement to use an increasing clamping stress with increasing height above the stope to improve the correlation for the full range of rockfalls.
Sensitivity analysis
A sensitivity analysis was conducted to investigate the influence of certain critical parameters on the results of the simulation. The sensitivities considered here are changes in clamping stress, profit margin, support quality, flexibility in mining, and barring efficiency. Both JBlock and RiskEval were used for this analysis (Joughin et al. 2011b). All the sensitivities were done on the Merensky Reef at Mine A using the standard stope support system. Information on the parameters is detailed in the research report (Joughin et al. 2011a).
Clamping stress
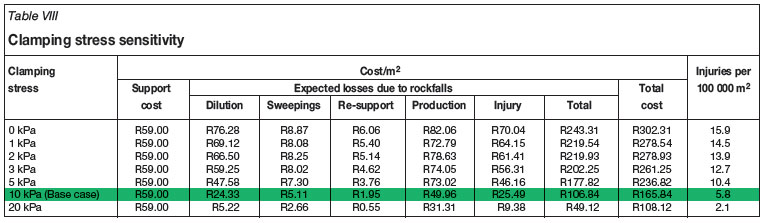
Data from Table VII was used for this analysis. The effect of clamping stress on the expected losses and expected frequency of injuries is shown in Table VIII. This shows that it is important to use a realistic clamping stress to ensure that the results do not bias the comparisons of different support systems.
Profit margins
The effect of changing the profit margin on the results is shown here. A profit margin is the profit realized after processing one ton of ore. The base case used was the support standard for the Merensky Reef at mine A. The profit margin used in the base case is based on that calculated for the mine. The profit margin has been varied to 20% higher and lower than the determined value. The results of this sensitivity are listed in Table IX.
It can be deduced that a higher profit margin results in higher losses, and a lower profit margin in lower losses. This shows that on operations where the profit margin is high, it makes sense to use more effective support from an economic perspective. It also illustrates the importance of an accurate calculation of the profit margin per ton.
Quality of support installation
The consequences of deviation from standard support spacing has been analysed. The base case is the mine standard with no deviation or error in the support spacing. Then the support spacing is varied on both dip and strike, while keeping the mean spacing to standard. The mean support spacing is then increased by the same amount as the error. Finally, an unsupported stope is also investigated to illustrate the reduction in rockfalls offered by support. The effect on the frequency of rockfalls and associated costs experienced with each of these variations in the support system installation are listed in Table X and Table XI respectively. Note that dilution is reported as the average thickness of dilution (dilution volume/simulated area).
It is interesting to note that increasing the variability while maintaining the average support spacing results in slightly more injuries and losses. As expected, increasing the support spacing does have a significant effect on the expected losses and injuries. If no support was installed, many more rockfalls would occur and the expected losses would be far greater than the cost of support. However, the current model for determining injuries is not appropriate for unsupported stopes (Joughin et al. 2011b). The exposure reduction for falls that occur after the blast and rocks that are barred is applied to rockfalls in-between support and not to the larger rockfalls that fail support. Therefore this reduction is applied to all the rockfalls in the unsupported case, including the larger rockfalls, and results in a significant underestimation of the expected injuries. This does not affect the expected losses, with the exception of the cost of injuries, which would be much greater.
Flexibility
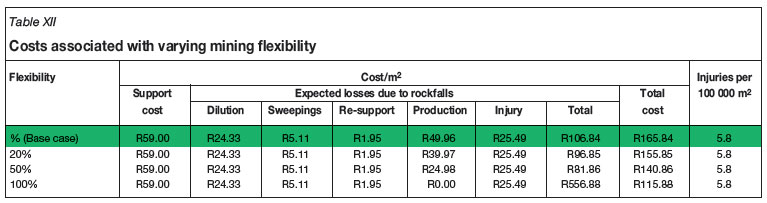
The effect of increasing flexibility or increasing the available face length is investigated here. Mining flexibility is the availability of a spare stope to which labour can be redirected in the event that there is a large rockfall and the stope panel needs to be re-established. This is possible in the case where there are dedicated stope re-establishment crews. Table XII lists the expected losses associated with varying mining flexibility. It can be concluded that there is a reduction of production-related losses as flexibility increases. This analysis makes a very strong case for creating flexibility and employing these rehabilitation crews. However, the additional cost of creating this flexibility and maintaining these crews should be determined for a comprehensive risk evaluation. This has not been done as part of this project.
Effectiveness of barring
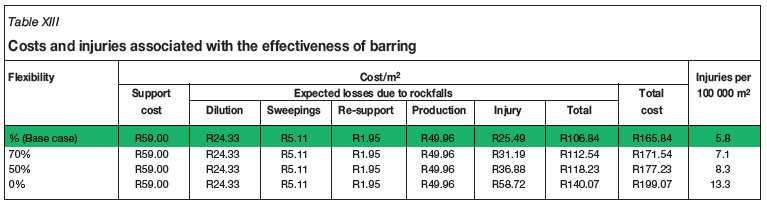
Barring of loose rocks in the stope hangingwall is an important part in making an underground working area safe. The effect of improving barring on the number of injuries and associated costs is investigated here. The base case of 90% effective barring is based on underground mapping results detailed in the research report (Joughin et al. 2011a). The injuries and costs for different levels of barring effectiveness are listed in Table XIII. It can be observed that as the effectiveness of barring reduces, so the expectedinjuries and costs increase. The more than 40% increase in injuries when barring is only 50% effective highlights the importance of carrying out the making-safe procedures properly.
Risk evaluation case studies
The three risk evaluation case studies described in this sectionwere selected to demonstrate the benefit of using the risk evaluation approach to quantify and compare the cost and safety impacts of the different stope hangingwall support scenarios. The case studies are based on mine A, UG2 and Merensky reefs, and a Merensky ground control district at mine B, another platinum mine in the Bushveld Complex.
The joint data for each ground control district, support systems, and financial data are detailed in the research report (Joughin et al. 2011a). All of this data was obtained from the operations. Specific mining costs were difficult to obtain since the information is not grouped appropriately for this exercise. The assumptions described in Joughin et al.1 were used. A clamping stress of 10 kPa was used for each case study.
Case Study 1 (UG2 Reef at mine A)
This case study is based on data collected on the UG2 Reef from mine A. The base case for the scenarios considered here is the support system that is currently being used for the UG2 at this mine. The system comprises mine poles only in the stope and 1.2 m Hydrabolts in the gully. A number of support scenarios that are improvements to the current support system were considered to compare the risk associated with rockfalls in each of the scenarios.
The JBlock rockfall results for case study 1 are presented in Table XIV. Note that dilution is reported as the average thickness of dilution or increase in stoping width (dilution volume/simulated area). The large rockfalls are those that are large enough to require re-establishment of the panel. The frequency of large rockfalls in the UG2 is significantly lower than that determined for the Merensky.
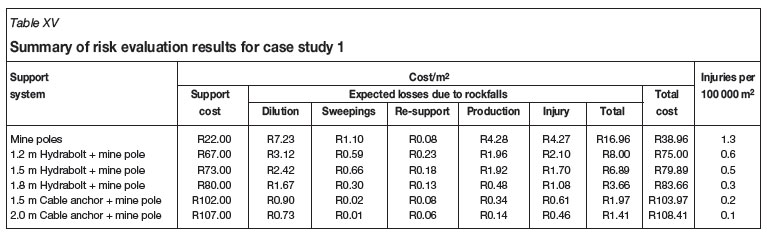
This risk evaluation is described in Joughin et al. 2011b and is based on rockfall size and location and the zone in which it falls. The summary for the risk evaluation results of this case study are presented in Table XV.
The introduction of 1.2 m Hydrabolts halves the number of injuries, and this reduces substantially with each improvement in the support system. The same trend can be seen for all of the losses. The dilution is the largest contributor to the losses, followed by production losses. However the total loss for the mine pole support system is low relative to the cost of the other support systems and therefore the mine pole support system has the lowest total expected cost. This is due to the relatively low frequency of rockfalls, particularly large rockfalls. In this case the motivation for improving support would be based on safety only.
Case Study 2 (Merensky Reef at Mine A)
This case study has been based on the mapping exercise done on the Merensky Reef at mine A (Joughin et al. 2011).
The base case for the scenarios considered here is the support system that is currently used at this mine, which comprises a combination of mine poles and 1.2 m long Hydrabolts in the stope and 1.2 m Hydrabolts in the gully. A number of support scenarios, which represent improvements of the current support system, were considered to compare the risk associated with rockfalls in each of the scenarios.
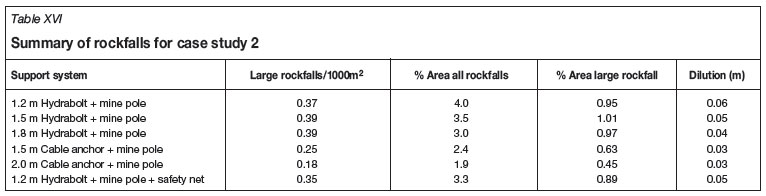
The JBlock rockfall results for case study 2 are presented in Table XVI. Note that dilution is reported as the average thickness of dilution (dilution volume/simulated area).
Note that there are many more rockfalls per area mined than that determined for the UG2 (Table XVI). The original mine support used in this case study represents the base case, and the remaining support systems are potential improvements. Increasing the Hydrabolt length reduces the overall rockfall percentage area and dilution significantly, but the frequency and percentage of large rockfalls remain essentially the same (given the stochastic simulation process). This indicates that the Hydrabolt support system does not have a high enough support resistance to prevent the larger rockfalls. Their main purpose is to reduce the frequency of injuries. Introducing stronger and longer cable anchors results in a reduction in both the overall and large rockfall frequency. The safety nets show a significant reduction in the percentage area of all rockfalls, but the improvement for large rockfalls is not significant, since the nets are not designed for this purpose. The reduction in dilution will not be realized, since the nets will be removed.
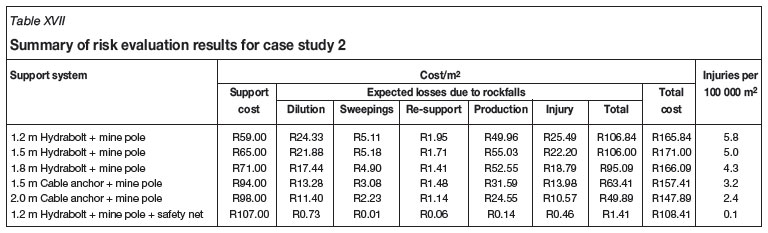
The summary of risk evaluation results for this case study is presented in Table XVII. The expected losses for the nets are not included in this table, since in reality the nets will be removed and the damage consequences will remain. Nets can reduce only the expected frequency of injuries.
The results show that each improvement in the support system results in a reduction in the expected frequency of rockfalls. Safety nets are also shown to reduce the risk of injuries, in this case by 15%.
In this case study, the expected losses due to rockfalls are significant and offset the cost of the improved support, so the improved support could be justified on both a safety and an economic basis. The losses due to production are the greatest due to the relatively high frequency of large rockfalls. However, it must be noted that the frequency of large rockfalls could not be calibrated with confidence and these losses could be overestimated. The losses due to injuries and dilution are also significant. Sweepings losses and the cost of re-supporting are relatively insignificant. The support cost of nets is relatively insignificant, since they are re-used. However, it is likely that the nets will need to be replaced when significant rockfalls occur, and the evaluation of these losses is not currently modelled appropriately.
Case Study 3 (stope cable anchors at Mine B)
Mine B is a platinum mine in the Bushveld Complex. The Merensky Reef at this mine is extremely blocky, and as such the case study has been focused entirely on the Merensky Reef. The detailed mapping and support systems are described in more detail in Joughin et al. 2011a.
The mine changed its stope support system from the 120 kN, 1.5 m cable anchors used previously in combination with mine poles to a new 250 kN, 3 m cable anchor support with no mine poles. The mine wanted to better understand the performance of their current 250 kN, 3 m cable anchor support system in comparison to the old support system, and also investigate possible improvements.
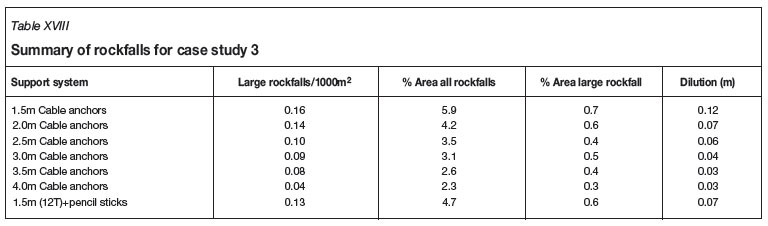
A summary of the JBlock results in the face area for case study 3 is presented in Table XVIII.
The results show a significant reduction in the frequency of large rockfalls and the percentage area of rockfalls with the introduction of the new 3 m cable anchor support system. Also, as the cable anchor length is increased, the frequency of large rockfalls and percentage area of rockfalls further decreases. The RiskEval results for each scenario are directly related to the frequency of rockfalls and are presented in Table XIX.
The results show the improvement obtained when changing over from the 1.5 m 120 kN cables with elongates to the 3 m 250 kN cable anchors. Injuries were reduced, as well as production delays. They also show that the longer the cables, the lower the total cost, due to the reduction in expected losses owing to rockfalls.
It must be noted that the cost of drilling has not been included in the analyses. However, the labour complement was the same for both the old and the new support systems, and therefore these can be compared directly. The cost of drilling should be considered when comparing different lengths of cable anchors. These costs were not readily available on the mine.
Conclusions
The model was tested by collecting joint characteristics and mapping rockfalls on two different reefs (UG2 and Merensky) in a structurally complex mine. The method of data collection is described in detail (Joughin et al. 2011a), which will be useful for anyone attempting this type of analysis. The following conclusions can be drawn from these analyses:
- clamping stress
- profit margins
- quality of support installation
- flexibility (spare stopes)
- effectiveness of barring.
A series of case studies was carried out that demonstrates the benefits of using the risk evaluation model. Several different support systems were evaluated and compared in each of three different geotechnical environments. The model clearly shows the expected frequency of injuries and economic losses for each support system, which enables a fair comparison of each support system.
This work also provided an indication of the amount of work required to perform such analyses. The initial part of the analyses involves the collection of joint data through underground mapping, collecting financial data, and investigating the methods of rehabilitating rockfalls used by the mine. This will involve a considerable amount of work, as costing for specific tasks is not always readily available. However, once this has been done, the individual support system analyses are very quick and easy.
Recommendations for furher research
This project has demonstrated that the risk evaluation model and the software developed is immediately useful, but further work is required to develop and improve the tools. The following research and development is recommended:
- Rockbursts and seismically induced rockfalls
- Pillar failure
- Unravelling
- Stress damage
- Time dependant deterioration
Acknowledgements
The Mine Health and Safety Council is thanked for providing the funding for this research.
Data was obtained from several operations: Impala Platinum, Lonmin, AngloGold Ashanti (Mponeng), Gold Fields (South Deep), and Anglo Platinum (Dishaba), and the management of these operations are thanked for their cooperation. Several members of the rock engineering team at Impala also assisted by coordinating underground visits and providing on-the-job training for the MSc students who participated in this work.
In addition to the listed authors, the following people were part of the project team and have made significant contributions to this work: G.S. (Essie) Esterhuizen, Steve Donovan, Roger Stewart, Felix Joel, Chris Nyoni, Jonas Machake, Dave Roberts, Anthony Selikow, and Olaf Goldbach.
References
BARTON, N. Some new Q-value correlations to assist in site characterisation and tunnel design. International Journal of Rock Mechanics and Mining Sciences, vol. 39, 2002. pp. 185-216 [ Links ]
ESTERHUIZEN, G.S. JBlock User's Manual. 2003. [ Links ]
JOUGHIN, W.C., NEZOMBA, E., RWODZI, L., and JAGER, A.J. A Risk Based Approach to Enhancing Support Design in Bushveld underground Mines. Final project report SIM060201 Track B. MHSC. 2011a. [ Links ]
JOUGHIN, W.C., NEZOMBA, E., RWODZI, L., and JAGER, A.J. A risk evaluation model for support design in Bushveld Complex underground mines: Part I- Description of the model. Journal of the Southern African Institute of Mining and Metallurgy, vol. 112, no. 2, 2011b. pp. 83-94 [ Links ]
This paper was first presented at the, MineSafe Conference, 15-18 August 2011, Emperors Palace, Hotel Casino Convention Resort, Johannesburg.
© The Southern African Institute of Mining and Metallurgy, 2012. SA ISSN 0038-223X/3.00 + 0.00.

