


Services on Demand
Article
 English (pdf)
 Article in xml format
 Article references
Indicators

Related links
-
 Cited by Google
 -
 Similars in Google
Share

 Permalink
Journal of the Southern African Institute of Mining and Metallurgy
On-line version ISSN 2411-9717
Print version ISSN 2225-6253
J. S. Afr. Inst. Min. Metall. vol.112 n.2 Johannesburg Jan. 2012
TRANSACTION PAPER
A risk evaluation model for support design in Bushveld Complex underground mines: part I-description of the model
W.C. JoughinI; A. JagerII; E. NezombaIII; L. RwodziIII
ISRK Consulting
IIIndependent Consultant
IIIUniversity of the Witwatersrand
SYNOPSIS
A risk evaluation model has been developed, that enables the quantification of expected injuries and economic losses resulting from rockfalls associated with a support system in a given geotechnical environment. This enables the comparison of different support systems based on the expected frequency of injuries and the total cost of the support system, including the expected economic losses. The model takes into consideration the variability in joint orientations and joint strength within the geotechnical environment and the variability and quality of support systems. The quantification of the benefits of other rockfall risk-mitigating strategies, such as the effectiveness of barring or monitoring, are also incorporated in the model. The risk model is described in this paper and the validation of the model and case studies are described in Part II.
Keywords: risk evaluation, risk based design, probabilistic design, statistical keyblock analysis, support design, joint mapping.
Introduction
Uncertainty and risk are central features of rock engineering. Rock strengths have very high variability, and the rock mass is made up of multiple discontinuities with varying orientations and shear strengths. These characteristics can also change and deteriorate with time. Mining is not perfect. The dimensions of excavations and pillars vary considerably due to both local geotechnical conditions and lack of compliance or organized mining. This can significantly affect the stability of excavations and pillars. The strength of support units is inherently variable, particularly if timber is used. Support standards are not always followed precisely, and the support system may not perform as intended. This leads to a number of questions.
Which is the best safety strategy or support system to address the risk? How to decide when a design is acceptable with so much variability? How is variability incorporated in a design?
Deterministic methods, such as the pillar and support design formulae, are commonly used for design in the mining industry and other industries. The result of the analysis is typically a safety factor, which is the capacity (usually strength) divided by the demand (usually load). A single value must be selected for each of the input parameters, which-should represent the entire distribution of possible values. This is usually the 'worst case scenario' or some acceptable maximum/ minimum value. The 95 percentile value is often used (Daehnke et al. 2001), which essentially means that for 95 per cent of the cases this will be adequate. This value may be overly conservative and onerous, or may not be adequate to reduce the frequency of injuries to an acceptable level.
Each deterministic method is a model that represents a specific failure mode and usually has very limited applicability. For example, in a highly jointed stope environment, the factor of safety for timber support may be adequate, but rocks may fall-in between support. It will not help to increase the strength of timber units and the factor of safety, if nothing is done to prevent rocks from falling between support. Probabilistic methods take into account the full distributions of input parameters. A distribution of factors of safety (FOS) can be determined using a Monte Carlo simulation (or other similar methods), taking into account the variability in the geotechnical input parameters. The probability of failure can be determined as the proportion of results that have a factor of safety less than 1.0. One difficulty in interpreting results is that most people, including engineers, have difficulty establishing an allowable probability of failure or dealing with low values of probability (Hoek, 1991 and Christian, 2004). A risk evaluation model was developed during a SIMRAC project (Joughin, 2008 and Joughin et. al. 2011a) to address this.
Risk evaluation model
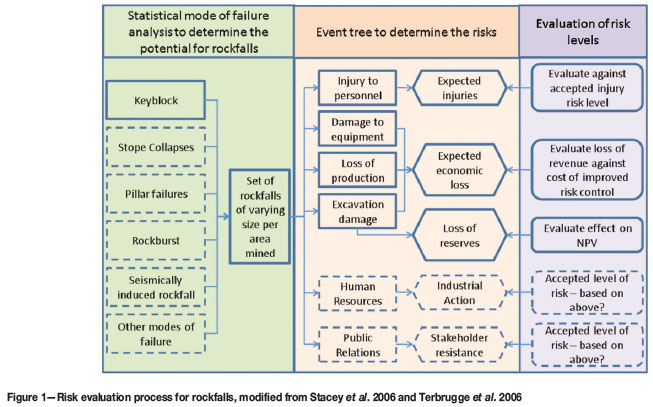
A risk evaluation process has been developed for addressing geotechnical risk in surface mining (Terbrugge et al., 2006) and a slightly modified version for underground mining was presented by Stacey et al. (2006) In this process, the probability of slope/stope failure is determined using a fault tree; the risks are then determined using an event tree and these risks are evaluated against pre-defined accepted levels of risk.
The basic concept has been maintained in the risk evaluation process presented in Figure 1, but it has been adapted to evaluate the risk associated with multiple rockfalls of varying size rather than one major rockfall. This is done because both large and small rockfalls have consequences. Large rockfalls have more severe consequences, but the small rockfalls occur more frequently and their cumulative effect can be as significant.
Statistical mode of failure analysis to determine the potential for rockfalls
The first step is to develop a model that will provide a large set of rockfalls of different sizes, which represents a given area mined or hangingwall exposed (first column, Figure 1). It is important to consider different rockfall sizes, because the consequences depend on the size of the rockfall. Normalizing the set of rockfalls to an area mined enables reasonable comparisons between different support systems and to actual data.
In order to develop the model, potential modes of failure that could result in rockfalls need to be identified. In order to carry out a comprehensive analysis, one should address all relevant modes of failure. The list of failure modes in Figure 1 is by no means complete, but these are general failure modes. For comparison purposes, it is possible to analyse a single mode of failure and compare the performance of two mitigating strategies (e.g. support or mining layout). An analytical model, which can represent the failure mode and determine the volume of failure for variable geotechnical input parameters should be used. Then a Monte Carlo simulation should be carried out to provide a frequency distribution of the rockfalls. If multiple modes of failure are analysed, then the sets of rockfalls can be combined, provided that they represent the same area mined or hangingwall exposed.
In this paper, only the keyblock mode of failure analysis was developed, because there was software available, JBlock (Esterhuizen, 1993), which could perform this type of analysis. This software has been developed further to provide the necessary input for the remainder of the risk evaluation process. Most rockfalls in platinum and chrome mines are due to jointed bounded keyblocks, and therefore this project will be valuable to underground mining in the Bushveld Complex.
The analyses are done on a comparative basis. Different support systems, mining layouts, or other safety strategies can be compared.
Event tree to determine the risks
The next step is to develop an event tree, which is used to determine the consequences and determine the risk (column 2, Figure 1). The event tree in Figure 1 is very simple, and just demonstrates possible outcomes.
The outcomes with solid outlines can be quantified quite reliably using the simple models outlined in the following sections dealing with injuries and economic loss and loss of reserves.
The consequences of industrial action and stakeholder resistance are not easily defined, but these are probably related to the frequency of injuries and fatalities.
RiskEval was developed to read the output from JBlock and calculate the frequency of injuries and costs of rockfalls.
Accepted risk levels
The final step is to evaluate the level of risk against accepted risk levels. It is important to note that the risk of injuries and fatalities is evaluated separately from economic considerations. Defining accepted risk levels for injuries and fatalities is controversial and is discussed in more detail later in this paper, together with the evaluation of economic risk and loss of reserves.
Quantifying the potential for rockfalls
The program JBlock is used to quantify the potential for rockfalls. The program generates a set of keyblocks of varying size, which is normalized by the area mined. A rockfall simulation is then carried out using the proposed support.
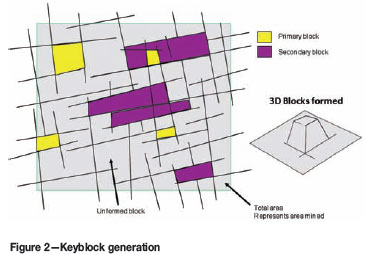
Keyblock generation
The first step in the process is to generate the set of keyblocks or potential rockfalls. The following information is required for this process:
Stope dip and dip direction
The joint information needs to be collected by mapping joints in the underground stopes. The data should represent a ground control district. Parallel parting planes are prominent bedding planes or weak horizons above the reef (e.g. chrome stringers and Green Bar). These can be identified in geological boreholes and/or from isopach maps generated from geological boreholes.
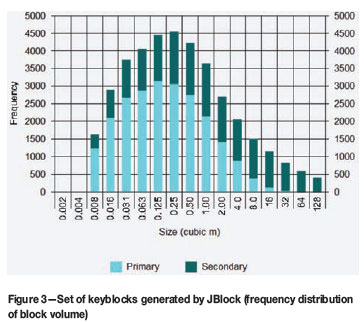
The oriented hangingwall surface of an excavation is simulated with the traces of joints (Figure 2). The joints are projected in 3D and JBlock then simulates the formation of blocks. JBlock also keeps track of the hangingwall surface area of unformed blocks. The total area is the sum of the hangingwall surface area of all blocks and represents the hangingwall surface area exposed during the simulation and can be equated to the area mined. An example of a set of keyblocks is included in Figure 3.
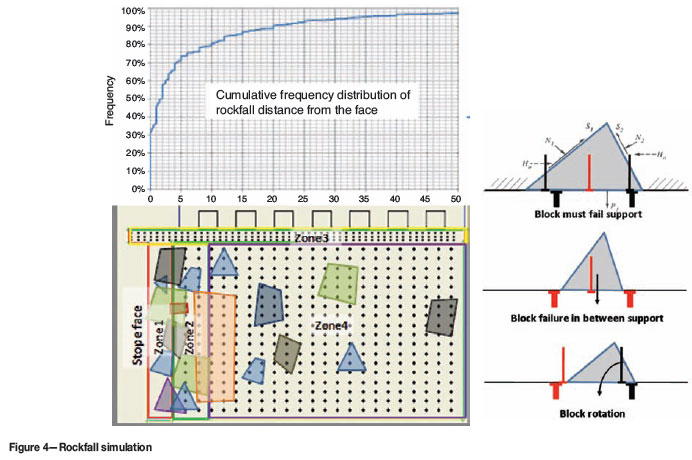
Rockfall simulation
The stope excavation and stope support are then simulated as shown in Figure 4. The following types of support can be simulated:
The mean and standard deviation of the support spacing can be specified to take non-adherence to support standards into consideration. The strength of the support unit also has a mean and standard deviation, which is used to represent the inherent variability of the support (e.g. timber elongates) and/or installation practice (not perpendicular to the hangingwall).
The stope can then be divided into zones of interest. This is important since personnel exposure and the remediation strategies will differ in each of these zones. For the purposes of this study, the zones are defined as the face, sweepings, gully, and back area.
JBlock places the entire set of blocks in the stope area, one by one, and tests the stability of each block. The program first checks the location of the block relative to support and checks that tendons are protruding beyond the block and anchored. It then tests for support failure, failure in between support, or rotational failure. A horizontal clamping stress can be applied during the analysis. Any failed blocks become rockfalls.
The simulation is carried out with many thousands of blocks and a set of rockfalls is created for further analysis. During the simulation, JBlock keeps track of the total hangingwall area exposed (area mined) for the set of blocks and this can be used to normalize the data.
Quantifying rockfall injuries
The quantification of rockfall injuries is carried out using the program RiskEval. The model makes use of the event tree methodology to analyse the probability of a rockfall resulting in an injury.
Event trees start with an initiating event, such as a rockfall (Figure 5). This is followed by the formulation of a set of subsequent possible events (circumstances, conditions, or mitigating measures) that could follow as a result of the initiating event. Paths are developed and the probability of occurrence of each event is calculated or estimated. The probabilities of the final outcome at the end of each path are the product of the probability of occurrence of the initiating event and the probabilities of each event along the path.
Figure 5 illustrates the event tree developed for injuries and fatalities. The event tree analysis is carried out separately for each rockfall generated by the statistical keyblock analysis. The red path indicates the route towards injuries, where the outcome is unfavourable at each event. Alternate paths do not result in injuries. The probabilities can vary depending on the worker category exposure and the rockfall size, location, and mode of failure (those shown in Figure 5 are for a single rockfall example). Explanations of events are provided below.
Rockfall occurs during blast or is effectively barred
A large proportion of rockfalls occur during or shortly after blast, which will not cause injuries, since personnel will not be present. During early examinations, unstable blocks are identified and barred down, rendering them harmless. The model accounts for the proportion of rockfalls that will not cause injuries due to the timing or the effectiveness of barring.
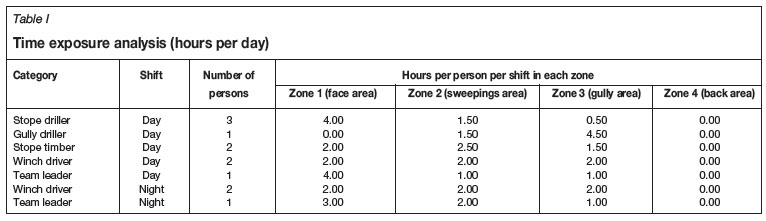
Time exposure of personnel (personnel present)
Rockfalls can occur at any time of day, but personnel are exposed only for a limited time during each shift. The exposure time will be different for each category of worker and will differ in each stope zone. An exposure analysis should be conducted, such as that shown in Table I. The proportion of time exposed is the total number of hours worked in each zone per year divided by the total number of hours per year (365 x 24).
Monitoring and evacuation
Monitoring systems are being developed that could provide a warning prior to a rockfall. Injuries could be avoided if a warning is given and personnel are successfully evacuated prior to the rockfall. Such systems are not widely used, but the results of experimental monitoring systems are encouraging. Timber elongates usually provide a warning prior to large rockfalls. Invariably the failure is progressive and not immediate. The failure of the timber elongates is noisy and alerts personnel that a large failure is about to take place. The success rate of monitoring and excavation would be applied in the model to reduce the exposure of personnel to rockfalls.
Spatial coincidence
If personnel are exposed, they also need to occupy the same space as the rockfall if they are to be injured. Rockfalls can occur entirely in one zone or they can overlap zones. Personnel spend different proportions of their time in the different zones. Each rockfall in the set could potentially injure somebody. Figure 6 illustrates this concept.
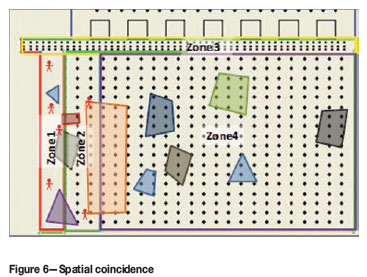
The probability of spatial coincidence for a single rockfall within a zone can be simply estimated by dividing the area of the portion of rockfall within a zone by the area of that zone.
The total spatial coincidence, in a given zone, for all rockfalls can be determined by adding the spatial coincidence for each rockfall. This represents the expected number of times that any person could be struck by a rockfall in a given zone if they were exposed all the time.
Determination of expected frequency of injuries
First, the expected number of injuries per person in a given category for all rockfalls is determined. In this calculation, the total spatial coincidence within each zone is multiplied by the time exposure in each zone and then by the proportion of rockfalls that are not barred or fall out during the blast. The total number of injuries for all categories of workers and all rockfalls can be calculated by adding the product of the number of persons per category by the expected number of injuries per person in a given category.
Since the area of hangingwall exposed was determined for the set of rockfalls used for the analysis, it is possible to normalize the expected number of injuries by area mined. This can be compared directly with the actual number of injuries per area mined in a given ground control district.
It is also possible to calculate the expected injury frequency rate (IFR) per million man-hours or per 1000 workers per annum. The IFR can be converted to a disabling injury frequency rate (DIFR) or fatal injury frequency rate (FIFR) by taking the injury severity into consideration. Modelled DIFR and FIFR can be compared directly with the actual mine data and industry benchmarks. It should be noted that the actual mine data includes the hours spent by other workers and should therefore be lower than the modelled values.
Severity of injuries and fatalities
The severity of injuries cannot easily be determined using this model. The size of the rockfall obviously has a significant effect, but this also depends on where the rockfall strikes the person. It is therefore suggested that injury data from the operation is used to determine the proportion of injuries in the various severity categories:
1. Non-lost time injuries (NLTI) or dressing cases
2. Lost time injuries (LTI) or disabling injuries (DI)
3. Reportable or severe injuries
4. Fatal injuries.
Evaluating accepted levels of injuries and fatalities
In any job or operation, there exists a risk. Some risks are intolerable, some are tolerable, and some are acceptable. Intolerable risk is an imminent threat and results in the job or operation being stopped for safety and or economic reasons. However, where careful controls can be implemented to reduce the risk, such risk is known as tolerable risk.
Defining the accepted risk level for injuries is controversial. Most mining companies target zero harm. While this is certainly a mission, it is not realistic to design for zero fatalities. Mine workers are currently exposed to risks that do result in injuries and fatalities. There will always be a residual risk that remains as long as mining continues, but this can be reduced through effective risk management strategies. It is essential to reduce the number of injuries and fatalities, but realistic targets need to be defined.
Different industries have different perceptions on acceptable risk. In the nuclear power generation and dam engineering industries, where large numbers of the public could be exposed, accepted frequencies of fatalities have been defined that are not zero, but which are extremely low (Bacher and Christian, 2003, Christian, 2004 and Terbrugge et al., 2006).
International risk acceptance criteria
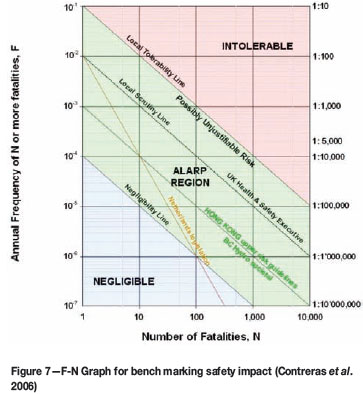
F-N curves are a common way of expressing societal risk in various industries. The method is a graphical representation of the relationship between the annual probability of an event causing N or more fatalities, and the number of fatalities (Figure 7). The graph shows zones of negligible, as low as reasonably practicable (ALARP), and intolerable risk for different industries. The commonly applied benchmark is the annual frequency of a fatality by natural causes of a teenager aged between 10 and 14, which represents the lowest healthrisk population group. This annual frequency is 10-4 and it represents negligible risk. The negligibility line in Figure 7 represents a constant annual frequency of 10-4 for a single fatality. Terbrugge et al. (2006) refers to this as the divide between voluntary and involuntary risk. This implies that if the risk is involuntary, it should be negligible. For voluntary risk, the ALARP region should be used for setting criteria.
An international benchmarking exercise across different industries, including surface and underground mining carried out by Gonzalez and Karzulovic (2004) using the F-N graph is presented in Figure 8. Incidents, which are non-fatal, are also represented on the graph. The graph shows the risk associated with underground mines (internationally, including South African mining industry data). It is apparent that the frequency of fatal accidents in underground mining is higher than most industries. However, multiple fatalities with large numbers are more common in other industries, since miners are exposed only in relatively small groups. In this analysis, merchant shipping, mobile drill rigs, and supertankers are higher risk than underground mining.
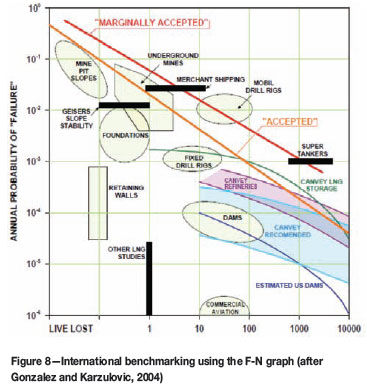
Individual risk can be benchmarked and the value of 10-4 can be treated as negligible risk.
South African mining industry milestones
In 2003, the Tripartite Mine Health and Safety Summit held for the South African mining industry agreed on targets and milestones to be attained by 2013 measured in fatalities per million man hours worked:
Industry target: zero rate of fatalities and injuries Milestones:
This required a 20% annual reduction of the injury and fatality rates across all commodities. The platinum milestones are shown together with the actual platinum industry fatality rates in Figure 9.
Suggested method of evaluating injury risk
A comparison between the different ways of calculating accident rates is shown in Table II. The platinum industry 2013 milestone is highlighted in green. It can be seen that this is below the international negligibility criteria of 10-4, which is commendable. The actual fatality rates (Figure 9) are currently higher than this, but in the lower part of the ALARP region in Figure 7.
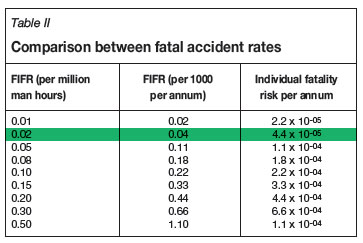
One of the challenges of benchmarking the model results with the international and the South African Mining Industry Milestones is that workers are exposed to many risks, not just rockfalls. Rock-related fatalities are about 40% of the total rockfall injuries. The target rockfall FIFR for the 2013 milestone should therefore be significantly lower than 0.02 to ensure that the milestone is achieved. The risk evaluation model is used to compare different support systems or safety strategies. An incremental reduction in the number of injuries is a positive improvement. Small changes can lead to a positive improvement.
Quantifying economic losses and loss of reserves
The cost of rockfall damage is also evaluated using the program RiskEval. In order to quantify the economic losses and loss of reserves associated with rockfalls, one needs to first determine the consequences of rockfall damage, then determine the method of remediation and tcalculate the cost of damage. Finally, it is necessary to evaluate and compare the economic losses and reserve losses for different strategies.
Remediation strategies and consequences
When a rockfall occurs there are two typical strategies for remediation:
The decision as to which strategy to use depends on the zone in which the rockfall occurs (Figure 10). In the face area (zone 1) and sweepings area (zone 2), the decision is invariably based on the size of the portion of the rockfall within the zone. Critical rockfall dimensions must be specified for RiskEval to determine the choice of strategy. These dimensions and strategies should be based on actual practice on the given operation.
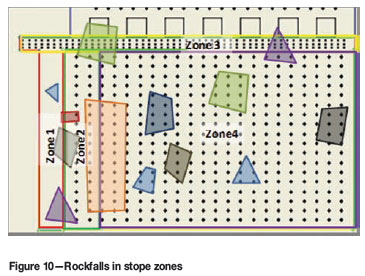
The gully (zone 3) is always required for access and removal of broken rock. It is therefore invariably necessary to clean and re-support the portion of the rockfall in the gully area. The back area (zone 4) is typically clean, swept, and barricaded off. As a result there is no need to remediate and there are no consequences or costs associated with rockfalls in this zone. It is possible that a collapse in the back area will affect the stability of the gully and access to the stope face, which could result in substantial losses. This eventually is currently not catered for in the software, but should be in future.
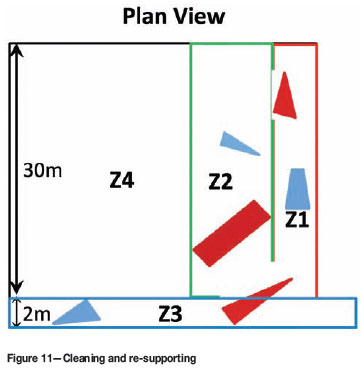
Cleaning and re-supporting
If the portion of area of the rockfall that occurs in zone 1 or 2 is relatively small, it will invariably be cleaned out (Figure 11). In zone 1, the stope face cannot be worked until the rockfall is cleaned out and made safe.The gully (zone 3) will always be cleaned irrespective of the size of the rockfall (Figure 11). If there is support failure, the support will need to be replaced to ensure safety. Rockfalls between support generally do not require additional support.
The losses are determined as follows:
Re-establishing panels
If the portion of area of the rockfall in zone 1 is large (the height is equivalent to or greater than the stoping width and it occupies a significant area), it is not considered safe to clean and re-support. The panel is re-established by mining part of the face and leaving a pillar, as shown in Figure 12. It will be necessary to re-raise for the length of the pillar to re- establish the face. The pillar will be longer than the rockfall by a specified safety margin. The width of the pillar, re-raise width, and face advance must be specified, which should be determined from the mine standard.
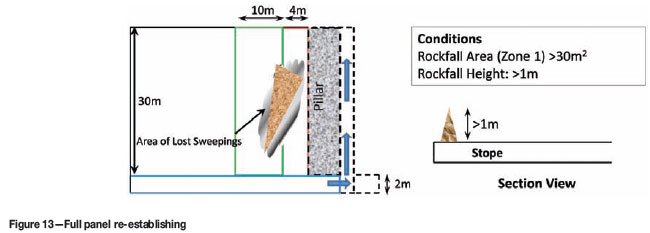
If the portion of the area of the rockfall in zone 1 is large enough that it is necessary to stop the entire panel, it will be necessary to re-raise to establish the panel (Figure 13). The pillar will be equal to the length of the panel and the width must be specified. Re-raise dimensions and face advance must be specified based on standard practice.
It is important to calibrate the modelled frequency of large rockfalls with the actual frequency of large rockfalls on the mine. A reliable database of rockfalls is required for this.
If the portion of the rockfall in zone 2 is too large to clean and support, the rockfall will not prevent any portion of the face from being blasted.
The losses are determined as follows:
If the panel crew can be redeployed to another available stope panel, there is no production loss. RiskEval requires the input of a parameter called flexibility, which represents the probability of another stope being available for mining. The production loss is multiplied by 1-flexibility.
Cost of rockfall damage
The losses are evaluated from a business perspective. The reduction in profits as a direct result of the rockfall damage is considered. Fixed costs and labour are not considered in these calculations, since they remain constant whether the rockfalls occur or not. The cost of certain consumables will be affected by the remediation of rockfall damage.
Dilution cost
The dilution cost is the cost of transport and processing. The transport costs are usually difficult to extract from the mine financial information, since the expenses are captured by department, rather than by function. However, the combined transport and processing costs are estimated to be 20% of the total operational costs based on SRK project experience. The dilution cost per ton must be specified in RiskEva, land this is multiplied by the dilution volume and the specified density of hangingwall rock.
Re-support cost
For re-supporting, the cost of standard support per square metre is used, which is multiplied by the re-support area.
Loss of profit due to lost production
Loss of profit due to lost production is the revenue from production that would have been achieved, less the cost of consumables that should have been used during that mining, e.g. explosives, support), transport, and processing. For loss of production, RiskEval requires the profit margin per ton of ore to be specified. The revenue per ton of ore is readily obtained from mine financial statements or can be determined from the ore grade and long-term commodity prices. The cost of consumables is also difficult to extract from mine financial information, but can be estimated to be 30% of the total operational costs. The volume of lost production is multiplied by the ore density and the production profit margin per ton of ore.
Loss of profit due to sweepings
Loss of profit due to lost sweepings is the revenue from sweepings that should have been achieved, less the associated transport and processing cost. For loss of sweepings, RiskEval requires the profit margin per ton of ore to be specified. This should be slightly higher than the profit loss (production), since the cost of consumables used during mining, has been spent. The revenue per ton of ore should be assessed in the same way and specified in RiskEval. If the average grade sweepings is known, this can be used for a more accurate assessment. The cost of transport and processing can be estimated to be 20% of the total operational costs. The volume of lost sweepings is multiplied by the ore bulk density and the profit loss (sweepings) per ton of ore.
Each rockfall is simulated and the total cost is the sum of the cost of all the individual rockfalls.
The costs of rockfalls of various sizes were calculated to demonstrate how the model is applied. The following input parameters were determined for a platinum mine (Joughin et al. 2011a):
Typical costs of rockfalls of varying size up to 15 m2 are shown in Figure 14.
Typical costs of rockfalls of varying size, but greater than 15 m2, for the different zones, are shown in Figure 15 to Figure 17.
Costs of injuries and fatalities
The direct costs of injuries and fatalities were estimated using SIMRAC levies, medical costs from a mine hospital (Rwodzi, 2010) and cost data from Marx (1996) that were escalated according to inflation. These are presented in Table III. It should be noted that in the data for medical costs and wages and compensation, a distinction is made only for injuries and fatalities.
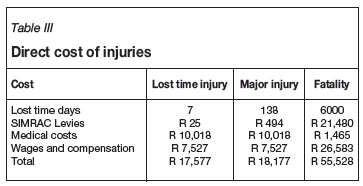
These direct costs are not very high when compared with the cost of the rockfall damage associated with large rockfalls (see Figure 15), and it is unlikely that they will play a major role in the investigation.
However, substantial indirect costs are incurred when the mine is closed. The mine may be closed during rescue operations and the Department of Mineral Resources may instruct the mine to close (Section 54 of the MHSA). Mines have been closed for 5 to 10 days by the DMR after fatalities. Depending on the production revenue and the amount of production lost, these costs can vary, but are always significant.
For example, if 50 panels are stopped for 5 days, the loss would be R11 720,000.
The injury costs are estimated from the total number of injuries, the severity of the injury, and the cost of the injuries, including lost production.
The total injury costs should be added to the total cost of rockfall damage to provide the total expected cost of rockfalls.
Economic evaluation
When carrying out an economic evaluation, one needs to consider both the cost of the risk control (e.g. support system) and the expected cost of rockfalls. Figure 18 shows that the expected cost of rockfalls increases with increasing hazard. Conversely, the cost of the risk control must be increased to limit the rockfall hazard. The total cost is the sum of the cost of the risk control and the expected cost of rockfalls. The optimum cost lies somewhere in the middle. It is suggested that two scenarios with different risk controls are compared.
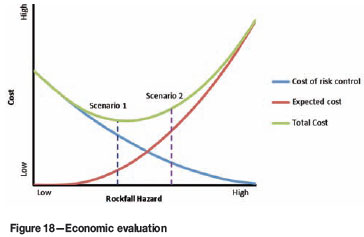
It is essential to ensure that the same production over the same period is used for both scenarios. It is suggested that annual costs are used, and the exercise can be scaled to represent the whole mine.
Once-off implementation costs and reserve loss
If a new risk control is implemented, there is often a large implementation cost. For example, the introduction of backfill requires the installation of a backfill plant.
Reserve losses effectively shorten the life of the mine, and this loss should be accounted for at the end of the life of the mine.
It is suggested that a discounted cash flow is used to determine the net present cost of the two scenarios. Implementation costs can be treated as a capital cost at the start of the cash flow and the reserves are accounted at the end of the cash flow.
Conclusions
This model enables the quantification of rockfall injuries and economic losses due to rockfalls for a support system in a given geotechnical environment. Different support systems can be compared and the effectiveness of monitoring and barring can be assessed in terms of the expected frequency of injuries and the total cost of support systems, including the expected economic losses resulting from failures of the systems. Variability is taken into consideration.
The existing software, JBlock, was enhanced to perform the rockfall simulation. This tool can now be used to test and design support to cater for the full range of rockfall sizes that can be anticipated in a geotechnical environment. The simulated rockfalls can now be normalized by the area mined.
The consequences of these rockfalls are evaluated using the new software RiskEval. The frequency of injuries is simulated by considering the temporal and spatial exposure of personnel. The expected losses associated with dilution, re-supporting, loss of production, and loss of sweepings can be evaluated for each rockfall and accumulated. Importantly, rockfalls located in different zones within the stope panel have different consequences and are evaluated accordingly.
The validation of the model and examples of its application are described in Part II of this paper (Joughin et al. 2011b).
Acknowledgements
The Mine Health and Safety Council is thanked for providing the funding for this research.
The participants of the industry trial workshops and earlier workshops are thanked for testing the software and making valuable comments and suggestions. In particular, comments and suggestions from Michael du Plessis (Lonmin), Lucas van Aswegen (Anglo Platinum), Noel Fenandes (Impala), and Les Gardiner (Impala) were invaluable.
The JBlock software used for the analysis was developed by G.S. (Essie) Esterhuizen and was upgraded by him for the purposes of this project.
The RiskEval software was originally coded by Roger Stewart and the final version was upgraded by Steve Donovan. Dick Stacey, Luiz-Fernandes Contreras, and Oscar Steffen are also thanked for providing valuable suggestions.
References
BAECHER, G.B. and CHRISTIAN, J.T. Reliability and statistics in geotechnical engineering. Wiley, Chichester, U.K. 2003. [ Links ]
BARTON, N. Some new Q-value correlations to assist in site characterisation and tunnel design. International Journal of Rock Mechanics and Mining Sciences, vol. 39, 2002. pp. 185-216. [ Links ]
CHRISTIAN, J. Geotechnical engineering reliability: How well do we know what we are doing? Journal of Geotechnical and Geoenvironmental Engineering, vol. 130, no. 1, 2004. pp. 985-1003. [ Links ]
DAEHNKE, A., VAN ZYL, M., and ROBERTS, M.K.C. Review and application of stope support design criteria. Journal of the South African Institute of Mining and Metallurgy, vol. 101, no. 5, 2001. pp 135-164. [ Links ]
ESTERHUIZEN, G.S. JBlock User's Manual. 2003. [ Links ]
GONZALEZ, S. and KARZULOVIC, A. Benchmarking Fatalides en la Industria Minera. A. Karzulovic & Asoc. Ltda. Alfredo Rioseco 0238, Providencia, Santiago, CHILE 6641356. 2004. [ Links ]
HOEK, E. When is a design in rock engineering acceptable? Müller Lecture. Proceedings of the 7th International Congress on Rock Mechanics, Aachen. A.A. Balkema, 1991. pp 1485-1497. [ Links ]
JOUGHIN, W.C. A Preliminary Model for Quantifying the Risk of Rockfalls and Evaluating the Benefits of Safety Spending. 1st Southern Hemisphere International Rock Mechanics Symposium, Perth. 2008. [ Links ]
JOUGHIN, W.C., NEZOMBA, E., RWODZI, L., and JAGER, A.J. A Risk Based Approach to Enhancing Support Design in Bushveld underground Mines. Final project report SIM060201 Track B. MHSC. 2011a. [ Links ]
JOUGHIN, W.C., NEZOMBA, E., RWODZI, L., and JAGER, A.J. (2011b). A risk evaluation model for support design in Bushveld Complex underground mines: Part II-Model validation and case studies. Journal of the Southern African Institute of Mining and Metallurgy, vol. 112, no. 2, 2011b. pp. 95-104. [ Links ]
MARX, C. An activity based costing approach to fall of ground accidents in a South African gold mine. Potchefstroom: PU vir CHO (Dissertation- MBA). 1996. [ Links ]
RWODZI, L. Rockfall Risk: Quantification of the consequences of rockfalls. MSc Dissertation, Faculty of Engineering and the Built Environment, University of the Witwatersrand, Johannesburg. 2010. [ Links ]
STACEY, T.R. and BARTLETT, P.J. Probabilistic evaluation of ore pass stability and support. Static and Dynamic Considerations in Rock Engineering, Brumer (ed.). Balkema, Rotterdam. 1990. [ Links ]
STACEY, T.R, TERBRUGGE, P.J., and WESSELOO, J. Risk as a Rock Engineering Design Criterion. Deep and High Stress mining 2006. Quebec. 2006. [ Links ]
TAPIA, A., CONTRERAS, L.F., JEFFERIES, M.G., and STEFFEN, O. Risk evaluation of slope failure at Chuquicamata Mine. In Proc. Int. Symp. Rock Slope Stability in Open Pit Mining and Civil Engineering,477 485, Perth. Australian Centre for Geomechanics, ISBN 978 0 9756756 8 7. 2007. [ Links ]
TERBRUGGE, P.J., WESSELOO, J., VENTER, J., and STEFFEN, O.K.H A risk consequence approach to open pit slope design. Journal of the Southern African Institute of Mining and Metallurgy, vol. 106, no. 6, 2006. pp. 503-511. [ Links ]
This paper was first presented at the, MineSafe Conference, 15-18 August 2011, Emperors Palace, Hotel Casino Convention Resort, Johannesburg.
© The Southern African Institute of Mining and Metallurgy, 2012. SA ISSN 0038-223X/3.00 + 0.00.

