


Servicios Personalizados
Articulo
 Inglés (pdf)
 Articulo en XML
 Referencias del artículo
Indicadores

Links relacionados
-
 Citado por Google
 -
 Similares en Google
Compartir

 Permalink
Journal of the Southern African Institute of Mining and Metallurgy
versión On-line ISSN 2411-9717
versión impresa ISSN 2225-6253
J. S. Afr. Inst. Min. Metall. vol.112 no.1 Johannesburg ene. 2012
TECHNICAL NOTE
Alternative dissolution of zircon samples and simultaneous analysis of major and trace components
S.J. LötterI; W. PurcelllI; J.T. NelII; E. SnydersII
IDepartment of Chemistry, University of the Free State, South Africa
IIThe South African Nuclear Energy Corporation Ltd. (Necsa), Pretoria, South Africa
SYNOPSIS
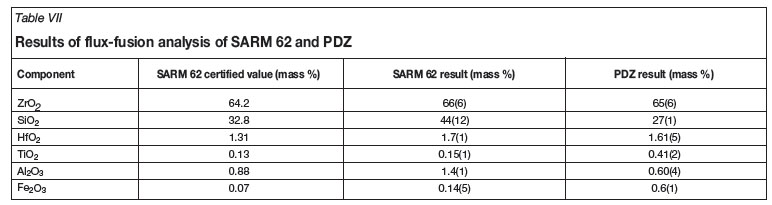
Analysis of the major and minor components of raw zircon as well as plasma-dissociated zircon was undertaken using inductively coupled plasma optical emission spectroscopy (ICP-OES). Microwave-assisted acid extraction as well as flux fusion using lithium tetraborate were investigated as digestion methods. Microwave-assisted acid extraction samples were analysed with matrix-matched standards. The most successful microwave-assisted acid extractions yielded 44.3(1), 49.75(7), 78.3(3) and 90.0(7) per cent recovery for Zr, Hf, Al, and Fe respectively using sulphuric acid. In no instance was acid extraction capable of complete digestion of the sample matrix. A standard addition method was applied to the flux-fusion samples due to the high complexity of the sample matrix. Method validation for the flux fusion procedure was performed using the SARM 62 certified reference material (CRM) with acceptable recovery ranges being based on the 95 per cent confidence intervals of the CRM. Successful analyses were achieved for Zr, Hf, and Ti with apparent content of 66(6), 1.7(1) and 0.15(1) per cent respectively.
Keywords: zircon, zirconium, ICP-OES, analysis, quantification, nuclear grade.
Introduction
Zirconium alloys are extensively used in the nuclear industry as cladding material for nuclear fuel, mainly due to their high mechanical strength, resistance to corrosion at high temperatures, and its low thermal neutron capture cross-section of 0.18 barns. Other uses of zirconium metal include catalysis, optical glasses, ceramics, metallurgical furnaces, surgical appliances, and explosive primers. The element occurs widely in the lithosphere (0.02 per cent), with approximately 0.026 µg/l in sea water and 130 mg/kg within the Earth's crust1, and is present in more than 140 recognized mineral species including kosnarite, zircon (ZrSiO4) and baddeleyite (ZrO2)2. The latter was historically the main feedstock for Zr, but this mineral is virtually unobtainable and is currently produced by only one mine in Russia. The depletion of this natural source of Zr forced the industry to shift to zircon, with a ZrO2 content of approximately 64 per cent, as main source of zirconium. The development of the Richards Bay beach sands operation in the late 1970s, startup of the Namakwa Sands mine in 1995, and the commencement of operations by Ticor in 2001, shifted global zircon production heavily towards South Africa as a major worldwide zircon producer. Currently South Africa and Australia account for approximately 66 per cent of total supply, with Indonesia and the USA accounting for much of the rest.
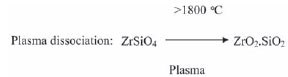
Zircon (ZrSiO4), however, is notorious for its chemical inertness and can be dissolved only by using drastic chemical and physical procedures. These processes include fusion with carbon in a transfered-arc plasma furnace at 2 000ºC3, carbochlorination at elevated temperatures4, zircon cracking with alkalis at 600ºC and higher5, as well as wet chemical treatment with HF6. A novel process to overcome problems with the refining of zircon such as re-contamination and large waste volumes was developed by Necsa with the introduction of a thermal non-transfered-arc plasma process followed by HF treatment7. It is believed that the zircon is melted at the high temperature of the plasma and subsequently moves to a sequencing zone which solidifies the ZrO2 as sub-micrometre monoclinic crystallites in an amorphous SiO2 glass. Research indicates that the microstructure of plasma-dissociated zircon (PDZ, indicated as ZrO2.SiO2) is greatly influenced by cooling rate after melting8,9,10.
This PDZ is much more reactive, and more easily purified and the converse to different salts using chemical techniques7. Results also indicated that the plasma treatment of the zircon changed its physical properties, but not its chemical composition. Analysis of both zircon and PDZ by X-ray flourescence (XRF) indicated an identical chemical composition of the zircon before and after treatment with the plasma, for 11 elements that were analysed11.
Increasing demand for high-purity zirconia (99.9 per cent ZrO2 or better) particularly for use in the production of partially stabilised zirconia (PSZ) ceramics, for various electronic applications, as well for use in the nuclear industry necessitates the quantification of these impurities at partsper-billion (ppb) scale. Hafnium is the main impurity present in most zircon deposits at levels ranging between 1 and 3 per cent12. Some grades of zircon also contain up to 0.10 per cent TiO2 and 0.05 per cent Fe2O3, and impurities limit its hightemperature applications13. Successful separation processes for Zr and Hf include liquid-liquid separation using methyl isobutyl ketone/NH4SCN14 or tributyl phosphate15, selective crystallization of K2ZrF6 and K2HfF616, anion exchange with Aliquot 336 and toluene17, and sublimation of ZrF4/HfF418.
The detection and quantification of impurities in zircon and the subsequent beneficiation of zirconium in the different separation steps is essential to ensure the quality of the final product. Spectrophotometric methods19 for the quantification of zirconium have been obtained with a variety of chemical reagents such as Arsenazo III, phenyl fluorone, xylenol orange and 3-hydroxy-2-(2'-thienyl)-4H-chromon4-one, as well as with the use of electrothermal vaporization in a graphite furnace and atomic absorption spectroscopy (GFAAS)20. The use of GFAAS allows for the determination of impurities that may be present in high-purity materials, usually without the need for further treatment as no colouring reagents are required. Similarly inductively coupled plasma-optical emission spectrometry (ICP-OES) has been employed to determine the trace impurities present in zirconia21, while X-ray flourescence (XRF) has been used to compare the chemical composition of PDZ11 and untreated zircon. There are, however, no published methods for the determination of both major and minor components in a zircon matrix.
One of the biggest challenges to the wet chemical analysis of zircon is its encapsulation in the silica glass, which is extremely resistant to chemical attack. The most effective method of zircon dissolution is the use of hydrofluoric acid22 due to its well-known ability to react with SiO2, which is also part of the zircon matrix. This method, however, is hazardous due to the inherent dangers of hydrofluoric acid23 as well as its ability to damage glass components in spectrometers such as ICP's.
Owing to the hazardous and environmentally unfriendly nature of HF, as well as the fact that it reacts with the glass components of the equipment such as the ICP, it was decided to try and develop an alternative digestion method. Both flux-fusion and microwave assisted acid extraction were investigated as alternative digestion methods for both naturally occurring zircon as well as PDZ. It was also the aim to try and develop a one-step wet analytical procedure for the quantification of the majority of elements, major and minor, present in zircon ore. In this respect is was decided to use ICP-OES as the analytical method due to its high sample throughput rate, the need for one set of standards with standard addition, low level of interference, extensive linear dynamic range, and multi-element detection capability24,25.
Experimental
Instrumentation and reagents
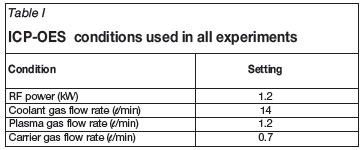
A Shimadzu ICPS-7510 ICP-OES sequential plasma spectrometer was used for all analytical determinations. The conditions of the plasma in the ICP-OES instrument are given in Table I. These conditions were maintained for all experimental results reported here. Flux fusions were performed in a high-temperature oven supplied by Labequip. An Anton Paar Multiwave 3000 supplied by Industrial Analytical along with two rotors, one with eight polytetrafluoraethylene (PTFE) and the other with eight quartz sample vessels, was used for microwave-assisted acid extractions. A Varian Cary 50 Conc UV-Visible spectrometer with quartz cuvettes (path length: 1 cm) was used for UV-Vis analyses. Brand Transferpette® S micro-pipettes were supplied by Sigma Aldrich. All element standards were supplied by Merck and included a 1 000 ppm Hf standard, both 1 000 ppm and 10 000 ppm Zr standards, a 1 000 ppm Ti standard, a 1 000 ppm Si standard as well as the Merck XXVI multi standard containing 1 000 ppm each of Al, Fe, Cr, Ca, Mg, B, Li, and several other elements not used in this study. Spectroflux 100 containing lithium tetraborate was bought from Johnson Matthey Materials Technology. Analytical grade sulphuric acid 95-98 per cent A.C.S. reagent were supplied by Sigma-Aldrichs while analytical grade 65 per cent nitric acid and 32 per cent hydrochloric acid were provided by Merck. The SARM 62 certified reference material was sourced from Industrial Analytical (composition is given in Table VII), while the PDZ was supplied by the South African Nuclear Energy Corporation Limited (Necsa). Both of these samples were ground to an average particle size of 5 µm for consistency. The water used during this study was double distilled and checked for impurities in triplicate before use in the ICP-OES apparatus. Results obtained indicated the absence of any significant amount of metals. Grade B volumetric flasks and glassware were used in all cases, and these were obtained from Merck.
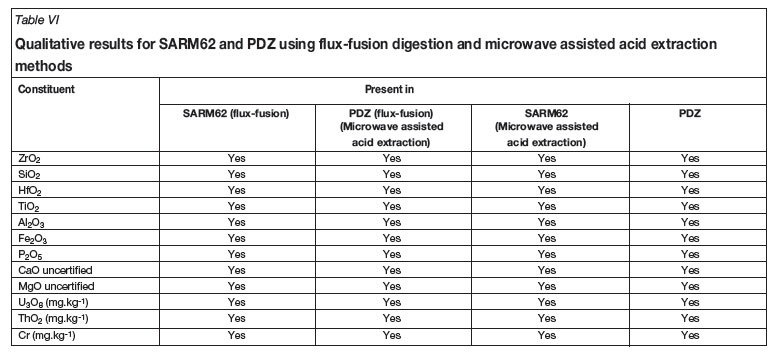
The presence of the different elements in the zircon samples was verified with a qualitative scanning program incorporated in the ICPs software. Their presence was monitored at each element's most intense emission wavelengths, and elements were considered present if they exhibited strong emission at three of the chosen wavelengths. Elements that did not exhibit all the characteristic lines were considered to be entirely absent or below the instrument's limit of detection26. All ICP-OES results given are the average of three individual replicate readings taken sequentially. These readings were accepted only if the standard deviation of the set was less than two orders of magnitude smaller than the average of the readings.
Determination of detection limits
Five 100 ml samples containing 0.4, 1, 2, 5, and 10 ppm of each element respectively, except for Zr, the concentrations for which were 10, 20, 30, 40, and 50 ppm, were made up, along with a blank, using 5 ml 65 per cent nitric acid as matrix. The calibration curve was drawn and the detection limits were calculated. Detection limits (LLOD - lower limit of detection) for the elements that were analyzed were determined using the equation:

where DL is the detection limit, SDb is the standard deviation of 10 replicate readings of the blank solution, and m is the gradient of the calibration curve. Quantification limits (LLOQ - lower limit of quantification) are ten times the LLOD.
Microwave digestion - general experimental conditions
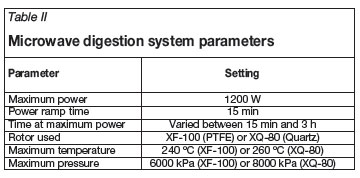
All reagents and the sample were placed within the reaction vessels of the microwave heating rotor and were then tightly sealed and subjected to a set heating programme. Unless otherwise stated, 10 ml sulphuric acid was used as extracting agent. Approximately 15 minutes at 1 200 W applied power was required for the samples to reach maximum temperature. The time that the samples were allowed to remain under full power microwave irradiation was varied between 15 minutes and 3 hours. Upon completion of the microwave programme the samples were allowed to cool and then diluted with approximately 20 ml of distilled water. These solutions were then quantitatively transferred with filtering into 100 ml volumetric flasks. The flasks were filled to the mark with distilled water and shaken. The temperature was allowed to stabilize and the flasks were again filled to the mark. All samples were analysed using ICP-OES and an external calibration curve that was matrix-matched as far as possible. The external calibration curve was drawn using a minimum of 5 standards containing between 0.4 and 20 ppm of the elements analysed for (Zr, Hf, Si, Ti, Fe, Al). Matrix matching was sufficient as the sample matrix was not particularly complex. Table II shows the variables for the microwave digestion system.
Microwave assisted acid extraction-influence of different digestion reagents
Initial microwave dissolution experiments were conducted to determine which conditions might prove to be most favourable for acid dissolution. Samples of approximately 0.4 g of either SARM 62 or PDZ were accurately weighed off and each quantitatively transferred to a different microwave vessel. Different potential dissolution reagents, which include a variety of acids, an alkali, and a salt21 (see Table IV) were added to the vessels and exposed to microwave digestion to determine their effect on these zircon-based samples. The conditions of the experiment were 315 W for fifteen minutes, 630 W for 30 minutes using the XF-100 PTFE rotor as in the literature21. The maximum temperature and pressure reached by each individual sample was dependent upon which reagents were present and the boiling points of the various components and additives in the sample. The samples containing water reached maximum pressure while those without reached maximum temperature. The results for this procedure are presented in Table IV.
Microwave digestion-influence of digestion time
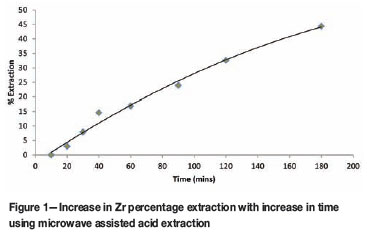
The effect of time on the degree of success of the extraction was investigated. Approximately 0.1 g of PDZ was weighed accurately and then subjected to microwave heating with 10 ml sulphuric acid (the reagent that achieved the most successful extraction of Zr and Hf in initial tests) at 900 W for varying time intervals (ranging from 10 to 180 minutes). The conditions in the reaction vessels achieved a temperature of ca. 260ºC and 8 000 kPa pressure using the XQ-80 rotor. The heating programme used in the previous experiment was abandoned as the extraction achieved was significantly less than expected, probably due to the difference in sample matrix. The results for this procedure are presented in Figure 1.
Microwave assisted acid extraction-influence of sample mass to reagent volume ratio
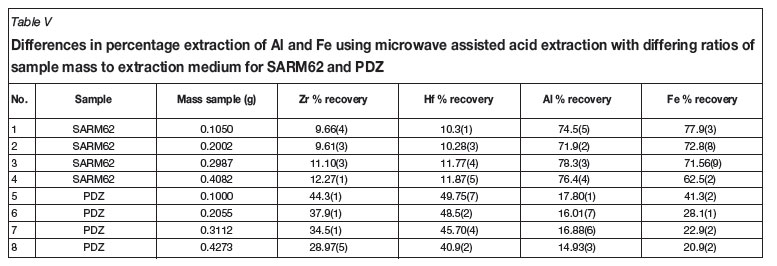
A third set of digestion experiments was undertaken to determine if the degree of success of the extraction was dependent upon the ratio of sample mass to volume of extraction media. Increasing masses of both SARM 62 reference material and PDZ were subjected to microwave heating with 10 ml sulphuric acid (the reagent which achieved the most successful extraction of Zr and Hf in initial tests) at 1 200 W microwave power for 3 hours. The conditions in the reaction vessels achieved ca. 240ºC and 6 000 kPa pressure. The previous experiment showed evidence that extraction began only after 10 and before 20 minutes, indicating temperature dependence, thus the power was increased to achieve that temperature faster. Results for this procedure are presented in Table V and Figure 2.
Zircon dissolution using flux-fusion method
Approximately 0.2 g of zircon (SARM 62 certified reference material) was weighed accurately and placed in a platinum crucible. To this was added approximately 2 g of lithium tetraborate fluxing reagent, and the crucible was placed in high temperature oven set to 1 100ºC for at least 4 hours. Digestion was considered complete when no solids were visible within the transparent melt. Upon complete digestion the platinum crucible was removed from the oven and immediately cooled by direct contact with distilled water in a water bath in order to crack the melt, facilitating faster dissolution times. Table VII shows the results of 7 replicate analyses.
Preparation of standard addition standards using flux-fusion digested samples
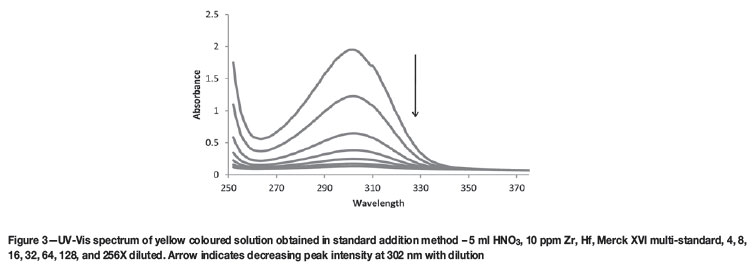
The crucible was placed in a plastic container filled with 150 ml 3.25 per cent nitric acid solution and stired until complete dissolution of the sample was achieved. This solution was transferred quantitatively to a 200 ml glass volumetric flask and filled to the mark with distilled water. 5 ml 65 per cent nitric acid and 10 ml of sample solution was added to each of five 100 ml glass volumetric flasks. Standard solutions were added to each of these flasks to make concentrations of 1, 2, 3, 4, and 5 ppm respectively of Hf, Al, Si, Ti, and Fe, and volumes of Zr standard were added to make concentrations of 10, 20, 30, 40, and 50 ppm. The solution obtained an intense yellow colour (see Figure 3) after the addition of all the standards, but the yellow colour disappeared upon the addition of water to the mark. Results indicated (see Discussion) that the solutions required approximately 12 hours to stabilize before ICP-OES analysis to ensure adequate analytical results could be obtained. The entire procedure was repeated seven times on seven different days. The wavelengths used to qualify and quantify the selected elements are given in Table III. In all cases the most intense emission wavelength (line order 1) proved effective in quantifying its associated element. Interferences were checked for by qualifying at the characteristic wavelengths (e.g. 343.823, 339.198, and 349.621 nm for Zr) of each element using high-concentration samples of each other element. No interferences were observed on any of the lines shown in Table III.
Discussion
The presence of each element specified in the SARM62 certified reference material was confirmed qualitatively (see Table VI) using the three most intense emission wavelengths specified in Table III for both SARM 62 and PDZ using both digestion methods. The six analysed elements (Zr, Hf, Si, Ti, Al, and Fe) were focused on as they were the metals present in major and minor quantities. The certified values for each element present in SARM 62 are given in Table VII as stated in the SARM 62 certification documentation. The trace level elements were present but were not quantified due to their extremely low concentration and erratic instrument response.
As seen in Table III, excellent detection limits were achieved for the elements under scrutiny. Quantification limits were between 0.89 ppb (Ti) and 57.98 ppb (Hf) for the different elements present in the matrix of these materials. The presence of Zr, the primary metal of interest, can be quantified at levels as low as 4.4 ppb. This is comparable to or better than known quantification limits, these being approximately 71 ppb26 and between 9 and 3 ppb (read radially and axially), respectively27.
Microwave assisted acid extraction of the zirconia in PDZ proved to be significantly less successful than claimed in the literature21. (NH4)2SO4 was tested as an additive, as this salt was shown to significantly improve zirconia decomposition in the literature. The conditions used in the preliminary microwave extraction (Table IV) were chosen as they reflected the optimum conditions for extraction as obtained from the literature. The most successful extraction achieved only 44.3(1) per cent for Zr and 49.75(7) per cent for Hf from PDZ (see Table V). Only extraction solutions containing concentrated H2SO4 were able to achieve even moderate success in this regard, with NaOH and aqua regia achieving only 0.196(4) and 0.0298(4) per cent extraction of Zr respectively, again from PDZ. The most successful extraction from on the normal zircon sample, again using H2SO4, was only 6.41(2) and 7.2(1) percent respectively for Zr and Hf (see Table V), showing the PDZ to be more chemically amenable to acid extraction by pure concentrated H2SO4. SARM 62, however, showed higher extraction than the PDZ when using the (NH4)2SO4 salt reagent, with recoveries (for Zr and Hf respectively) of 4.58(2) and 4.1(2) per cent for zircon as opposed to 1.529(4) and 1.6(1) per cent for PDZ. The extraction of Fe and Al also appeared to be more successful from the zircon sample than from the PDZ (see Table V). A possible explanation for this is that the Al and Fe are simply adsorbed onto the surface of the crystal matrix of the zircon, while being included into the body of the amorphous silica and crystalline zirconia found in the PDZ, due to the plasma dissociation process itself.
Figure 1 shows the relationship between percentage extraction of zirconium for PDZ and the amount of time each sample was subjected to microwave radiation. Almost no extraction is observed before 10 minutes of heating, indicating that extraction does not occur before a specific threshold temperature, pressure or both. After 20 minutes the extraction proceeds quickly and increased almost linearly up to approximately 40 minutes, after which the rate appears to begin to decrease. Extrapolation of the curve indicated that, if the trend was followed, maximum extraction would reach roughly 53 per cent at approximately 300 minutes. 180 minutes and 44.4(1) per cent was chosen as a good middle ground for further experimental work, as longer times in the microwave have been known to cause damage to the rotor and sample vessels.
As can be seen in Figure 2, the smaller the quantity of sample the higher the degree of extraction of Zr and Hf from PDZ, with significantly better extraction being achieved from the PDZ than from SARM 62 using microwave assisted acid extraction with pure concentrated H2SO4. This can be attributed to the greater amenability of the zirconia in the PDZ to this type of acid dissolution, as opposed to the zircon in SARM 62. Figure 2 shows a linear relationship between sample mass and percentage recovery when samples are subjected to microwave assisted sulphuric acid extraction under identical conditions. The negative slope of the PDZ recovery trends may indicate that the sulphuric acid has a decreasing ability to dissolve Zr and Hf as the concentrations of each of these elements increases in solution.
It was concluded that at this time, microwave assisted acid extraction would not be effective for quantitative analysis of zircon or PDZ, although it may prove to be the basis for an effective extraction and purification procedure. Sulphuric acid, while not the safest acid to work with, is significantly less hazardous than hydrofluoric acid and a method using it would be extremely beneficial. Between 49.4(1) and 90.0(7) per cent of Al and Fe were extracted from the zircon sample with minimal extraction of Zr and Hf using various combinations of sulphuric acid, ammonium sulphate, and water, as seen in Table IV. Further investigation into this possibility may be warranted.
The use of a lithium tetraborate flux-fusion on PDZ and SARM 62 certified reference material succeeded in the total dissolution of both samples, these being representative of the raw material and first-stage refining product respectively in the prospective production process of high-purity zirconium metal. A standard addition method was successfully employed to determine the majority of the elements present in the certified reference material (SARM 62) and PDZ after fusion (see Tables VI and VII). The flux was analysed for possible interfering contaminations, but concentrations of all elements of interest (Zr, Hf, Al, Fe) were below the limit of detection, even at concentrations of lithium tetraborate far higher than in the samples.
The yellow colour observed during the preparation of the standard addition samples was observed only when the primary standard solutions were dissolved in concentrated acid. The colour disappeared almost immediately upon dilution beyond a factor of 4. In Figure 3, the sample was diluted 1:3 with distilled water in order to obtain a welldefined peak. Lower dilution factors resulted in a peak that was too intense and thus over-ranged the UV-Vis instrument, while a greater dilution factor resulted in no peak whatsoever. The colour is possibly a result of the high concentration of transition metals dissolved in concentrated acid forming coloured complexes that dissociate upon dilution. Initially flux-fusion samples were analysed immediately upon dissolution, resulting in a standard addition curve with R2 values of approximately 0.5, which indicates an almost complete lack of linearity. It was discovered that leaving the solutions to stabilize overnight resulted in significantly improved results, with R2 values of better than 0.999, which satisfies the requirement of at least 0.997 for linearity. This may be due to the formation of refractory complexes at high reagent concentration, which then take time to dissociate. Another possibility is the presence of slight thermal differences in the samples arising during dilution with acid, which cause differences in viscosity when the samples enter the spray chamber of the ICP-OES. Results for this method over 7 replicate analyses are given in Table VII.
The 95 per cent confidence interval given for the SARM 62 certified reference material displayed a relative margin of error of approximately 4-6 per cent for the major components (Zr, Si) and 20-30 per cent for the minor components (Hf, Ti, Fe, Al). It was decided that quantitative results within these ranges would be acceptable in confirming the accuracy of the method.
The method shows a high degree of linearity in its calibration curves (R2 values better than 0.999 in all cases) as well as an acceptable level of precision for most elements, considering the matrix involved. Acceptable accuracy was obtained for zirconium (66(6) per cent), hafnium (1.7(1) per cent), and titanium (0.15(1) per cent) with these results being within the ranges set out in the objectives. Other elements show lower levels of accuracy, especially for silicon, which was outside the 4-6 per cent acceptable range of error, which illustrates the difficulty of analysing zirconium silicate samples. Similar results were achieved for the PDZ samples, but with significantly more accurate recoveries for silicon (27(1) per cent). The differences between the results for the minor constituents, such as aluminium and iron, for SARM 62 and PDZ are likely due to their being sourced from different locations. The apparently large recovery errors seen in the minor elements are deceptive, as the actual error is in fact quite small and appears large only in comparison to the very low concentrations of these elements.
Conclusion
Of the two digestion procedures attempted, the more successful is obviously the flux-fusion method due to its ability to completely dissolve the zircon and PDZ matrix without subsequent precipitation of Si as is the case with other alkali fluxes. The disadvantage of this method is the massive contamination of the sample with Li and B, making analysis for these elements impossible and necessitating the use of a standard addition technique for other elements. The accuracy of the results obtained for Zr, Hf, Al, and Ti fell within the acceptable range laid out before commencement of the investigation. However ,the level of precision observed necessitates a large number of repeated measurements, which is less than ideal and warrants further refinement. Si and Fe recoveries lie outside the acceptable accuracy range, and the high relative standard deviations observed indicate the possibility of sample contamination, despite our efforts to avoid this. Non-homogeneity of the samples is unlikely as they were ground to less than 5 µm average particle size and mixed thoroughly.
The microwave assisted acid extraction was significantly less successful in providing a quantitative analytical method. This is likely due to the complete insolubility of silica and zircon (silica matrix) in all reagents apart from hydrofluoric acid. However, the high degree of extraction of Fe and Al from the zircon sample as well as the significant recovery of Zr and Hf from PDZ may indicate a possible use in purification of zirconium, with an initial acid extraction step to remove the majority of the impurities before plasma dissociation, followed by a second extraction to remove the bulk of the Zr and Hf content from the PDZ.
References
1. PETERSON, J. and MACDONELL, M. Radiological and Chemical Fact Sheets to Support Health Risk Analyses for Contaminated Areas, Argonne National Laboratory. http://www.evs.anl.gov/pub/doc/ANL_ContaminantFact Sheets_All_070418.pdf. Accessed 9 July 2010. pp. 64-65. [ Links ]
2. RALPH, J. and CHAU, I. Minerals that include Zr, Mindat.org. http://www.mindat.org/chemsearch.php?inc=Zr%2C&exc=&sub=Search+for+Minerals. Accessed 9 July 2010.
3. WILKS, P.H., RAVINDER, P., GRANT, C.L., PELTON, P.A., DOWNER, R.J, and TALBOT, M.L. Chemical Engineering Progress, vol. 68, no. 4, 1972. p. 82. [ Links ]
4. MANICH, A.A., SCOTT, D.S., and SPINK, D.R. Canadian Journal of Chemical Engineering, vol. 52, 1974. p. 507. [ Links ]
5. KRISHNAN, T.S., BABU, R.S., and GUPTA, C.K. Extended abstracts, Zirconia 86. Ceram. Soc. Jpn. (1986), pp. 200-201. [ Links ]
6. NEL, J.T. Process for reacting a zirconia based material, U.S. Patent, 5,958,355 (1999). [ Links ]
7. WILKS, P.H., RAVINDER, P., GRANT, C.L., PELTON, P.A., DOWNER, R.J., and TALBOT, M.L. Chemical Engineering World, vol. 9, 1974. p. 59. [ Links ]
8. MCPHERSON, R., RAO, R., and SHAFER, B.V. The reassociation of plasma dissociated zircon. Journal of Materials Science, vol. 20, 1985. pp. 2597-2602. [ Links ]
9. KAISER, A., LOBERT, M., and TELLE, R. Thermal stability of zircon (ZrSiO4). Journal of the European Ceramic Society, vol. 28, 2008. pp. 2199-2211. [ Links ]
10. SNYDERS, E., POTGIETER, J.H., and NEL, J.T. The effect of milling and percentage conversion of plasma dissociated zircon on the colour of Pryellow and V-blue zirconium pigments. Journal of the European Ceramic Society, 26, 9, 2006, pp. 1599-1603. [ Links ]
11. SKIDMORE, C. Zirconium and Hafnium. MinChem Ltd UK. www.mmta.co.uk/uploaded_files/Zirconium%20Hafnium.pdf. Accessed 16 July 2010. [ Links ]
12. POPA, M., KAKIHANA, M., YOSHIMURA, M., and CALDERÓN-MORENO, J. M. Zircon formation from amorphous powder and melt in the silica-rich region of the alumina-silica-zirconia system. Journal of Non-Crystalline Solids, vol. 352, no. 52-54, 2006. pp. 5663-5669. [ Links ]
13. SARBECK, L.E. Zirconium-Hafnium Seperation Process, United States Patent 5,176,878, 1993. [ Links ]
14. TAGHIZADEH, M., GHASEMZADEH, R., ASHRAFIZADEH, S.N., SABERYAN, K., and MARAGHEH, M. G. Determination of optimum process conditions for the extraction and separation of zirconium and hafnium by solvent extraction. Hydrometallurgy, vol. 90, no. 2-4, February 2008. pp. 115-120. [ Links ]
15. KUMAR, J. R., REDDY, B. R., and REDDY, A. V. doi:10.1016/j.talanta.2010.06.013. Accessed 16 July 2010. [ Links ].
16. PORIEL, L., FAVRE-RÉGUILLON, A., PELLET-ROSTAING, S., and LEMAIRE, M. Zirconium and hafnium separation, part 1. Liquid/liquid extraction in hydrochloric acid aqueius solution with Aliquat 336. Separation Science and Technology, vol. 41,2006. pp. 1927-1940. [ Links ]
17. KOTSAR, M.L., BATEEV, V.B., BASKOV, P.B., SAKHAROV, V.V., FEDOROV, V.D., and SHATALOV, V.V. Preparation of high purity ZrF4 and HfF4 for optical fibers and radiation-resistant glasses. Inorganic Materials, vol. 37, no. 10, 2001. pp. 1085-1091. Translated from Neorganicheskie Materialy, vol. 37, no. 10, 2001. pp. 1271-1277. [ Links ]
18. DALAWAT, D.S., CHAUHAN, R.S., and GOSWAMI, A.K. Review of Spectrophotometric methods for determination of zirconium. Reviews in Analytical Chemistry, vol. 24, no. 2, 2005. pp. 75-102. [ Links ]
19. JAGANATHAN, J., EWING, K.J., and BUCKLEY, E.A. Quantitative determination of nickel and copper in zirconium fluoride using graphite furnace atomic absorption spectrophotometry. Microchemical Journal, vol. 41, 1990. pp. 106-112. [ Links ]
20. XIAOGUO, MA. and YIBING, LI. Determination of trace impurities in highpurity zirconium dioxide by inductively coupled plasma atomic emission spectrometry using microwave-assisted digestion and wavelet transformbased correction procedure, Analytica Chimica Acta, vol. 579, 2006. pp. 47-52. [ Links ]
21. SKOOG, D.A., WEST, D,M., HOLLER, F.J., and CROUCH, S.R. Fundamentals of Analytical Chemistry, 8th edn., Belmont, 2004, p. 1044. [ Links ]
22. Portland State University. Hydrofluoricacid. http://www.pdx.edu/safety/www.pdx.edu.fap/files/hydrofluoricacid.pdf. Accessed 14 July 2010. [ Links ]
23. BOSS, C.B. and FREDEEN, K.J. Concepts, Instrumentation and Techniques in Inductively Coupled Plasma Optical Emission Spectrometry. Pertein Elmer, Shelton, Connecticut, 2004. [ Links ]
24. SKOOG, D.A., HOLLER, F.J., and CROUCH, S.R. Fundamentals of Analytical Chemistry, 8th edn. Saunders College Publishing, Philadelphia, 2004. pp. 839-865. [ Links ]
25. WINGE, R.K., FASSEL, V.A., PETERSON, V.J., and FLOYD, M.A. Inductively Coupled Plasma-Atomic Emission Spectroscopy-An Atlas of Spectral Information, 6th Impression, Elsevier, Amsterda. 1993. [ Links ]
26. KNOWLES, M.B. The latest advances in axially viewed simultaneous ICP-OES for elemental analysis. Varian Australia. http://www.varianinc.com/image/vimage/docs/applications/apps/icpes01.pdf. Accessed 21 September 2010. [ Links ]
Paper received Dec. 2010; revised paper received Sep. 2011.
© The Southern African Institute of Mining and Metallurgy, 2011. SA ISSN 0038-223X/3.00 + 0.00.

