


Servicios Personalizados
Articulo
 Inglés (pdf)
 Articulo en XML
 Referencias del artículo
Indicadores

Links relacionados
-
 Citado por Google
 -
 Similares en Google
Compartir

 Permalink
Journal of the Southern African Institute of Mining and Metallurgy
versión On-line ISSN 2411-9717
versión impresa ISSN 2225-6253
J. S. Afr. Inst. Min. Metall. vol.111 no.11 Johannesburg nov. 2011
TRANSACTION PAPER
Net present value maximization model for optimum cut-off grade policy of open pit mining operations
M.W.A. AsadI; E. TopalII
IMining and Materials Engineering, McGill University, Canada
IIMining Engineering and Mine Surveying, Western Australia School of Mines, Curtin University of Technology
SYNOPSIS
The optimum cut-off grade policy maximizes the net present value (NPV) of an open pit mining operation subject to the mining, processing, and refining capacity constraints. The traditional approaches to cut-off grade determination ignore the escalation of the economic parameters such as metal price and operating costs during life of an operation, and consequently lead to unrealistically higher values of the objective function. Further, the NPV of a mining operation declines due to the depletion of the available reserves, causing a decline in the optimum cut-off grade, i.e. higher cut-off grades in the early years of an operation and lower cut-off grades during the later years. Hence, low grade material mined in the earlier years may be stockpiled for processing during later years to offset the effect of escalating economic parameters on NPV. This paper demonstrates the combined impact of introducing economic parameters, escalation and stockpiling options into the cut-off grade optimization model. The model promises an enhancement in NPV as illustrated in a case study incorporating practical aspects of an open pit mining operation.
Keywords: mining, modelling, cut-off grade, stockpiling, optimization.
Introduction
Cut-off grade is the criterion that discriminates between ore and waste within a given mineral deposit1,2. If material grade in the mineral deposit is above cut-off grade it is classified as ore, and if material grade is below cut-off grade, it is classified as waste. Ore, being the economically exploitable portion of the mineral deposit, is sent to the processing plant for crushing, grinding, and concentration of the metal content. The product of the processing plant is called concentrate, which is fed to the refinery for production of refined metal. Hence, an ideal open pit mining operation consists of three stages i.e. mine, processing plant, and refinery3,4.
Long-range production planing of an open pit mining operation is dependent upon several factors; however, cut-off grade is the most significant aspect, as it provides a basis for the determination of the quantity of ore and waste in a given period5. Eventually, the profit over time may be enhanced only by flow of high grade material to the processing plant. This strategy supports the objective function and, depending upon the grade-tonnage distribution of the deposit, higher NPV may be realized during earlier years to recover the initial investment6,7. However, as the deposit becomes depleted, the NPV as well as the cutoff grade decline; hence, cut-off grade policy and the production plan defined as a result of this policy dictate phenomenal influence on the overall economics of the mining operation8,9.
The optimum cut-off grades, which are dynamic due to the declining effect of NPV, not only depend on the metal price and cash costs of mining, processing, and refining stages, but also take into account the limiting capacities of these stages and grade-tonnage distribution of the deposit. Therefore, the technique that determines the optimum cut-off grade policy considers the opportunity cost of not receiving future cash flows earlier during mine life, due to the limiting capacities of any of mining, processing, or refining stages10,11. However, metal price and operating costs of mining, processing, and refining change during mine life, and this happens quite often, due to the longer life of most of the open pit mining operations. Ignoring the effect of these changes in the economic parameters on the optimum cut-off grade policy would lead to unrealistic production plans12,13.
Further, the declining effect of NPV allows higher cut-off grades in the early years of mine life and lower cut-off grades in the later years, due to depletion of high grade material. Therefore, depending upon the existing circumstances in an open pit mining operation, the production plans may also include the flexibility of providing stockpiles of low grade ore mined in the earlier years to be processed later as it becomes economical to do so. This enhances not only the life, but also the NPV of a mining operation. The management of stockpiles of low grade ore is possible using the following two options14:
1. The stockpile is utilized parallel to the mining operation. This means that material is sent to the processing plant either from mine or stockpile. This decision is based on the overall economy/profitability of the operation.
2. The stockpile is utilized after the mine is exhausted. This simplifies the decision-making, since the stockpile acts as an additional portion of the deposit, where all available material is economical. However, the high grade material in the stockpile is scheduled to be utilized earlier than the low grade material.
In this study, the second case is chosen owing to ease of operation. Therefore, keeping in view the prospect of a contribution to the mining industry, we propose an extension in the established Lane's theory of optimum cut-off grades15,16. The proposed cut-off grade optimization model considers not only dynamic metal price and cost escalation, but also results in the creation of a stockpile of low grade ore during the mine life and its utilization as ore after the exhaustion of the deposit. Lane's original theory has been modified by Dagdelen3,4, Dagdelen and Kawahta6, Bascetin9, Osanloo and Ataei11, Asad12,13,14, Dagdelen and Asad17, Ataei and Osanloo18, Osanloo et al.19, and King20, but these studies did not attempt to analyse the combined impact of economic parameters escalation and stockpiling on NPV. We implement the iterative algorithmic steps of the modified model in Visual C++ programming language to develop alternative cut-off grade policies in a case study of a hypothetical copper deposit. The results demonstrate the effect of the change in economic parameters and the stockpiling option on mine planning with an increase/decrease in NPV.
The model
Prerequisites for the application of a cut-off grade optimization model include the development of ultimate pit limit or pit extent and pushback (a manageable portion of the deposit inside the ultimate pit limit that may be mined, processed, and refined in a number of years/periods) design, ore reserves in terms of mineral grade and tonnage distribution in each pushback, and mining, processing, and refining stage capacities, the operating costs of these stages, and the current metal price.
The objective function of cut-off grade optimization model is to maximize the NPV of the operation subject to mining, processing, refining, and stockpile capacity constraints, which may be represented mathematically as follows:
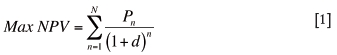
Subject to:
Here,

where n = period (year) indicator, N = total life of operation (years), Nm = mine/deposit life (years), P = profit ($/year), d = discount rate (%), M = mining capacity (tons/year), C = concentrating or milling capacity (tons/year), R = refining capacity (tons /year), S = stockpile capacity (tons), p = metal selling price ($/ton of product), m = mining cost ($/ton of material mined), c = concentrating or milling cost ($/ton of ore), r = refining cost ($/ton of product), f = administrative/ fixed cost ($/year), Qm = quantity of material mined (tons/year), Qc = quantity of ore processed (tons/year), Qr = quantity of concentrate refined (tons /year), Qs = quantity of material stockpiled (tons/year).
The model relies on the fact that the capacities of the mining, processing, and refining stages limit the operation either independently or jointly. While an individual stage causes constrained production, it leads to the determination of refinery limiting economic cut-off grades for mining, processing, and refining, represented as γm, γc, and γr, respectively. However, if a pair of stages is limiting the operation, then the output from each constraining stage must be balanced to utilize the maximum capacity of these stages. This requires the determination of three balancing cut-off grades pairing mine-processing plant, mine-refinery, and processing plant-refinery, represented as γmc, γmr, and γcr, respectively. Ultimately, the optimum cut-off grade γ is selected between the limiting economic and balancing cut-off grades.
As the grade and amount of low grade stockpile material in a period n is also dependent upon the determination of optimum cut-off grade, the solution to this problem may be presented in two sequential steps. The first step determines the optimum cut-off grade, and the second step defines the grade and amount of stockpile material.
Optimum cut-off grade
Dynamic metal prices and operating costs influence limiting economic cut-off grades, while the grade-tonnage distribution of the deposit is the only factor affecting balancing cut-off grades13. The optimum cut-off grade among six limiting economic and balancing cut-off grades is calculated as follows:
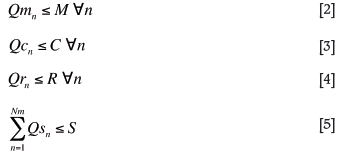
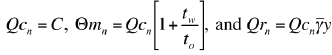
Assuming that the grade-tonnage distribution of a pushback consists of K grade increments i.e. (γ1, γ2), (γ2, γ3), (γ3, γ4), ---, (γK-1, γK), and, for each grade increment, there exist tk tons of material. In general, if k * represents grade increment (γk, γk+1) and the lower grade in k * i.e. γk is considered as the cut-off grade, then quantity of ore to, quantity of waste tw, and the average grade of ore - γ are the given in Equations [7], [8], and [9]:
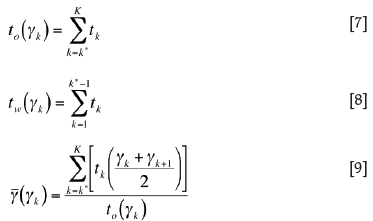
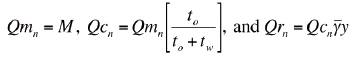
If y is the metallurgical recovery, then Qmn, Qcn, and Qrnare sequentially determined according to any one of the following three conditions:
1. Set:
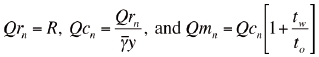
2. If Qcn> C or Qrn> R from condition 1, then set:
3. If Qrn> or Qmn> M from condition 2, then set:
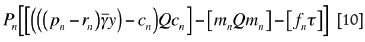
Mining the next Qmn amount of material may require time τ. For calculating the profit generated from Qmnat the end of time τ, Equation [6] may be updated as:
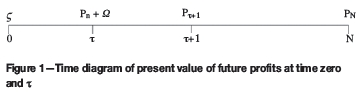
Since the objective function is to maximize the NPV of future profits, assuming that ς is the maximum possible net present value of future profits at time zero (i.e. now) and Ω is the maximum possible net present value of future profits (Pτ+1 to PN) at time τ, then the scenario may be presented as shown on the time diagram in Figure 121.
Knowing the discount rate d:
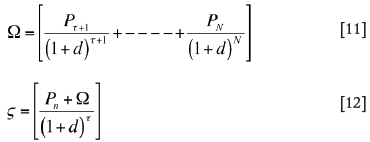
The increase in present value ν is realized through mining the next Qmn of material and the difference of ς and Ω represents this increase. Knowing that τ is the short interval of time, Equation [12] may be written as:

Substituting Equation [10] into Equation [13] yields the basic present value expression that dictates the calculation of the limiting economic cut-off grades:
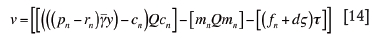
Mining, processing, or refining capacities define time τ, leading to three values depending upon the actual constraining capacity i.e. , respectively.
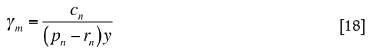
Substituting these values into Equation [14] generates the basic equations for limiting economic cut-off grades:
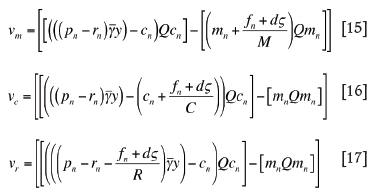
In Equation [15], the mine has a bottleneck that limits the operation and therefore delays the opportunity of achieving future positive cash flows. Hence, the opportunity cost  is distributed per ton of material mined. In this scenario, ore may be processed and refined as soon as material is mined. Therefore, cut-off grade should be such that the processing and refining costs are covered. This shows that every unit of material for which [(pn- rn)γmy] is greater than the processing cost cn, should be classified as ore. Thus, the mine limiting cut-off grade, which invokes constraint 1 (Equation [2]), becomes:
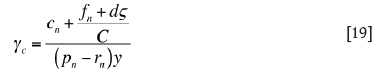
Similarly, in Equation [16] the processing plant has a bottle-neck that delays the operation, and the opportunity cost  is distributed per ton of ore processed. The cut-off grade is chosen such that in addition to processing and refining costs, it pays the opportunity cost of not receiving the future cash flows. Thus, the processing plant limiting cutoff grade, which invokes the second constraint (Equation [3]), becomes:
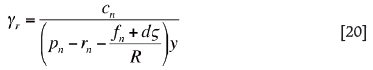
Also, in Equation [17] the refinery is responsible for delaying the future cash flows, and the opportunity cost  is distributed per unit of concentrate refined.
Therefore, the refinery limiting cut-off grade, which invokes the third constraint (Equation [4]), becomes:
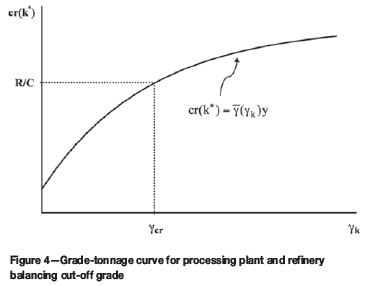
The balancing cut-off grades depend upon the grade tonnage distribution of an individual pushback. Therefore, these cut-off grades are deduced from the grade-tonnage distribution curves representing quantity of ore per unit of material mined, recoverable metal content per unit of material mined, and the recoverable metal content per unit of ore, as given in Figures 2, 3, and 4, respectively.
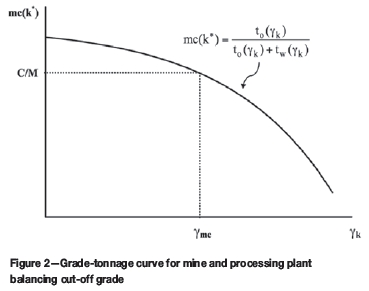
The mine and processing plant balancing cut-off grade is the one which invokes the first and second constraints (Equations [2] and [3]). The mine and processing plant will be in balance when quantity of ore per unit of material mined equals the ratio C/M.
For the grade category k*, the ratio of ore tons to total tons mined, represented as mc(k*) is:
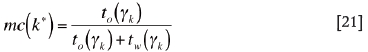
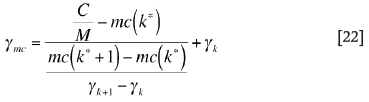
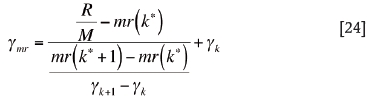
Knowing this ratio, the mine and processing plant balancing cut-off grade is determined from the curve presented in Figure 2. As ratio C/M lies between mc(k *) and mc(k *+1) on the y-axis, the corresponding value on the xaxis representing the mine and processing plant balancing cut-off grade γmc is determined by linear approximation as follows:
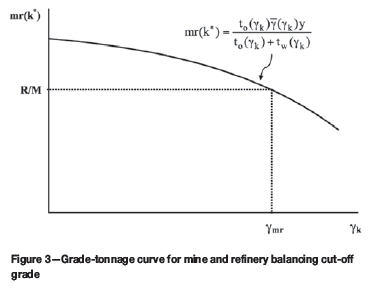
Similarly, the mine and refinery balancing cut-off grade is the one that invokes the first and third constraints (Equations [2] and [4]). The mine and refinery will be in balance when the recoverable metal content per unit of mined material equals the ratio R/M.
For the grade category k*, the ratio of recoverable metal content to the total tons mined, represented as mr(k*) is:
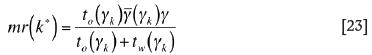
Knowing this ratio, the mine and refinery balancing cutoff grade is determined from the curve presented in Figure 3. As ratio R/M lies between mr(k*) and mr(k*+1) on the yaxis, the corresponding value on the x-axis representing the mine and refinery balancing cut-off grade γmr is determined by linear approximation as follows:
Also, the processing plant and refinery balancing cut-off grade is the one that invokes the second and third constraints (Equations [3] and [4]). Therefore, the processing plant and refinery will be in balance when the recoverable mineral content per unit of ore equals the ratio R/C.
For the grade category k*, the recoverable metal, represented as cr(k*) is:

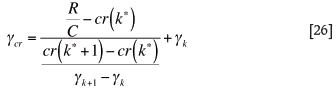
Knowing cr(k*), the processing plant and refinery balancing cut-off grade is determined from the curve presented in Figure 4. As ratio R/C lies between cr(k*) and cr(k*+1) on the y-axis, the corresponding value on x-axis representing the processing plant and refinery balancing cutoff grade γcr is determined by linear approximation as follows:
Once the three limiting economic cut-off grades i.e. γm, γc, and γr, and three balancing cut-off grades i.e. γmc, γmr, and γcr are determined, the optimum cut-off grade γ is selected from among them. The equations of limiting economic cut-off grades reveal that for a mining operation, the optimum cutoff grade may never be less than γm, since it represents the lowest (break even) cut-off grade. Also, the optimum cut-off grade may never exceed γc, since this may schedule some of the valuable ore to the waste dumps. Therefore, the optimum cut-off grade γ lies between γm and γc i.e. γm < γ< γc. If  represents the median value, then the following criterion dictates the selection of the optimum cut-off grade:

Creation of stockpiles
The creation of stockpiles follows the determination of the optimum cut-off grade γ. The optimum cut-off grade classifies the following:
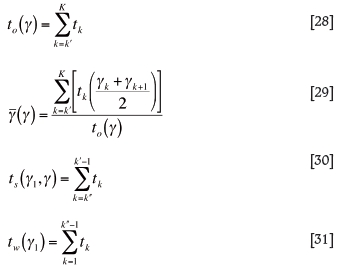
1. The material above optimum cut-off grade i.e. tons of ore to(γ). This material is sent to the processing plant
2. The intermediate grade stockpile material i.e. tons of potential ore between the lowest cut-off grade γ1 and the optimum cut-off grade γ, represented as ts(γ1, γ)
3. The material below the lowest cut-off grade γ1 i.e. tons of waste tw(γ1). This material is sent to the waste dumps.
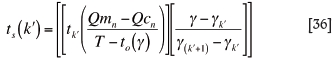
As described in the previous section, the grade-tonnage distribution of the pushback consists of K grade increments i.e. [γ1, γ2], [γ2, γ3], [γ3, γ4],.......,[γK-1, γK], where each grade increment of a pushback consists of tk tons of material. If the optimum cut-off grade γ exists in the k' grade increment i.e. [γk', γk'+1], and the lowest cut-off grade γ1 exists in k'' grade increment i.e. [γk'', γk''+1] and assuming that optimum cut-off grade γ = γk' and lowest cut-off grade γl= γk'', then:
If T represents the total available tons in the pushback, then:

Similarly, the quantities mined Qmn, processed Qcn, and refined Qrn may be defined as a function of optimum cut-off grade γ using the three conditions given in the previous section.
The grade-tonnage distribution of stockpiles i.e. the grade increments and available tons in each grade increment is deduced from the grade-tonnage distribution of the pushback. If α represents the difference between the lowest cut-off grade increment i.e. k'' and that of optimum cut-off grade increment i.e. k', then:

Now, if α > 0, then the stockpile tons for respective grade increments are determined using Equations [34], [35], and [36]:
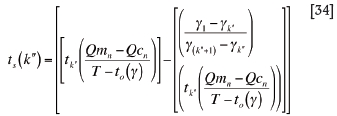
1. The tons of material in the first stockpile grade increment, which is same as that of lowest cut-off grade, i.e. k'', may be determined as:
2. The tons of material in stockpile grade increments from (k''+1) to (k'-1), represented as k''', are:

3. The tons of material in the last stockpile grade increment, which is same as that of the optimum cutoff grade, i.e. k', may be determined as:
Similarly, if α = 0, i.e. the lowest cut-off grade and the optimum cut-off grade exist in the same grade increment, which may be represented as k'''', then the tons of material in the stockpile only grade increment are:
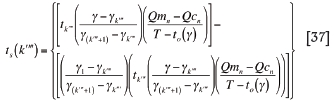
A demonstration of the computations presented in Equations [34], [35], [36], and [37] is offered through an example in the next section.
Copper deposit case study
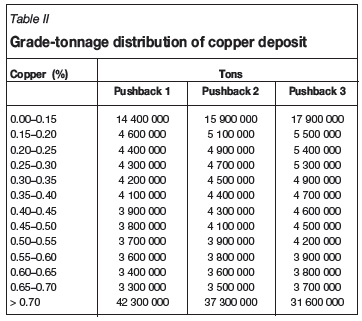
Consider a hypothetical copper deposit divided into three pushbacks15. Table I presents capacities, price of copper, operating costs, and escalation rates for this open pit mining operation. Table II gives the grade-tonnage distribution within ultimate pit limits for all three pushbacks.

The process of determination of the optimum cut-off grade and the creation of stockpiles presented in the previous sections is computation-intensive; therefore a dialogue-based application in Visual C++ implementing the iterative algorithmic steps is used for the development of optimum cut-off grade policies in this case study. The algorithmic iterations continue in anticipation of the NPV convergence, i.e. the calculation of the optimum cut-off grade for a period n is repeated until no further improvement in NPV is possible. A description of these steps is as follows:
1. Set n to 1 and iteration i to 1
2. Compute available reserves Qn. If Qn = 0, then go to step 10, otherwise go to next step
3. If i = 1, set V to 0
4. Set ς = V
5. Compute:
a. γm, γc, γr, γmc, γmr, and γcr
b. γ using Equation [27]
c. to(γ), tw(γ), and
(γ) using Equations [7], [8], and [9], respectively
d. Qmn, Qcn, and Qrn using the conditions described in the model
e. N based on the limiting capacity identified in step 5(d)
f. Pn using Equation [10]
g. V =
.
6. If i = 1, check for ς convergence (i.e. compare V (step 5(g)) with previous V (step 4). If ς is converged (within some tolerance, say $500 000.00), then go to step 7, otherwise go to step 4
7. Knowing γ, compute stockpile grade-tonnage distribution using Equations [34], [35], [36], and [37]
8. Knowing that Qmn is mined and Qcn is processed, adjust the grade-tonnage distribution of the deposit
9. Set n = n + 1 , go to step 2
10. If i = 1, then knowing Pn from period 1 to N, find the Ωn i.e. present value of future cash flows at period n, and go to step 11. If i = 2, then stop
11. Compute the optimum cut-off grades policy using ς = Ωn for corresponding year n, and go to step 4.
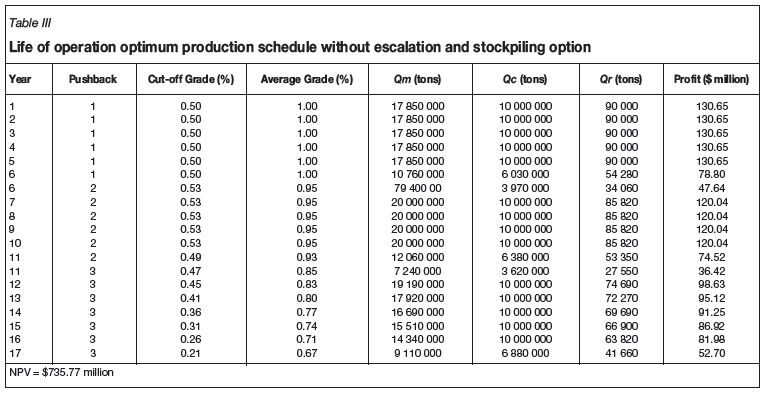
The steps in the algorithm generate alternative policies presented in Tables III, and IV. Table III shows the optimum policy without escalation and stockpile consideration. As indicated in Table III, the optimum cut-off grade in year 1 is 0.50%. At this cut-off grade, 17.85 million tons of material is mined, and 10 million tons of ore is processed which results in 90 000 tons of refined copper. Hence, the operation has excess mining capacity, while processing plant and refinery are limiting the operation. Therefore, 0.50% optimum cut-off grade refers to the processing plant and refinery balancing cut-off grade (Equation [26]). This pattern continues until year 6, and it is worth mentioning that in the same year the reserves in pushback 1 are exhausted and mining from pushback 2 is commenced. From year 7 through year 10, mine and processing plant are limiting the operation and the 0.53% optimum cut-off grade refers to mine and processing plant balancing cut-off grade (Equation [22]). It is worth clarifying that from one year to next, the grade-tonnage distribution dictating the balancing cut-off grades is adjusted uniformly (i.e. without any change in the structure of distribution) among the intervals. Consequently, the optimum cutoff grade corresponding to the limitation of similar pair of stages remains constant as observed from years 1 to 6 and years 7 to 10. Similarly, from year 11 to the life of operation, i.e. year 17, the flow of material from the mine to refinery is limited due to full utilization of the processing plant capacity. Hence, the optimum cut-off grade during these years refers to the processing plant limiting economic cut-off grade (Equation [19]), and it is declining with exhaustion of the reserves and a consequent decline in the present value of the remaining reserves. The objective function, i.e. maximum NPV of the open pit mining operation, is predicted to be $735 770 000 as shown in the optimum policy in Table III.
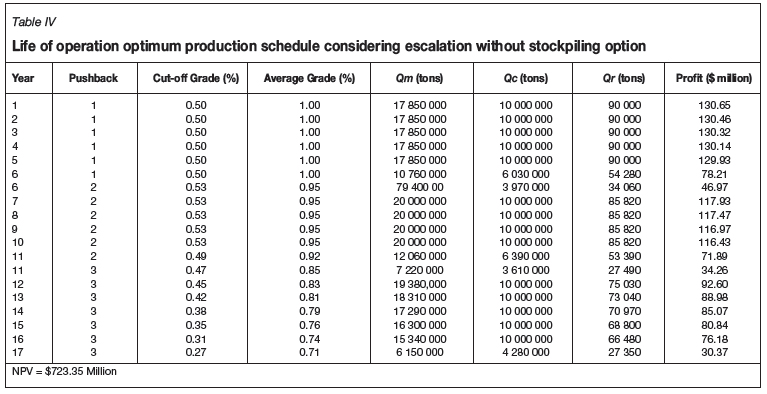
Table IV presents the optimum policy allowing escalation of economic parameters without the stockpiling option. The price escalation is 0.80% per year, which indicates that in year 1 the metal price is $2100.00 per ton of copper.
However, it escalates to $2405.00 per ton of copper in year 17. Similarly, operating and fixed costs escalate from year 1 through year 17. As specified in Table IV, the trend of optimum cut-off grades from years 1 through 17 follows the same model as presented in the previous policy. However, the minimum optimum cut-off grade has increased from 0.21% to 0.27% in year 17. This shows that the operation ensures flow of comparatively high grade material even in the final years to pay off the escalated operating and fixed costs. The impact of price and cost escalation leads to 1.7% decrease in maximum NPV in year 1, i.e. from $735 770 000 to $723 350 000.
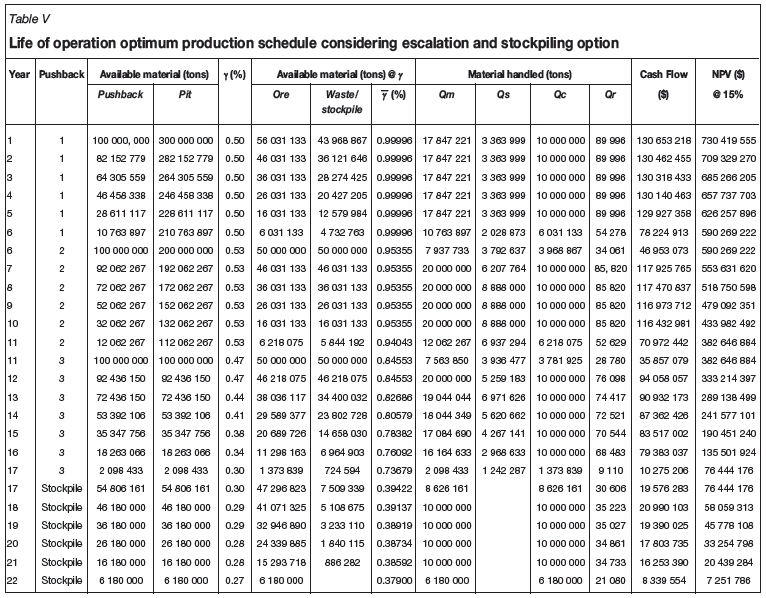
Table V shows a comprehensive breakdown of the optimum policy, allowing both escalation of economic parameters and stockpiling option. Owing to the similar grade-tonnage distribution and initial values for the economic parameters, an equivalent trend is followed for selection of the optimum cut-off grades and the resultant flow of material from mine to refinery. Table V indicates that NPV (last column) is declining with exhaustion of reserves (column 2 and 3) from year 1 to year 22. It describes the process of discounting the annual cash flows to calculate Ωn (last column corresponds to step 11 of the algorithm) for a particular period, which is then used to compute the optimum cut-off grade. For example, processing capacity is limiting the operation during year 15, hence γ = γc, and keeping the escalated values of economic parameters, γ may be calculated as follows:
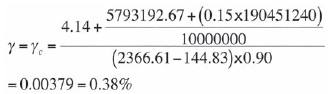
Table V also demonstrates the accumulation of stockpile material from years 1 to 17. As the lowest cut-off grade remains 0.27% (from Table IV) and the optimum cut-off grade during year 1 is 0.5036%, they exist in 4th and 9th grade increments of the Pushback 1 (see Table II), respectively. Therefore, the stockpile material consists of six grade increments, presented as:
[0.27, 0.30], [0.30, 0.35], [0.35, 0.40], [0.40, 0.45], [0.45, 0.50], [0.50, 0.5036]
The amount of material in the first stockpile grade increment is determined using Equation [34]:
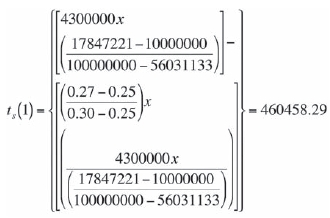
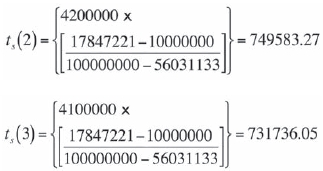
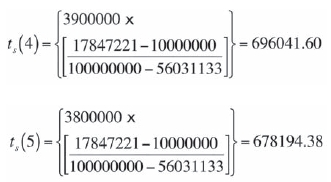
The tons of material from the 2nd to 5th stockpile grade increments are determined using Equation [35]:
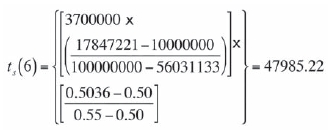
Similarly, the tons of material in the 6th stockpile grade increment are determined using Equation [36]:
Therefore, approximately 3.4 million tons of material is scheduled to stockpiles in year 1. A total of 54.81 million tons of raw material is accumulated in stockpiles from years 1 through 17, which otherwise is scheduled to waste dumps in the previous policies. Stockpiling option promises an increase of five years in the operation's life along with a 1% increase in NPV from $723 350 000 to $730 419 555.
Conclusions
The optimum cut-off grade policies indicate that the impact of escalation on the objective function could be enormous in cases where operating and fixed costs are escalating at higher rates. This may change some of the economic open pit operations to an uneconomic scenario. It is observed that the operation presented in the case study becomes unprofitable during later years at an escalation rate of 6 per cent per year in the operating and fixed costs. Therefore, long term mining plans should always include escalation of economic parameters to establish the feasibility of the mining venture.
The results also reflect that the creation of stockpiles scheduled approximately 55 million tons of additional ore for processing, which facilitated in neutralizing the effect of escalating economic parameters through enhancement of the life of operations along with NPV. However, it is clear that allowing the creation of long-term stockpiles is a strategic decision, and exercising this option depends exclusively upon the operating conditions of an open pit mining operation. The proposed methodology is limited in its application to the metallic ores; therefore, while making this important decision, one must give a serious consideration to issues such as material deterioration and compaction during long exposure to the environment. Similarly, loss of values may take place due to leaching, and oxidation may introduce processing complexities and result in reduced recoveries.
The proposed cut-off grade optimization model considers the escalation of economic parameters, particularly, the operating and fixed costs, with a vision that mine planning activity is focused on survival strategies under harsh economic situations. As such, it is a contribution to the mine planning community in terms of facilitating the evaluation of different economic alternatives, ultimately ensuring the optimum utilization of resources coupled with appropriate policy formulation for making major mining investments.
The model does not consider uncertainty in economic parameters, especially, the uncertainty associated with the metal price. Also, it is limited to the creation of long-term stockpiles. Therefore, the development of cut-off grade optimization models taking into account metal price uncertainty and allowing the processing of stockpile material during mine life are some of the areas for future research.
References
1. TAYLOR, H.K. General background theory of cut-off grades. Transactions of the Institution of Mining and Metallurgy Section A, 1972. pp. 160-179. [ Links ]
2. TAYLOR, H.K. Cut-off grades-some further reflections. Transactions of the Institution of Mining and Metallurgy Transactions Section A, 1985. pp. 204-216. [ Links ]
3. DAGDELEN, K. Cut-off grade optimization. Proceedings of the 23rd International Symposium on the Application of Computers and Operations Research in the Mineral Industry, Tucson Arisona, 1992. pp. 157-165. [ Links ]
4. DAGDELEN, K. An NPV optimization algorithm for open pit mine design. Proceedings of the 24th International Symposium on the Application of Computers and Operations Research in the Mineral Industry, Montreal, Canada, 1993.pp. 257-263. [ Links ]
5. CETIN, E. and DOWD, P.A. The use of genetic algorithms for multiple cut-off grade optimization. Proceedings of the 32nd International Symposium on the Application of Computers and Operations Research in the Mineral Industry, Little, Colorado, 2002. pp. 769-779. [ Links ]
6. DAGDELEN, K. and KAWAHATA, K. Value creation through strategic mine planning and cut-off grade optimization. Mining Engineering, vol. 60, no. 1, 2008. pp. 39-45. [ Links ]
7. HE, Y., ZHU, K., GAO, S., LIU, T., and LI, Y. Theory and method of geneticneural optimizing cut-off grade and grade of crude ore. Expert Systems with Applications, vol. 36, no. 4, 2009. pp. 7617-7623. [ Links ]
8. AKAIKE, A. AND DAGDELEN, K. A strategic production scheduling method for an open pit mine. Proceedings of the 28th International Symposium on the Application of Computers and Operations Research in the Mineral Industry, Golden, Colorado, 1999. pp. 729-738. [ Links ]
9. BASCETIN, A. Determination of optimal cut-off grade policy to optimize NPV using a new approach with optimization factor. Journal of the Southern African Institute of Mining and Metallurgy, vol. 107, no. 2, 2007. pp. 87-94. [ Links ]
10. ASAD, M.W.A. Development of generalized cut-off grade optimization algorithm for open pit mining operations. Journal of Engineering and Applied Sciences, vol. 21, no. 2, 2002. pp. 119-127. [ Links ]
11. OSANLOO, M. AND ATAEI, M. Using equivalent grade factors to find the optimum cut-off grades of multiple metal deposits. Minerals Engineering, vol. 16, no. 8, 2003. pp. 771-776. [ Links ]
12. ASAD, M.W.A., Cut-off grade optimization algorithm for open pit mining operations with consideration of dynamic metal price and cost escalation during mine life. Proceedings of the 32nd International Symposium on Application of Computers and Operations Research in the Mineral Industry (APCOM 2005a), Tucson, Arizona, 2005. pp. 273-277. [ Links ]
13. ASAD, M.W.A. Optimum cut-off grade policy for open pit mining operations through net present value algorithm considering metal price and cost escalation. Engineering Computations, vol. 24, no. 7, 2007. pp. 723-736. [ Links ]
14. ASAD, M.W.A. Cut-off grade optimization algorithm with stockpiling option for open pit mining operations of two economic minerals. International Journal of Surface Mining, Reclamation and Environment, vol. 19, no. 3, 2005b. pp. 176-187. [ Links ]
15. LANE, K.F. Choosing the optimum cut-off grade. Colorado School of Mines Quarterly, vol. 59, 1964. pp. 811-829. [ Links ]
16. LANE, K.F. The Economic Definition of Ore, Cut-off Grade in Theory and Practice. Mining Journal Books, London, 1988. [ Links ]
17. DAGDELEN, K. and ASAD, M.W.A. Multi-mineral cut-off grade optimization with option to stockpile. Society of Mining, Metallurgy, and Exploration Engineers (SME) Annual Meeting, Preprint no. 97186. 1997. [ Links ]
18. ATAEI, M. and OSANLOO, M. Using a combination of genetic algorithm and grid search method to determine optimum cut-off grades of multiple metal deposits. International Journal of Surface Mining, Reclamation and Environment, vol. 18, no. 1, 2004. pp. 60-78. [ Links ]
19. OSANLOO, M., RASHIDINEJAD, F., and REZAI, B. Incorporating environmental issues into optimum cut-off grades modeling at porphyry copper deposits. Resources Policy, vol. 33, no. 4, 2008. pp. 222-229. [ Links ]
20. KING, B. Optimal mining principles. Proceedings of the International Symposium on Orebody Modelling and Strategic Mine Planning. Australian Institute of Mining and Metallurgy, Perth, Western Australia. 2009. [ Links ]
21. STERMOLE, F.J. and STERMOLE J.M. Economic Evaluation and Investment Decision Methods, 9th Edition, Investment Evaluation Corporation, Golden, Colorado, USA, 1996. [ Links ] ♦
Paper received Mar. 2010; revised paper received Feb. 2011.
© The Southern African Institute of Mining and Metallurgy, 2011. SA ISSN 0038-223X/3.00 + 0.00.

