


Services on Demand
Article
 English (pdf)
 Article in xml format
 Article references
Indicators

Related links
-
 Cited by Google
 -
 Similars in Google
Share

 Permalink
Journal of the Southern African Institute of Mining and Metallurgy
On-line version ISSN 2411-9717
Print version ISSN 2225-6253
J. S. Afr. Inst. Min. Metall. vol.111 n.8 Johannesburg Aug. 2011
TRANSACTION PAPER
Air pollution perceptions and their impacts on the coal industry
P. Lloyd
Energy Institute, Cape Peninsula University of Technology
SYNOPSIS
Perceptions of disaster caused by burning fossil fuels have reached such a pitch that they seriously threaten the very future of the industry. Coal is a dirty word. A leader in Business Day (January 19 2009) claimed 'There is no disputing that renewable and non-polluting energy sources are preferable to the country-the true cost of so-called cheap coal-fired power stations is neither reflected nor accounted for by Eskom-the true and immediate but unacknowledged cost of continued coal mining is apparent in the catastrophic level of acidification from mining runoff of all significant natural water resources in the country-and their waters have been rendered unfit for human consumption. Air quality is in a similar state with-increases in pulmonary disease causing workforce absenteeism and compromised childhood development, among many other health problems recorded in areas polluted by coal mining.' The upshot is that our latest coal-fired power station, Kusile, is being required to use flue gas desulphurization. The costs are considerable, and the benefits minimal. Meanwhile, exports are being threatened by EU directives and an assumption that South African coal gives off excessive quantities of SOx and NOx when burned. The industry needs to arm itself with clear responses to these and similar misconceptions, and to communicate those responses loudly and clearly, if it is to survive.
Keywords: Air pollution, sulphur oxides, nitrogen oxides, flue gas desulphurization, Clean Air Amendment Act, acid rain.
Introduction
'Coal' is increasingly seen as synonymous with 'pollution'. It is true that the Highveld air carries excessive coal-derived smoke. 40% of the total particulate load in our atmosphere arises from the combustion of only 1 Mt of coal in inefficient, 1870s design stoves (at best-some of it is from open mbaulas). The fact that over 100 Mt is burned cleanly and provides South Africa with over 90% of its electrical energy escapes the industry's critics. When the coal fails to arrive at the power station, as happened early in 2008, all hell breaks loose, and people forget their fears. But the respite is temporary. A year later a leader in South Africa's main business daily, Business Day, could say:
'The question SA's policy makers must ask is whether the short-term gain made in the name of rapid growth and development is worth its contribution to global warming and environmental degradation. There is no disputing that renewable and nonpolluting energy sources are preferable to the country's dependence on finite and dirty fossil fuels. The true cost of so-called cheap coal-fired power stations is neither reflected nor accounted for by Eskom or the Government. The true and immediate but unacknowledged cost of continued coal mining is apparent in the catastrophic level of acidification from mining runoff of all the significant natural water resources in the country. Their waters have been rendered unfit for human consumption, unless treated in municipal works that are now in a state of collapse. Air quality is in a similar state, with research showing notable increases in pulmonary disease causing workforce absenteeism and compromised childhood development, among many other health problems recorded in areas polluted by coal mining.' (Jan 19 2009)
These sweeping statements would make the uninformed reader believe that coal miners were to be rated among the lowest form of life on earth. But are 'all natural waters' in a state of 'catastrophic' acidification? Of course not. Does the mining of coal and its use to generate power compromise 'childhood development'? To the contrary, it is readily shown that the availability of electrical power fosters childhood development through all its phases. Do emissions from power stations that burn coal truly harm the environment? I believe that these and similar questions must be answered if the industry is to survive such unfounded attacks on its integrity.
Acid rain and sulphates
In recent years there has been increasing concern about the environmental impacts of coal combustion. In the 1980s in both Europe and North America there was great concern about 'acid rain'. In the USA, an intensive research programme called the National Acid Precipitation Assessment Program (NAPAP) was launched. Its draft concluding report in 1988 was rejected by a lobby that included a would-be President, George Bush Snr., because its findings were politically unacceptable. 'Acid rain' was generally beneficial; lakes which were turning acid had always been acid, but had been made alkaline by ash from slash-and-burn agriculture; about 1% of the trees studied had been affected by sulphates and nitrates, which had acted as fertilizers and caused the trees to bloom too early in the year, so they then were damaged by late frosts.
In Germany, there was great concern about waldsterben, but on closer examination it transpired trees were being damaged by known pathologies. There was local damage, which was generally confined to a single species, but there was a long history of such damage to that species. In a careful survey of nearly 80 000 apparently injured trees, only 0.1% were damaged by an unknown cause such as air pollution. 'Classic Waldsterben as perceived by the general public does not exist. As time passes it is becoming increasingly clear that the forests of Europe are not dying.'1 In Sweden, concerns that forests were being damaged by sulphur compounds from British power stations were alleviated by the finding that most (>90%) of the acid in the streams came from the anaerobic decay of leaves rather than from the rain.
Nevertheless, in the USA the Clean Air Amendment Act of 1990 required control over SOx and NOx emissions from power stations, and other nations soon followed suit. The USA also introduced a scheme that set limits on emissions, and allowed those who wished to exceed their limit to purchase emission credits from those whose emission were less than their limit. This 'cap-and-trade' process has been successful in reducing emissions of SOx, and has yielded useful revenue to the fiscus. However, the impacts on the environment have been slight, and are primarily reflected in improved visual range due to lower aerosol concentrations.
The cost of desulphurization is not insignificant. According to the USEPA2, capital costs in 2001 were of the order of $100/kW for new installations and $130/kW for retrofits. Capital and operating costs for large (>400 MW) boilers were $200-$500 per ton SO2 removed, assuming an 80% load factor for the installation. Recovery is typically >90%. The recent decision to require Eskom to fit desulphurization to Kusile is cited as one of the reasons for a ~30% increase in the capital cost of the plant.
Let us look at the likely present-day costs in South Africa. EPRI (2010)3 produced cost estimates for various generation technologies in support of IRP2010. Table I compares the performance and cost of two stations each of 4500 MW output, one without flue gas desulphurization (FGD) and the other including FGD. If each station operates for 7500 h per annum, then installation of FGD:
 Adds R12.8 billion to the capital cost
Adds R2.3billion to the annual cost of electricity
Avoids 302 kt of SOx emissions at an annual cost of R7630/t (Compare US < $200/t)
Increases water consumption by over 7 million cubic metres
Increases all other wastes by a significant amount.
The impact of 300 000 t of sulphur on the environment will be small; the opportunities offered annually by R2.3 billion are not small. The cost-benefit ratio in this case is far too high to warrant desulphurization.
It often happens, when you try to do a benefit analysis on desulphurization, you are soon swamped by tales of crisis. I call them tales, because I have yet to find one that stands up to close examination. 'Acid rain' is supposed to be causing destruction of forests, yet many trees have an absolute need for sulphur. The beautiful blue of the jacaranda flower comes from a sulphur compound present in large quantities, which you can easily prove for yourself if you store some petals under water for a few days. Anaerobic decay releases the sulphur, and you can smell it.
Sulphur is an element essential to plant life4. The amino acids cystine and methionine contain sulphur, and are incorporated in essential proteins, hence are critical for plant growth. Many common crops contain as much sulphur as they do phosphorus. This is a simple reminder that sulphur may be called a pollutant by some, but it is a nutrient to others.
The evidence for 'acid rain' affecting forests is tenuous at best. A classic and much cited paper5 found that trees were damaged, but only if the pH was 2 or less. About 30 years of weekly rainfall analyses at nearly 200 stations across the US has shown a single incident6 when the pH was <3.5. Rain of pH2 does not occur.
Of late there has been a shift in emphasis to claims of damage caused to soil by 'acid rain'. It helps to remember that virtually all rain is acid, i.e. has a pH of <7. In part, this is because rain dissolves carbon dioxide from the air, and a solution of CO2 in water is acid. And yes, the acidity in rain does damage soil and rock-it has done so for millennia. You have only to consider the caves in dolomitic areas to see the damage. But nature has survived the onslaught. Does our combustion of sulphur-containing compounds add to the attack? I can find no evidence in support of such a hypothesis. There is clear evidence that in cities the combination of carbon particles and high levels of ozone, sulphur, and nitrogen oxides from internal combustion engines causes damage, but that is not true over most of the earth's surface.
So there are considerable costs and, at worst, small impacts. The small impacts mean that there are small benefits. Some indication of the minimal benefits can be gauged from the results of monitoring. The Department of Environmental Affairs and Tourism (DEAT) has a guideline of 19 ppb SO2 for the annual mean concentration in the atmosphere. The results from the past decade are shown in Figure 1. The limit has never been exceeded. Is achievement of even lower levels merited by the cost? The question must be both asked and answered, because we have far better things to do with tens of billions of rand.
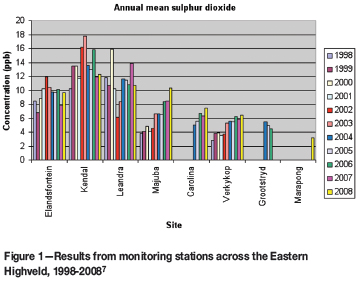
Figure 1 also shows a phenomenon that was not originally appreciated, namely that much of the observed pollution is the result of ground-level sources. The relatively high sulphur levels at Elandsfontein, Kendal, and Leandra are all associated with human settlements where much of the household energy is provided by burning coal inefficiently. When the last coal-fired power station was sited, the then Air Pollution Control Officer reported that sulphur levels in the vicinity of the existing coalfields were too high. The decision was therefore taken to site Majuba on a new coalfield well to the south. This coalfield was subsequently found to be unworkable. Also, later work8 showed that the sulphur levels in the vicinity of the existing coalfields would not be adversely impacted by another power station because its emissions would be at altitude.
Moreover, it has been shown that emissions at altitude over southern Africa take at least 5 days to descend to the 800 hPa altitude level even under the worst conditions9. Thus the rationale for siting Majuba remote from a source of coal was poor, and the costs of this decision will continue for at least another 40 years.
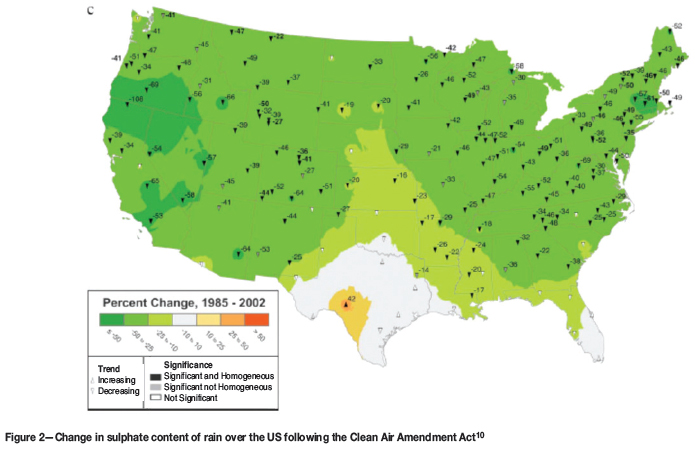
To conclude this saga, let us take a brief look at the impact of billions of dollars spent to reduce 'acid rain' in the United States. Recall that the Clean Air Amendment Act passed into law in 1990. Figure 2 shows the changes in sulphate in rain between 1985 and 2002. Yes, there has been a significant reduction over most of the USA. However, most of the western and mountain states had few significant sources of sulphur emissions to start with, so the recorded drop over these regions is natural and unrelated to any mitigation that may have taken place.
Nitrogen oxides
Just as with sulphur oxides, nitrogen oxides derived from burning fossil fuels have given fossil fuel burning a bad name. In this case, the reasoning is even less sound. Nitrogen compounds are the core of amino acids, the building blocks of proteins, the very essence of life. The nitrogen of the air is unreactive and must be broken up before it can be used to make amino acids. The primary route for making the nitrogen compounds on which life depends relies on nitrogen oxides.
Even our food chain demands nitrogen in a reactive form. There are the three primary plant nutrients; nitrogen, phosphorus, and potassium, which are most rapidly depleted when fields are harvested. Fields must either be left fallow for the nutrients to be restored by nature, or the nutrients must be added artificially as fertilizers. The fertilizers in common use have NPK ratings such as 3-4-2, reflecting the percentages of nitrogen, phosphorus, and potassium in them. In the days before fertilizers became readily available, it was customary to leave fields fallow for several years after they had produced a crop, so that nature could restore the missing nutrients. Early in the last century, mankind learned to 'fix' nitrogen from the air so as to produce fertilizers, and modern farming was born.
Where do the nitrogen oxides come from in nature? Much is formed by lightning. Estimates vary, but there is a consensus around 50 Tg N per year11. Burning biomass at present also contributes about 50 Tg12. Microbial activity in soils results in emission of between 5 and 20 Tg per year13. Satellite measurements14 show that anthropogenic sources account for 15±3% of the total, or between 15 and 25 Tg N per year.
There is a fully established nitrogen cycle in nature. Fossil fuels are now adding a relatively small load to it. Is nature able to handle the additional burden?
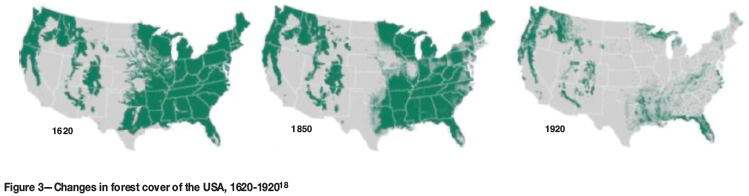
There has been a huge deforestation of North America, Western Europe and South Western Asia over the past millennium15-17.
With a greater area of forests to burn in the past, there was greater generation of nitrogen oxides from burning biomass. What is more, fire fighting was not as advanced as it is today; there were no extensive fire breaks, no helicopters dumping extinguishing agents. Fires burned frequently and very extensively. Some idea of the likely impact may be gained from the analysis of the great China fire of 1987, when 1.3 million ha (13 000 km2), burned over a period of a fortnight in spite of extensive attempts to extinguish it19. The blaze released approximately 140 Mt (140 Tg) carbon and 6 Mt (6 Tg) nitrogen as oxides. Thus, that single fire emitted in a fortnight 30% of the annual emissions from fossil fuels. I conclude that nature is perfectly capable of accepting the small additional load of nitrogen oxides we impose on it by burning fossil fuels.
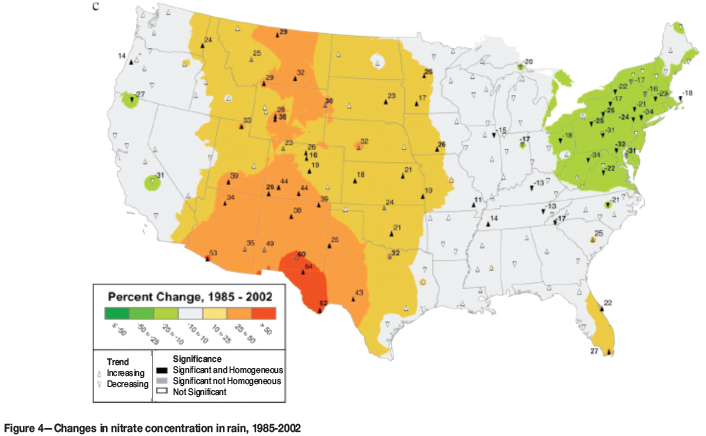
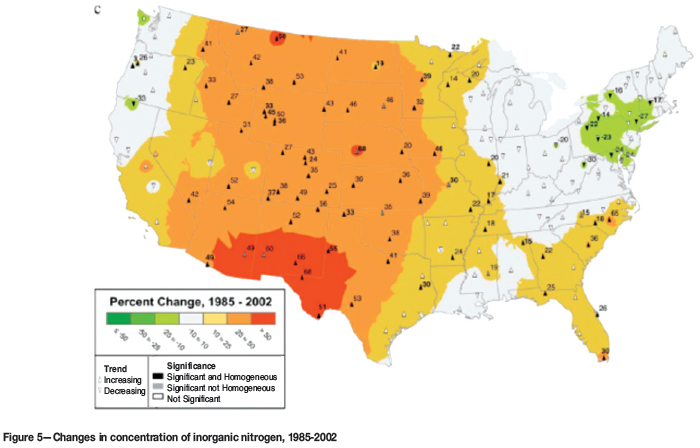
To conclude this section, let us look at the impact of the Clean Air Amendment Act on the nitrate and total inorganic nitrogen concentrations over the USA. Figure 4 shows the change in nitrate concentration, and Figure 5 the change in ammonia concentration in rainfall.
The nitrate level has dropped by up to 25% over only a small region in the north east. There is a large region in the mid-West where it has increased by at least 25%; quite a large area within the region where it has increased by up to 50%; and a small area in the south west where it has increased by over 50%.
The rise in the total inorganic nitrogen, namely nitrate plus ammonia, is even greater. Across nearly half of the US, the concentration has increased by between 25 and 50%. There is only a small area in the North East where it has decreased.
Was the Clean Air Amendment Act effective?
As we have seen, the sulphate levels over the USA dropped significantly following the introduction of the Clean Air Amendment Act, but, for reasons quite unexplained, the levels of nitrogen compounds increased significantly in spite of the Act's requirements. There has been considerable discussion in the technical literature of the reasons behind the remarkable increase in the nitrogen content, but the popular press has been silent, preferring to note the drop in sulphate levels.
There is, however, a problem with the sulphate data which the observant will already have noted. Most of the coal-fired power stations, the reputed source of most of the pollution/nutrients that are the rationale for the Act, are situated in the eastern part of the country. Why has there been a marked drop in sulphate levels in the west? Some cleaner automotive fuels have entered the market since 1985, but that contribution must be small. There is no evidence that human actions could have led to a drop of this magnitude. Nor is there any evidence that natural sources have diminished.
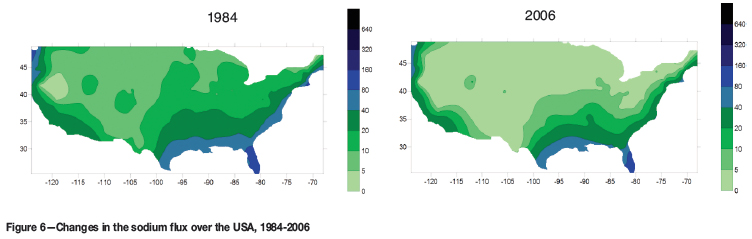
With these problems in mind, it was decided to look at a completely neutral 'marker', such as sodium in rain. Data was available from the NADP site6. 154 sampling points had records extending over the period 1 January 1984 to 31 December 2006. The results20 are shown in Figure 6, and can be compared directly with the sulphate results shown in Figure 2. The longer baseline of the sodium study increases the level of confidence in the trends detected, and the sodium study also deals with the sodium flux, i.e. the product of rainfall and concentration, rather than concentration per se, which has the advantage that any changes in rainfall can be ignored.
Figure 6 shows that, over most of the USA, there was a drop of >50% in the sodium flux over the period of assessment. It is generally agreed that the source of most of the sodium in rain is marine, and indeed it is primarily in coastal areas that there were regions of no change. Elsewhere the drop was even more dramatic that that for sulphate.
Moreover, the changes in sodium flux were closely matched by the changes in the chloride flux, as shown in Figure 7.

Thus the pattern of change of chloride is very similar. Neither sodium nor chloride is implicated in any way in any anthropogenic emissions or controls. Thus the drop in flux over most of the USA must be natural in its origin.
But if this is true, it must be asked how much of the drop in the sulphate flux shown in Figure 2 is natural, and how much the result of flue gas desulphurization installed in consequence of the Clean Air Amendment Act. At least some of it must be natural, because the fall in sulphate levels over much of the western USA has nothing to do with desulphurization. Thus at present, we cannot say just how effective desulphurization is.
Conclusions
Air pollution as a cause for devastation of forests became a bandwagon used to introduce air pollution controls. The combustion of coal was blamed, even though at the time the evidence for the 'acid rain' was equivocal. In time, it has been found that the apparent devastation was not the crisis that it had originally claimed to be. There were many factors that caused local stress in forests, but the damage was local, not extensive as it would have been had the air pollution hypothesis been sustainable.
Precipitation chemistry has been used in an attempt to show that the air pollution controls that were introduced were effective. However, analysis has shown that much, if not all, of the claimed reduction in nutrient load has an unknown, natural origin.
Unfortunately the 'acid rain' hypothesis has become a perceived wisdom. It seems so obvious that SOx and NOx dissolved in rain will form acid which will cause environmental damage that schoolchildren are being taught the hypothesis. A generation has grown up for which 'acid rain' is a perceived truth.
In South Africa, the Department of Environment Affairs has recently21 reduced the permissible level of sulphur dioxide emissions from 'solid fuel combustion installations' from 3500 to 500 mg.Nm-3 and the nitrogen oxides from 1100 to 750 mg.Nm-3. No rationale is given for these reductions, which have significant economic consequences, other than the implied 'less is better'.
New metrics such as 'critical load' have been introduced. Needless to say, the metrics depend on models whose validity is highly questionable. A typical test22 of the 'critical load' concept concluded that there were very large errors even when applied over a small test site, and that attempts to apply the model using 'national parameters' would involve such large errors that the results would be meaningless. A recent test of the application of 'critical load' in a forest gave negative results23-there was no correlation between the 'critical load' and either the growth or health of the trees.
Nevertheless a huge bureaucracy has grown up to monitor the release of plant nutrients from power stations and administer the revenues that accrue. The very existence of such a bureaucracy indicates to the uncritical that the problem is real. Those who have had the privilege of observing government institutions at close hand would deny this.
There is the ultimate bureaucracy, which administers the Convention on Long-Range Transboundary Air Pollution24. It is worth remarking that the Convention dates from 1979, well before the long-term monitoring of forests had shown that air pollution was not the problem.
As we have seen, South Africa has caught the disease. The decision to require Kusile to be equipped with desulphurization was not the result of rational analysis of the costs and benefits. There was no environmental impact assessment. Instead, there was an implicit assumption that desulphurization must confer benefits. No one asked what the benefits might be.
This encapsulates the problems facing the coal industry. The tacit assumption that all emissions from coal combustion constitute 'pollution', however that is defined, means that the use of coal is threatened. The EU's Large Combustion Plant Directive will limit emissions of SOx and NOx. British authorities have declared that South African coal tends to produce greater amounts of these nutrients when burned than do other coals. The basis for this assertion is not known. More recently, there has been concern that the coal would emit hydrochloric acid when burned. This rumour was traced to the use of some high-salt-content coal of British origin. There was, needless to say, no evidence for the emission of hydrochloric acid. The perceived truth of 'acid rain' was enough to pronounce the salt guilty.
It is often claimed that the true costs of burning coal ignore 'external costs', that is, the costs associated with emissions and solid or liquid wastes. In an endeavour to quantify these costs, the European Union had a large team working for over ten years to determine the external costs of power generation25. Coal-fired power generation external costs varied between 2 and 10 EUR-cents/kWh, depending on the type of coal employed, the weather conditions, the size of the plant, and the population density in the vicinity. Applying the same methodology in South Africa leads to an external cost of the order of R0.04/kWh, because of relatively low sulphur coal, very different weather conditions, generally larger plants, and far lower population densities than Europe.
The benefits that coal has brought humankind are such that a much stronger defence of its merits is needed than has been possible up to now. I don't know how the defence should be structured. But I do know that, if a defence is not mounted, the industry will lurch from crisis to crisis and the world will be the poorer.
References
1. SKELLY, J.M. and INNES, J.L. Waldsterben in the Forests of Central Europe and North America: Fantasy or Reality? Plant Disease, vol. 78, no. 11, 1999. pp. 1021-1032 [ Links ]
2. Air pollution control technology factsheet, USEPA Report EPA-452/F-03-034. http://www.epa.gov/ttn/catc/dir1/ffdg.pdf. Accessed Feb 2009 [ Links ]
3. EPRI 2010 Power generation technology data for integrated resource plan of South Africa. EPRI, Palo Alto, CA. [ Links ]
4. SOLBERG, E.D., MALHI, S.S., NYBORG, M., HENRIQUEZ, B., and GILL, K.S. Crop response to elemental S and sulfate-S sources on S-deficient soils in the parkland region of Alberta and Saskatchewan. Journal of Plant Nutrition ISSN, vol. 30, no. 1-3, 2007. pp. 321-333. [ Links ]
5. NEUFELD, H.S., JERNSTEDT, J.A., and HAINES, B.L. Direct foliar effects of simulated acid rain. I. Damage, growth and gas exchange. New Phytologist, vol. 99, no. 3, 1985. pp. 389-405. [ Links ]
6. National Atmospheric Deposition Programme. http://nadp.sws.uiuc.edu/ accessed Nov 2007-Jun 2008 [ Links ]
7. ESKOM. Annual Report, Johannesburg 2008. [ Links ]
8. WELLS, R.B., LLOYD, S.M., and TURNER, C.R. National air pollution source inventory. Air Pollution and Its Impacts on the South African Highveld, G. Held et al., (eds.), Environmental Scientific Association, 1996. pp. 3-9. [ Links ]
9. FREIMAN, M.T. and PIKETH, S.J. Air Transport into and out of the Industrial Highveld Region of South Africa Journal Of Applied Meteorology, vol. 42, 2002. pp. 994-1002. [ Links ]
10. LEHMANN, C.M.B., BOWERSOX, V.C., and LARSON, S.M. Spatial and temporal trends of precipitation chemistry in the United States, 1985-2002. Environmental Pollution, vol. 135, 2005. pp. 347-361. [ Links ]
11. RAKOV, V.A. and UMAN, M.A. Lightning: Physics and Effects. Cambridge University Press, 2007. [ Links ]
12. LEVINE, J.S. Global Biomass Burning: Atmospheric, Climatic, and Biospheric Implications. MIT Press, Cambridge MA, 1991. [ Links ]
13. LAL, R. Encyclopedia of Soil Science. CRC Press, Boca Raton, FL, 2006. [ Links ]
14. TOENGES-SCHULLER, N., STEIN, O., ROHRER, F., WAHNER, A., RICHTER A., BURROWS, J.P., BEIRLE, S., WAGNER, T., PLATT, U., and ELVIDGE, C.D. Global distribution pattern of anthropogenic nitrogen oxide emissions : Correlation analysis of satellite measurements and model calculations. Journal of Geophysical Research, vol. 111 (D5). pp. 1-15. [ Links ]
15. COGBILL, C.V., BURK, J., and MOTZKIN, G. The forests of presettlement New England, USA: spatial and compositional patterns based on town proprietor surveys Journal of Biogeography, vol. 29, vol. 10-11, 2002. pp. 1279-1304. [ Links ]
16. FOSTER, D., MOTZKIN, G., O'KEEFE, J., BOOSE, E., ORWIG, D., FULLER, J., and HALL, B. 2004. The environmental and human history of New England. Foster, D.R. and John, D. Aber, (eds.) Forests in Time: The Environmental Consequences of 1,000 Years of Change in New England. Yale University Press. New Haven, CT, pp. 43-100. [ Links ]
17. LEHTONEN, H. and HUTTUNEN, P. History of forest fires in eastern Finland from the fifteenth century AD-the possible effects of slash-and-burn cultivation. The Holocene, vol. 7, 1997. pp. 223-228. [ Links ]
18. UNIVERSITY OF MICHIGAN GLOBAL CHANGE CURRICULUM. http://www.globalchange.umich.edu/globalchange2/current/lectures/deforest/deforest.html. accessed Feb 2009. [ Links ]
19. NASA LANGLEY RESEARCH CENTER. http://asd-www.larc.nasa.gov/biomass_burn/sat_anal.html. accessed Feb 2009. [ Links ]
20. LLOYD, P.J. An evaluation of sodium and chloride precipitation over the United States. Atmospheric Environment, vol. 44, no. 26, 2010. pp. 3196-3206. [ Links ]
21. Department of Environmental Affairs 2010 Government Notice No.248, Government Gazette No.33064, 31 March 2010. [ Links ]
22. ABBOTT, J., HAYMAN, G., VINCENT, K., METCALFE, S., DORE, T., SKEFFINGTON, R.A., WHITEHEAD, P.G., WHYATT, D., PASSANT, N., and WOODFIELD, M. Uncertainty in acid deposition modelling and critical load assessments R&D Technical Report TR4-083(5)/1, Environment Agency (England and Wales), Bristol, UK, 2003. [ Links ]
23. Hansen, K., Vesterdal, L., Bastrup-Birk, A., and Bille-Hansen, J. Are Indicators for Critical Load Exceedance Related to Forest Condition? Water, Air, and Soil Pollution, vol. 183, no. 1-4, 2007. pp. 293-308. [ Links ]
24. UN ENONOMIC COMMISSION FOR EUROPE. http://www.unece.org/env/lrtap/. Accessed Feb 2009. [ Links ]
25. ExternE-The Externalities of Energy (2010) http://www.externe.info/ Accessed March 2010. [ Links ]
Paper received Feb. 2010; revised paper received Jul. 2011.
© The Southern African Institute of Mining and Metallurgy, 2011. SA ISSN 0038-223X/3.00 + 0.00.

