


Services on Demand
Article
 English (pdf)
 Article in xml format
 Article references
Indicators

Related links
-
 Cited by Google
 -
 Similars in Google
Share

 Permalink
Journal of the Southern African Institute of Mining and Metallurgy
On-line version ISSN 2411-9717
Print version ISSN 2225-6253
J. S. Afr. Inst. Min. Metall. vol.111 n.7 Johannesburg Jul. 2011
TRANSACTION PAPAER
Empirical correlation of mineral commodity prices with exchange-traded mining stock prices
C. Nangolo; C. Musingwini
School of Mining Engineering, University of Witwatersrand, Johannesburg, South Africa
ABSTRACT
Mineral commodity prices comprise one of the key criteria in the selection of mining stocks. We contend that of the three principal elements of mineral commodity prices, spot price, forward price and long-term price, one has a greater impact on the share valuation processes used by investors. This research paper examines the extent to which each of these elements influences the valuation process. The intention is to provide investors in mining stocks with a greater understanding of how fluctuations of commodity prices over time affect the prices of the mining stocks they hold, or intend to sell or buy.
Three mineral commodities, gold, silver, and copper, were used as case studies, since market data on these commodities is readily available in the public domain. Nine market indices covering all three mineral commodities were selected. These are based on clearly defined criteria with the intention of eliminating ambiguity and to test for correlation with the three sets of mineral commodity prices. Nine mining companies, which were not the primary drivers of the relevant indices employed in the study, were used to validate the results obtained from the indices in order to avoid duplication of the same correlation during cross-checking.
Each commodity price was adjusted for operating costs. For each market index, an average operating cost was calculated from the companies comprising its basket, while each company's annual operating costs were used for the stocks of the individual companies examined. The data was collected for the period January 2004 to October 2010. This period was further split up into three sub-periods to account for the Global Financial Crisis (GFC) period that started in mid-2008.
We conclude that mining stock prices are correlated with mineral commodity prices, but with spot and forward prices exhibiting stronger correlations than long-term price. This finding should be useful for evaluation purposes. Where cash flow methodologies such as discounted cash flow or earnings per share are used to value ordinary shares and commodity prices are required to estimate future cash flows, the findings suggest that spot prices should be used as opposed to long-term prices. The work reported in this paper is part of a current MSc research study at the University of the Witwatersrand.
Keywords: Mineral commodity, price, spot price, forward price, long-term price, market capitalization, Global Financial Crisis, mining stock, price, market index.
Introduction
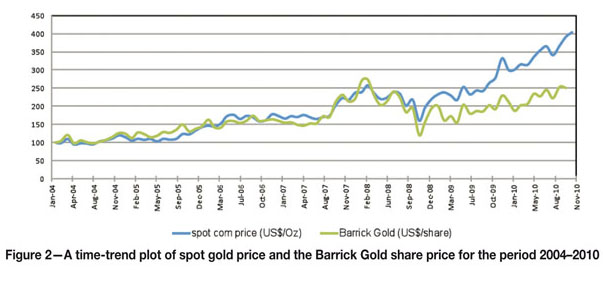
During periods of economic growth, investment in mining stocks escalates concomitant with buoyancy in the commodities markets. The market tends to place a premium on shares while mineral commodity prices are high1. Commodity prices are obviously key criteria for investment decisions with respect to mining companies. Commodity prices are available in three forms: namely, spot prices, forward prices, and long-term prices. It is surmised that the public's investment or divestment decisions are influenced more by spot prices than they are by forward and longterm prices. While the relationship between commodity prices and stock market counters is the bread and butter of stock market analysts who do this on a daily basis, as far as the authors are aware this has not been comprehensively and quantitatively tested in an academic sense. This research study was therefore undertaken to test this hypothesis and determine the extent to which investors may apply spot prices when valuing stocks of mining companies. For example, Figure 1 illustrates the time-trend relationship between the spot gold price and the Amex Gold BUGS Index, while Figure 2 illustrates the time-trend relationship between the spot gold price and the stock. The graphs indicate a quantitative relationship between spot gold price and the market indices which supports the underlying hypothesis of this paper.
Forward and long-term prices were used to validate the extent to which the hypothesis could be true. The share price of a mining company is important in that it directly determines the value of the market capitalization of the mining company, hence its net worth to investors. Actual data for three commodities, namely gold, silver, and copper, were used for testing the hypothesis. These three commodities were selected because their stock market data is readily available in the public domain.
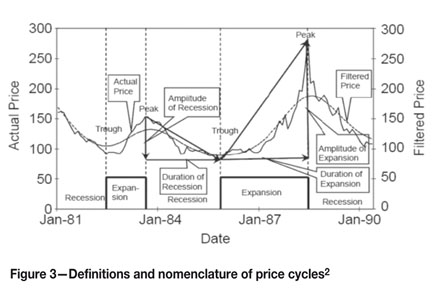
Spot prices of commodities tend to fluctuate over time, following an apparently cyclical pattern as shown in Figure 3. However, Roberts2 has argued that while these fluctuations are loosely referred to as cycles, they are not cycles in the strict definition.There are many other influences on the perceived cyclical behaviour of commodity prices over time and particularly through boom and bust periods. The following observations have been noted from different studies:
➤ Commodity prices tend to fluctuate widely in the short term3
➤ They usually move together4
➤ Periods of low prices will be interrupted by sharp peaks5
➤ Price cycles tend to be disproportionate, with shorter price booms and prolonged price slumps, and the time it takes to recover or fall from a slump or boom is independent of the duration of the slump or boom itself6.
The general rule in investing is to buy stock that is undervalued (share price is lower than intrinsic value per share) and sell stock that is overvalued (share price is higher than intrinsic value per share). In all the methods of stock valuations used, the role of future earnings is prominent. Future shareholder earnings are a direct function of cash flows, which in turn are premised on physical metal sales which, together with their respective commodity prices at the anticipated time of the sale, determine the revenues that are used in producing the cash flows. Movement in commodity prices will determine future cash flows, and understanding the nature of this relationship is essential to meaningful stock market valuations.
The work reported in this paper on determining the nature of this relationship forms part of a current MSc research study at the University of the Witwatersrand.
Research methodology
The study was structured such that the data (spot commodity prices, forward prices, and long-term consensus price estimates) would be tested against mining indices and then cross-checked by testing the same data against specific mining stocks. The mining stocks chosen were not the primary drivers of the indices, in order to avoid duplication of the same correlation during cross-checking.
The decision to use market indices rather than stocks of individual mining companies as the main data set for testing the hypothesis was based on the assumption that the value of stocks of individual mining companies could specifically be influenced by factors other than the commodity price. These factors include:
➤ The calibre of the company's management
➤ The Geo-political location of its operations
➤ Its business strategy
➤ The company's dividend policies.
The only determinant of market index movements is the movements in the share prices of its constituent basket of stocks, which do not necessarily take into account the factors governing the stocks of individual companies that are not included in that basket. Initially, the idea was to use both market indices (which comprise a basket of stocks) and mutual funds (which actually own mining stocks). However, the use of mutual funds was ruled out because mutual funds include other factors such as fund managers' fees, the skill and competence of the fund managers who pick the stocks, and trading methodologies.
The market indices used were copper indices, comprising stocks of mining companies involved in copper production; gold indices, comprising stocks of mining companies involved in gold production; and silver indices, comprising stocks of mining companies involved in silver production.
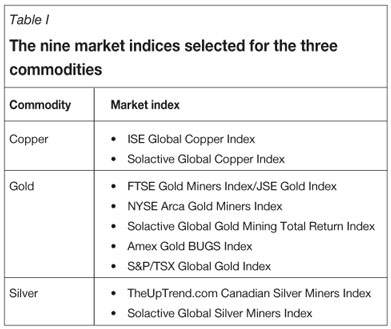
Production in this context is defined as the actual mining process and/or exploration for that specific mineral commodity. Indices based upon metal holdings rather than mining companies were omitted since the value of their shares may be influenced by factors other than commodity prices. Based on the above criteria, nine market indices were selected to cover each of the three mineral commodities as illustrated in Table I.
In deciding upon the period to be tested it was necessary that it be sufficiently long to capture periods of both buoyant and recessionary trends (boom and bust) especially for gold and silver. The historical data used here clearly demonstrates the degree of market sensitivity to economic conditions.
The period 2004 to 2010 was adopted for the analysis, and was further split up into sub-periods to allow the differential analysis of data through the boom and bust periods, and to isolate the Global Financial Crisis (GFC) period. Data from the GFC period would obviously be inconsistent with the rest of the data because markets were trading on distorted, and probably unrealistically low, values of underlying assets. The sub-periods were determined from the copper historical price charts, since the effects of the GFC were most pronounced in base metals. The three sub-periods were therefore selected as follows:
➤ Period 1—Pre-GFC period (January 2004 to July 2008)
➤ Period 2—GFC period (August 2008 to March 2009)
➤ Period 3—Post-GFC period (April 2009 to October 2010).
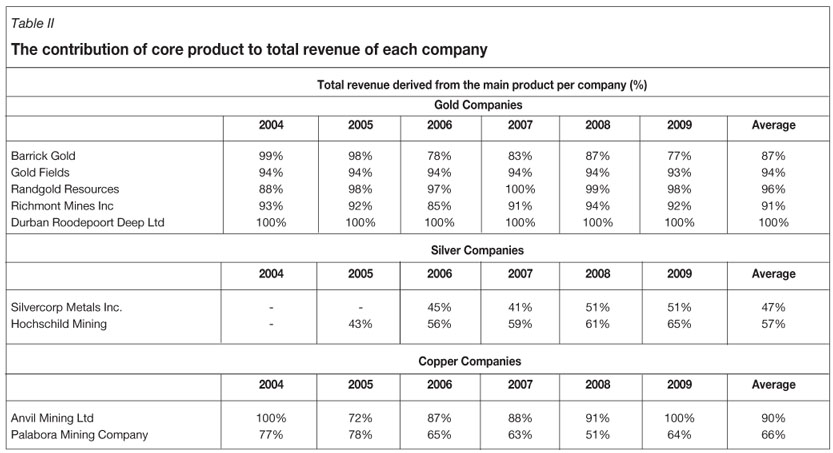
Nine companies were selected for analysis (Table II). The selection criteria were structured to rule out any ambiguity in the selection process. The companies were selected according to the following criteria:
➤ There should be no major changes in ore reserves, assets, and (to a lesser extent) production levels for the period to be tested
➤ In order to classify a company as one producing a specific commodity, noting that gold, copper, and silver tend to be produced with other by-products, it was a necessary condition that the revenue portion derived from the sale of the specific commodity had to exceed the revenue derived from the sale of any one of the other by-products, treated individually. Even though there was no minimum revenues portion set, companies with gold revenue greater than 80% of total revenue and companies with copper revenue greater than 60% of total revenue were selected in order to have a manageable data set
➤ The selected companies should have been in operation over the entire period being tested
➤ Lastly, the selected companies should belong to no more than one of the selected indices.
The following sources of information were used in obtaining data needed to conduct the research study:
➤ Commodity prices—all three sets of commodity prices (copper, gold, and silver) were obtained from the I-NET BRIDGE database
➤ Forward prices—gold and silver forward prices were derived from a calculation, utilizing the forward rate and spot prices for the same period. Forward rates for both gold and silver were obtained from the London Bullion Market Association (LBMA) website. For copper, spot prices and forward prices were obtained from the Yahoo! Finance website
➤ Long-term prices—all three commodity prices were obtained from an average of consensus forecasts by a group of banks, making use of the 27 months' averages, in line with forward prices calculated at 27 months' averages
➤ Market index prices—all market index prices were obtained from the Bloomberg terminal database
➤ Company stock prices—the main source of stock prices was the Yahoo! Finance website, except for Durban Roodeport Deep (DRD) and Palabora Mining Company. For these two companies, this data was sourced from the I-NET BRIDGE database
➤ Company operating costs—companies' average annual operating costs per ounce (gold and silver) and per ton (copper) were obtained from the respective company annual reports
➤ Exchange rates—all exchange rates were sourced from the I-NET BRIDGE database. These were used to convert all prices used in the analysis to a common currency to enable the comparison of different data
➤ Other data—other data used in selecting stocks of individual companies such as revenue, assets, and production rates was sourced from company annual reports.
As some of the data required for testing the hypothesis could not be sourced in the format suitable for analysis, these were transformed into the required format by the authors. These were: forward prices for gold and silver, operating costadjusted market indices, and operating cost-adjusted spot prices for each company. Stock prices were determined on the basis of future earnings based on the commodity price per unit of product less the unit operating cost and amortized capital cost per unit. Total annual operating costs obtained from annual reports of the companies were averaged over 12 months for each year, and the result was used as the average monthly operating cost for each particular year and then deducted from the monthly commodity price in that particular year. For the construction of the operating cost adjusted market indices, the average operating costs of the index's top ten companies was utilized as the average annual operating cost for that particular index and converted to a monthly basis. The logic employed was that the markets would discount projected operating surpluses. For example, a gold mining company with operating costs of US$700/oz at a rate of production of 1 000 000 oz/annum would attract estimated surpluses of:
➤ US$500 million/annum at a projected US$1 200/oz gold price
➤ US$600 million/annum at a projectedUS$1 300/oz gold price
➤ US$700 million/annum at a projectedUS$1 400/oz gold price.
The above can be compared with a similar gold mining company producing 1 000 000 oz/annum but at higher operating costs(US$1 000/oz)to obtain the following surplus estimates:
➤ US$200 million/annum at a projectedUS$1 200/oz gold price
➤ US$300 million/annum at a projectedUS$1 300/oz gold price
➤ US$400 million/annum at a projectedUS$1 400/oz gold price.
Thus, when correlating market valuations with commodity prices (for example spot or forward prices) it is important to deduct operating costs from revenues before doing the correlations because investors would discount expected cash margins, not anticipated revenues. Two examples of how the average operating costs for indices were calculated and how the operating costs were used in adjusting the commodity prices for each index used in the analysis are illustrated in Examples 1 and 2, while Example 3 illustrates the calculation process used for forward price.
Example 1
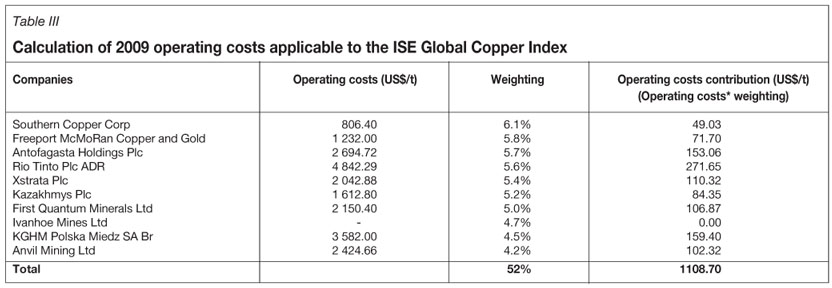
To calculate the average operating costs for the ISE Global Copper Index in 2009, the operating costs of companies that contributed 4% or more to the index were taken, weighted according to their contribution to the index, and summed to give the operating costs for that index in 2009 as shown in Table III. The first column (Companies) in the table shows companies with a weighting (in percentage) contribution of at least 4% to the index. The second column (Operating costs in US$/t) indicates operating costs for each company as quoted from the respective 2009 annual reports. The third column (Weighting) represents the contribution that each company makes to the index. The operating cost is then multiplied with the weighting to give the contribution of the company to the index's operating cost as indicated in the last column (Operating costs contribution in US$/t). The total operating cost is therefore the sum of the stocks of individual mining companies' operating cost contributions, which in this example works out to be US$1108.70/t (Table III).
Example 2
To adjust the commodity price of copper for the ISE Global Copper Index in 2009, the price of the same period is used. However, the operating cost shown in Table III is the annual cost and not a monthly cost; it is assumed that all the 12 months in 2009 had on average the same operating costs that can be used to adjust the monthly commodity prices in the same year. In January 2009, the spot copper price was US$3106/t. The average operating cost for the ISE Global Copper Index was calculated to be US$1108.70/t (Table III). The adjusted spot copper price for ISE Global Copper Index is therefore:
Cash margin per ton of metal=(Spot copper price/t – Average operating cost/t) =US$ (3106 – 1108.70)/t = US$1 997.30/t of metal produced.
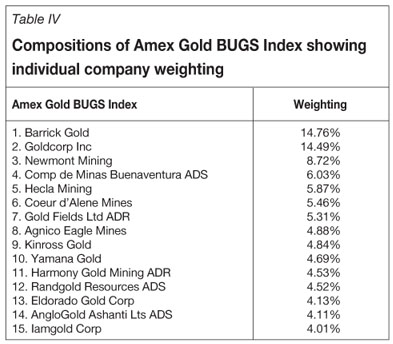
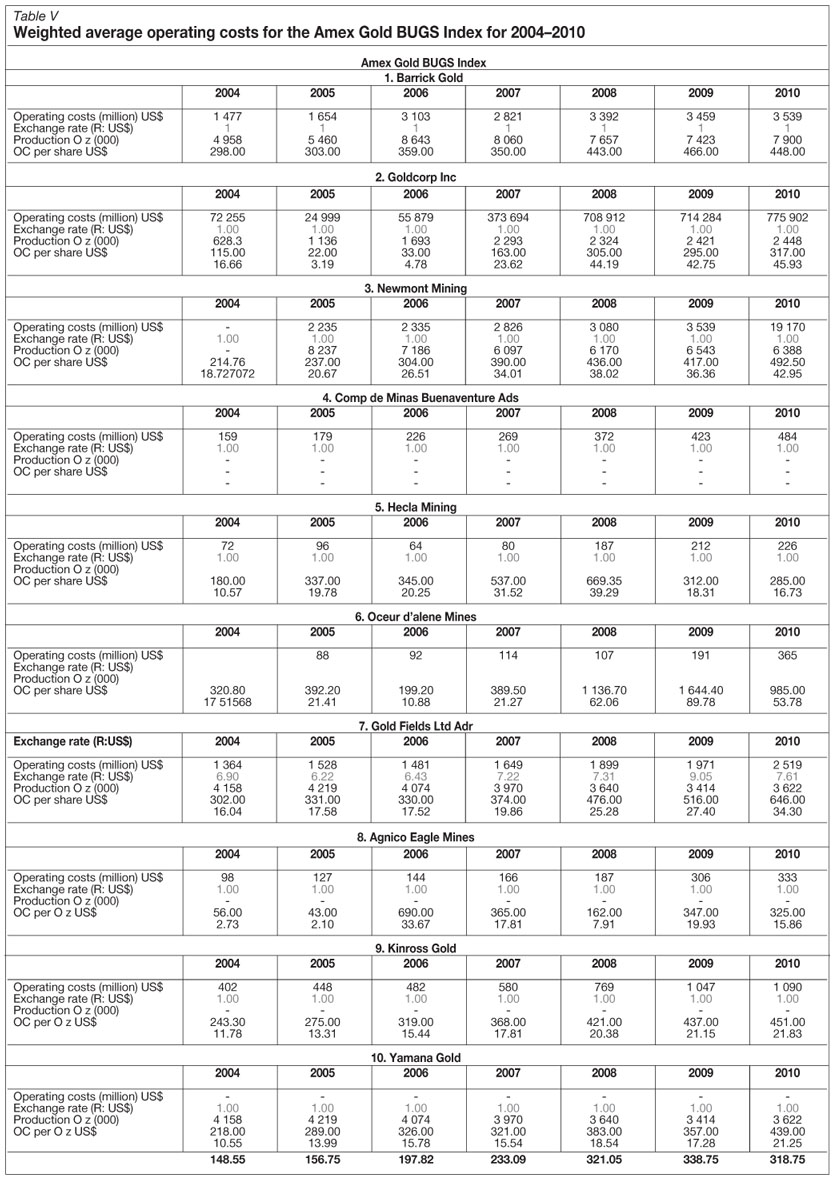
The operating cost-adjusted spot commodity price used in the correlation analysis of the ISE Global Copper Index in January 2009 is US$1 997.30/t. Using gold as an example, Table IV illustrates the weighting of each company making up the Amex Gold BUGS Index, while Table V shows the top ten companies in the Amex Gold BUGS Index and the summary weighted average cost for the index based on the ten companies for the period 2004–2010.
Example 3
The forward prices for gold and silver were calculated from the spot price using the following formulae, where GOFO is the Gold Forward Offered Rates and SIFO is the Silver Forward Offered Rates7,8:
➤ Gold forward price = gold spot price*{(1+GOFO)^2.25}, where GOFO is the gold forward rate and 2.25 represents 27-months GOFO rates, calculated by dividing 27 months by 12 months to convert it to annual terms
➤ Silver forward price = silver spot price*{(1+SIFO) ^2.25}, where SIFO is the silver forward rate and 2.25 is calculated as shown above in the gold forward price formula.
Gold Forward Offered Rates (GOFO) and Silver Forward Offered Rates (SIFO) are the rates at which market contributors (made up of members of the London Bullion Market Association) are prepared to lend gold and silver on a swap against the US dollar, respectively. Quotes are made for 1, 3, 6, and 12-month periods. Both GOFO and SIFO are determined on a daily basis by a consortium of banks, based on daily transactions concluded on gold and silver forward prices. Both rates are calculated from the London Interbank Offered Rate (LIBOR) and the gold lease rate and silver lease rate, respectively. Rates are quoted on a daily basis. The formulae used to calculate GOFO/SIFO are:
➤ GOFO = LIBOR – gold lease rate
➤ SIFO = LIBOR – silver lease rate.
However, for the purpose of this study, monthly averages were required that could be used in the calculation of monthly forward prices. These were calculated by using annual (12-month rolling) figures then converting these figures to their 27-month equivalents in order to maintain consistency with the copper data. The same methodology was used in calculating SIFO monthly averages. An example of how the 12-month average data was converted to 27-month equivalence is shown below using January 2004:
Gold spot price = US$401.7/oz
Monthly average GOFO = 1.07
The 27-month equivalent forward price is therefore calculated as follows:
Forward price = spot price *(1+GOFO/100)^2.25
= US$401.7*(1+1.07/100)^2.25
= US$411.45/oz
The factor of 2.25 is obtained by dividing 27 months by 12 months.
Data analysis
The Pearson correlation statistical technique was used because it was important to define and describe the strength of a possible relationship between commodity prices and mineral stock prices. The technique enables one to quantify the direction and magnitude of correlation. A necessary assumption for applying the Pearson correlation analysis is that relationships between variables are linear.
All prices were converted to a common currency, which is the US dollar, to be able to make a fair comparison. Statistical evaluations were conducted using MS Excel and a statistical package called SPSS (Statistical Package for Social Science). The reason for using two different tools was to validate the output by comparing the outcome of both packages. The SPSS package was used because it is readily available at the University of the Witwatersrand and can handle large data sets. There was an option to rebase data to 100 using the first month of when data is collected as the base. However, using rebased data produced distorted results and a decision was therefore made to use actual data.
Data obtained from each source is a monthly average that was assumed to be an end of month figure. However, some of the data did not have the same month end as others, and in these cases the last day of each month for the period under review was assumed to be the applicable month end. For operating costs of companies that report their finances in a different currency to the US dollar and did not quote the average exchange rate in their reports, the exchange rates used in the conversion of their operating costs into US dollar was assumed to coincide with the date of their annual reporting, in order to maintain consistency in the analysis. For example, if a company's end of year is 30 June, the exchange rate used to convert its costs into US dollar is the exchange rate quoted for 30 June of that year.
Results and validation
The correlation coefficient, r, is the single number that explains the relationship between two variables. However, as observed in this study, the correlation coefficient was found to be inadequate for making a conclusive decision on whether the relationship found between variables was real rather than one of chance. After the correlation results were obtained, a significance test was conducted by testing mutually exclusive hypotheses indicated in Table VI below.
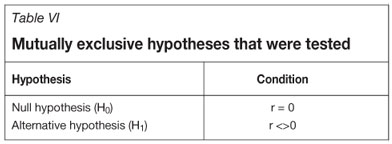
The test set the null hypothesis (H0) which states that the true correlation coefficient is equal to zero against the alternative hypothesis (H1) that this true correlation is not equal to zero, based on the value of the sample correlation coefficient. The P-value is the observed significance level of the test. If the P-value is less than the chosen significance level (alpha value, α), then the null hypothesis is rejected in favour of the alternative hypothesis. Otherwise, there is not enough evidence to reject the null hypothesis. An example to highlight this phenomenon is given as follows: if the P-value <0.01, the null hypothesis is rejected and the alternative hypothesis is accepted at a 99% confidence level, since α is set at 0.01. What this means then is that r is not equal to zero but rather less than or greater than zero. If the P-value >0.01, then there is not enough evidence to reject the null hypothesis and the null hypothesis is accepted.
Results obtained from MS Excel and SPSS were in most cases the same and those that varied were only a mere 1% different. They both depicted the same trend in terms of how each set of prices correlated with either the market indices or stocks of individual mining companies. The correlation of each set of prices with each index or company for all three commodities varied with the period under consideration as indicated in Table VII.
Overall, spot and forward prices tend to exhibit almost equal correlation with the indices and with individual mining companies for gold and silver. This could be attributed to the manner in which forward price is calculated for gold and silver, while for copper it was directly quoted from market estimates of forward prices.
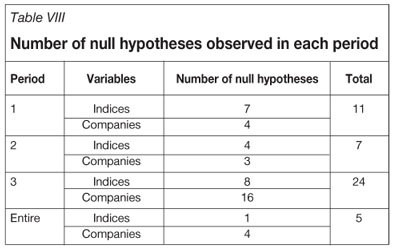
Period 3 yielded a higher number of null hypotheses than any other period under review, giving a total of 24 null hypotheses out the 54 results (Table VIII). Period 2 resulted in 7 null hypotheses out of 51tests, while Period 1 resulted in 11 null hypotheses out of 34 tests (Table VIII). The Entire Period resulted in 5 null hypotheses out of a total of 54 tests conducted for the period (Table VIII). For the tests that failed to reject the null hypothesis, it means that their correlation coefficient, r, is equal to zero.
However, in the statistical analysis conducted in this research study an r-value of zero does not mean that there is no correlation. This is because the study tested only the linear correlation relationship. In this instance an r-value of zero means merely that there is no linear correlation relationship between the commodity prices and either indices or stocks of individual mining companies. For the tests that rejected the null hypothesis, the r-value is less or greater than zero. This means that the linear correlation relationship that exists between commodity prices with indices and stock of individual mining companies is either positive or negative.
Tables VII and VIII indicate that there exists a correlation between mineral commodity prices and share prices of mining companies. It was also necessary to analyse how responsive investors were to mineral commodity price changes by observing whether there is a phase lag between changes in mineral commodity prices and the subsequent changes in mineral commodity based indices and share prices of individual mining companies. To establish whether there is a phase lag in investors' responses to changes in mineral commodity prices, phase lags of 1 month and 3 months were compared to the results without any phase lag, in order to establish whether there was a shift in the troughs and crests of graphs plotted from adjusted prices of commodities against prices of indices and share prices of individual mining companies. An example of how the analysis was done is shown in Figure 4.
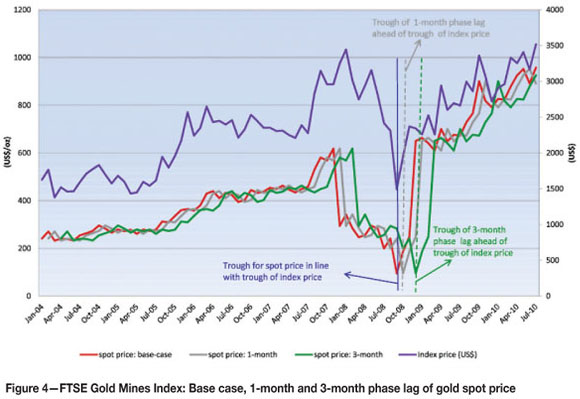
From Figure 4, it can be seen that the spot price is in unison with the index price, while the 1-month and 3-month phase lags have their troughs shifted forward. From the analysis conducted, it was therefore concluded that investors' response to movement in commodity price is immediate and there is no phase lag.
Interpretation of results
The results were analysed on a period by period basis so that the periods analysed were split up according to economic events that took place during the entire period under review, and which impacted commodity prices differently. The impact was more anticipated in Period 2, which is the GFC period. The periods prior to and post the GFC period were considered to be normal boom periods. These three periods were then compared to the Entire period.
Generally in statistics, the classifications depicted in Table IX are used in interpreting correlation coefficient values. In these classifications, the results are grouped in ranges to define the strength of the correlation between variables (Table IX).
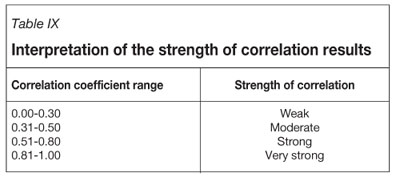
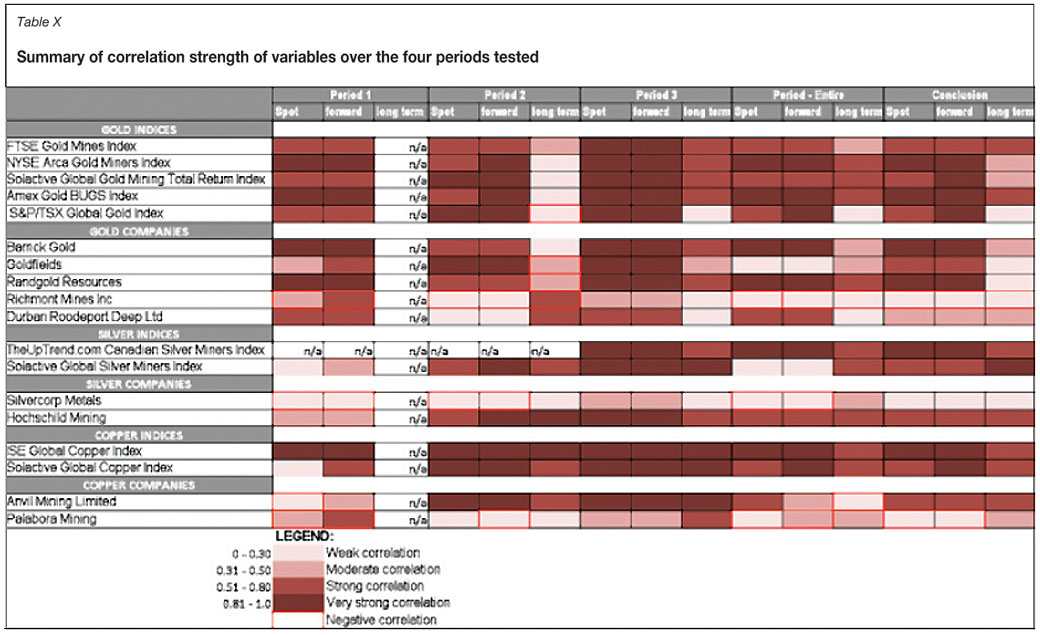
The ranges of the correlation coefficient represent both positive and negative correlations. For example, if a test between two variables gives an r-value of 0.25 it can be interpreted as a positive but weak correlation, while a test with an r-value of -0.25 can be interpreted as having a negative but weak correlation between tested variables. Therefore, in the interpretation of the r-values of statistical analysis done in this research study, the strength of correlation for each test was defined as indicated in Table X.
All five gold indices analysed in the study were positively correlated with the three sets of prices, in all periods tested. Spot and forward prices of these indices all yielded strong to very strong correlations only. Long-term prices correlated positively in all periods with the exception of the S&P/TSX Global Gold Index.
It can be observed from Table X that for Period 1 and Period 2, only one silver index, the Solactive Global Silver Miners Index, was analysed. TheUpTrend.com Canadian Silver Miners Index did not have data for the two periods. Overall, both silver indices were positively correlated for all periods and showed strong to very strong correlations only. Two silver companies were analysed in all four periods. Silvercorp metals yielded negative correlations for spot and forward prices in Periods 1 and 2, and the Entire Period. Hochschild Mining on the other hand was positively correlated with all three sets of prices in all four periods.
Two copper indices were analysed in all four periods, and both indices were positively correlated with the three sets of prices in all four periods. The ISE Global Copper Index yielded very strong correlations in all periods for spot and forward prices. Long-term price yielded very strong correlations except for the Entire Period, where the index yielded a strong correlation.The Solactive Global Copper Index yielded strong correlations for spot and long-term prices, while its forward price yielded very strong correlations. Anvil Mining and Palabora, the two copper companies that were analysed, both yielded a combination of positive and negative correlations. Anvil Mining yielded mainly positive and strong correlations for all three sets of prices. However, when the results are analysed on a period by period basis, Period 1 and the Entire Period yielded weak to strong correlations. Palabora yielded negative and weak correlations for spot and forward prices, while yielding positive and moderate correlations with the long-term price.
Discussion and conclusion
The market capitalization of a mining company is a direct function of its stock price, which is in turn directly related to commodity prices. The importance of mineral commodity prices in determining the value of a producing mining company is highlighted by the fact that future cash flows are projected based on commodity prices as a key input. Therefore, ensuring that the correct set of price parameters are used in the valuation is of paramount importance.
This research indicates that the spot price of mineral commodities does drive the share price of mining companies trading in those commodities. It is further suggests that spot price rather than longer-term prices should be used in any valuation of stocks of mining companies i.e. that real models rather than nominal models would tend to be more accurate. This view is also held by mining analysts who have observed that over the short term, the market reacts immediately to changes in the spot price of mineral commodities, but seldom reacts to analysts' long-term price projections9. However, mineral commodity prices drive share prices up only until the point where profitability stops to improving. Thereafter, other factors such as the company's potential for growth and the experience of its management come into play.
Acknowledgements
Ian Burvill and Mike Price of Resource Capital Funds (RCF), Australia, are acknowledged for initiating the research and providing the initial data for the project. Henk de Hoop is also acknowledged for arranging access to the Bloomberg terminal database in the RMB library.
References
1. KLASEN, N. Impact of resource prices and exchange rate on resource company share prices listed on JSE Ltd. MBA project research submitted to the University of the Witwatersrand, Johannesburg, South Africa. 2006. [ Links ]
2. ROBERTS, M. Duration and characteristics of metal price cycles. Resource Policy 34. www.elsevier.com/locate/resourpol, 2009. pp. 87–102. [ Links ]
3. RADETZKI, M. The anatomy of three commodity booms. Resource Policy, vol. 31, no. 1, 2006. pp. 56–64. [ Links ]
4. PINDYCK, R. and ROTEMBERG, J.J. The excess co-movement of commodity prices. Economic Journal, vol. 100, 1990. pp. 1173–1187. [ Links ]
5. DEATON, A. and LAROQUE, G. On the behaviour of commodity prices. Review of Economic Studies, vol. 59, 1992. pp. 1–25. [ Links ]
6. CASHIN, P.A., MCDERMOTT, C. J., and SCOTT, A. Booms and slumps in world commodity prices. IMF Working Paper No.99, (155). 1999. [ Links ]
7. BURVILL, I (2010). Vice President at Resource Capital Funds, Perth, Australia. Personal communication. 2 December 2010. [ Links ]
8. HOLMES, D (2010). Head of Commodities, Commarz Bank, London, United Kingdom. Personal communication. 9 December 2010. [ Links ]
9. ESTERHUZEIN, L (2010). Gold Analyst at Royal Bank of Canada, London, United Kingdom. Personal communication. 3 March 2011. [ Links ]◆
Paper received Jul. 2011

