


Services on Demand
Article
 English (pdf)
 Article in xml format
 Article references
Indicators

Related links
-
 Cited by Google
 -
 Similars in Google
Share

 Permalink
Journal of the Southern African Institute of Mining and Metallurgy
On-line version ISSN 2411-9717
Print version ISSN 2225-6253
J. S. Afr. Inst. Min. Metall. vol.111 n.7 Johannesburg Jul. 2011
TRANSACTION PAPER
An investigation of the potential impact of the new South African Mineral and Petroleum Resources Royalty Act
F.T. Cawood
School of Mining Engineering, University of the Witwatersrand
ABSTRACT
The new mineral royalty regime for South Africa was signed into law in November 2008, with its main objective being to compensate the State for the depletion of public minerals through a royalty charge payable from 1 March 2010. The aims of this paper are to establish the potential impact of mining royalties on State revenues, industry affordability, and explore whether the dual formula system is likely to encourage miners to become refiners. It also measures the royalty dispensation against economists' tax standards in an attempt to make a judgement on the 'equity' of the new system. This paper argues that most stakeholders should be comfortable with most of the requirements of the Act for most of the time. However, the new regime is unlikely to motivate miners to become refiners, as the benefit of the reduced rate on refined minerals appears to be insufficient to justify the additional costs to refine the mineral resource to the prescribed states of beneficiation.
Keywords: Mining royalties, mineral royalties, royalty impact, mining taxation, Royalty Act, resource rents, non-renewable resource, mine profitability, royalty formula, lease consideration, mining pay limit, mineral reserves, mining jobs, tax standards, value-addition, net smelter return, dual formula system, refined royalty, unrefined royalty.
Introduction
After a five-year process of consultation and intense debate, which included the release of four Draft Royalty Bills, the Mineral and Petroleum Resources Royalty Act was finally promulgated in November 2008 (MPRRA, 2008). The main purpose of the Royalty Act is to collect mining royalties from South African mines holding mining rights granted in terms of the Mineral and Petroleum Resources Development Act (MPRDA, 2004). The intention is to compensate the State for its custodianship over South Africa's nonrenewable mineral resources when these are exploited by mining companies for their own benefit. The main features of the royalty regime are first, that one of two formulae is used to calculate the rate of payment; second, this choice of formula requires an assessment on refinement; and third, both formulae are payable on a base of gross sales.
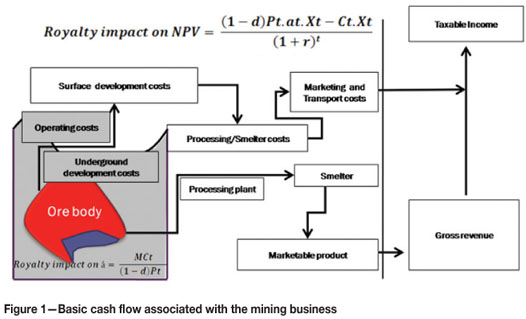
The Royalty Act makes provision for the royalty rate to fluctuate with mine profitability as expressed by EBIT1 and the degree of refinement. The nature of the sliding-scale system of royalties as applied to a base of gross mineral sales was discussed by Cawood (2010). The rates for refined and unrefined minerals are calculated using the following formulae:
Refined rate (Yr) = 0.5 + [EBIT/(Aggregate gross sales x 12.5)] x 100 or Unrefined rate (Yu) = 0.5 + [EBIT/(Aggregate gross sales x 9)] x 100)
The rate is calculated by using the appropriate formula, which is selected after classifying the mineral resource as either refined or unrefined. The minimum rate (a factor in the formula) is 0.5% for both refined and unrefined minerals. Factors 12.5 and 9.0 determine the maximum rates of 5% and 7% for refined and unrefined minerals respectively. This rate is then multiplied by the sales revenue in order to calculate the royalty amount.
Before establishing what the Act means to stakeholders, it is appropriate to consider the overall mining process of converting nonrenewable (natural) capital into renewable (reproducible) capital. The mining of a mineral resource presents a one-off opportunity to contribute to the net wealth of society. The business starts with a particular orebody with unique economic characteristics such as shape, size, quality, and distance to markets (Figure 1). The orebody is of little value in the ground and, for it to become valuable, it must be accessed (developed), removed from the host rock in which it occurs (mined); the valuable part must be separated from the ore after mining (crushing, processing, smelting, and refining) and finally, be moved to the market place where a transaction may occur (transported). This lengthy process requires investment in the form of capital and working costs, and it may take many years of exploration and development sunk cost before the final production can be exchanged for money. When this conversion eventually occurs, there is no guarantee that the mining company will make a return that justifies the risks taken. The industry is, therefore, particularly risky, which requires governments to understand the need for stability of terms, security of tenure, and protection against expropriation. Once the investment is made, the capital is captive, leaving companies at the mercy of governments. Profits are calculated annually as part of the taxable income calculation and when this amount is positive, government's income tax is triggered. Mineral royalties affect the mining process in two ways. The first is that a part of the ore body is sterilized and will never be mined because the cut-off grade is raised as a result of the royalty cost translating into a higher pay limit for the mine. The second is that the annual cash flow is reduced by the royalty amount that is paid over to the State, which leaves the company with less disposable income.
The potential impact of mining royalties on the fiscus
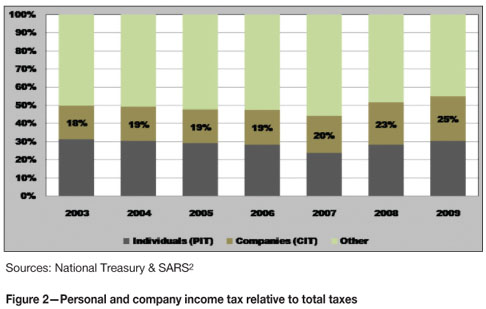
This section investigates the potential impact of the Royalty Act on government revenue collected from the South African mining industry. The vesting of mineral ownership, or in South Africa's case custodianship, is a policy statement on government's position on National Sovereignty over National Resources and how minerals must be used to support the wider public good. The royalty is one source of revenue for the government and becomes part of a larger pool of funds used for running the country. The size of the royalty income in relation to other government funds is directly related to factors such as mineral abundance, size of the industry, prices for mineral products and relative ease and cost of doing business in the country. Figure 2 illustrates the main sources of tax revenue collected by the South African government. It shows that the contribution of individuals is about 30% through personal income tax (PIT); revenue from company income tax (CIT) grew steadily from 18% in 2003 to 25% in 2009, while the balance comes from other taxes. Examples of other taxes are secondary tax on companies, tax on retirement funds, value-added tax, customs duties, fuel levies, excise duties, the skills development levy, and other charges.
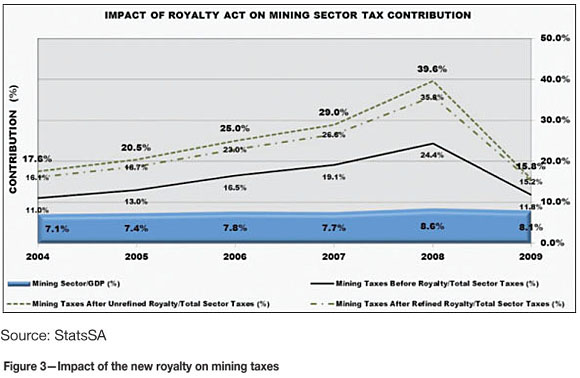
In analysing the mining industry's contribution to the total CIT, Figure 3 illustrates that mining taxes account for 16.8% of total company taxes (solid line) while the sector's contribution to GDP averaged 7.8%. The calculation is based on the statistics for the past five years. The broken and chain lines show how the Royalty Act would have impacted on the actual numbers had it been in force. If one builds the new royalty regime into the statistics as published by Statistics South Africa (Stats SA), one finds that the mineral sector is about to become even more important to the national economy. The gap between the chain and broken lines is an indication of the penalty that is applicable when minerals are not beneficiated to the levels stipulated in the Royalty Act. Such a study should also include an economic analysis comparing the value-addition costs with the difference in royalty amount when the lower royalty rate for refined minerals is applied to the larger base due to a higher price. The savings in the royalty payment must be compared with the costs necessary to bring the minerals to the refined state. Figure 3 shows that the expected impact of the Royalty Act is about an 8% rise in mining's contribution to company taxes or, alternatively stated, in boom times mining taxes are expected to rise by about 50% after implementation of the Act in 2010. The Act's potential impact is, therefore, significant. Indubitably, mining will play an even bigger part in the national economy of future South Africa. It is therefore important that the public appreciate its contribution. Such appreciation will avoid or counteract the ill-informed, but popular, political statements on nationalization and its perceived benefits.
The potential impact of mining royalties on the mining industry
Potential impact on profitability
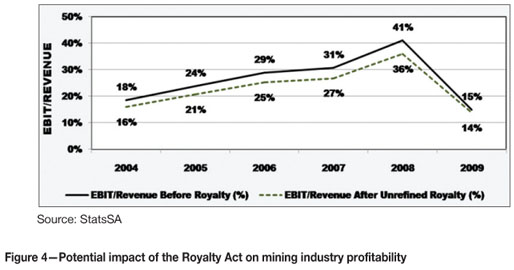
When it comes to the meaning of the Act to investors, the difference between the positions of international and local investors is minimal. Although mining companies are comfortable with paying mineral royalties, they are sensitive to the impact of such royalties on profitability and they certainly do not want frequent changes to either the base or the rate. They would also want their projects to be able to afford the royalty, i.e. the royalty payment must not economically jeopardize a project because of the higher pay limit. The setting of the base and rate requires an equitable balance. When the amount collected is too low, there is public resistance because of perceived deprivation of benefits. When the royalty amount is too high, investors will seek alternatives, resulting in capital flow to competing destinations. The potential impact of the Royalty Act on profitability is illustrated in Figure 4, which compares the actual profitability (solid line) for all South African mineral producers against what the maximum impact would have been had the Royalty Act been in force (broken line caused by using the unrefined formula) during the past few years. The graphs illustrate the following points:
➤ The impact is very difficult to predict because of changing market conditions
➤ The profitability ratios ranged significantly (between 14% and 41%), which is indicative of the cyclic nature of mineral prices and the need to spend capital in the industry
➤ The impact of the royalty, as measured by the gap between the lines, differs according to the level of profitability, which is the intention of the formula. According to Figure 4, the impact, as measured by the downward adjustment, is significant (4%) during times of high profitability, while less significant (1%) during times of low profitability.
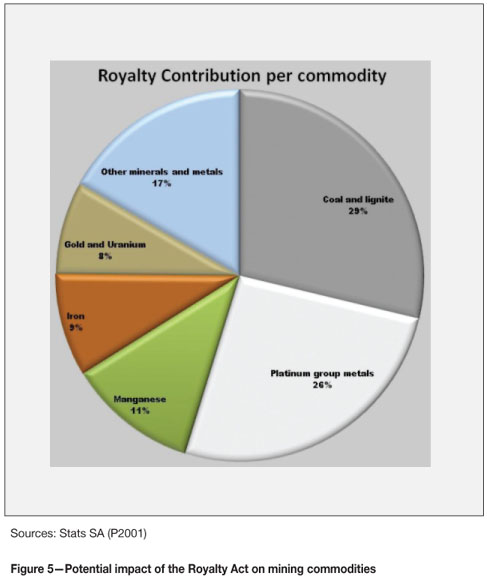
Potential impact on commodities
It is also useful to know which sub-sector of the mining industry will contribute most to the pool of mineral royalties. This information was calculated from StatsSA information, and surprisingly it was found that coal, rather than platinum (the biggest contributor to export earnings), would have been the highest contributor to royalties. Had the royalty regime been effective in 2009, coal would have contributed 28%, platinum group minerals 25%, and manganese 11% (Figure 5). Gold, once the cornerstone of the South African economy, would have contributed only 8%. The reader must be cautioned that these ratios are likely to change from year to year and such volatility will depend on fluctuations in prices and production outputs.
Potential impact on the ageing South African gold mines
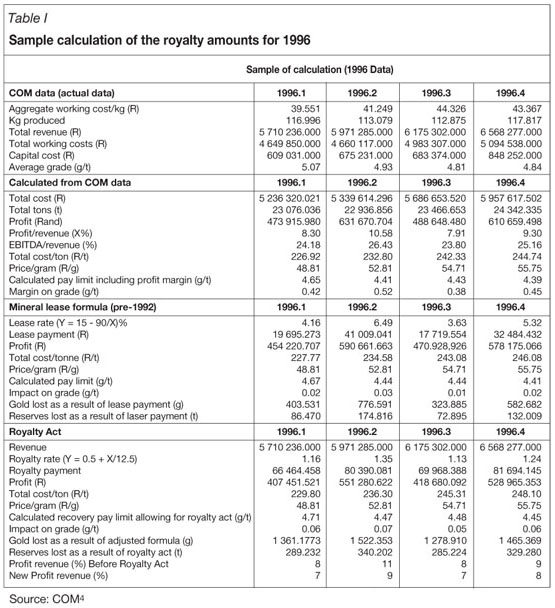
This section adds the new royalty regime to the actual quarterly information as reported by the gold-mine members of the Chamber of Mines (COM) of South Africa. The rationale is to investigate the impact on South Africa's ageing, high-cost gold mining industry. It determines the impact the Royalty Act would have had if the regime had been in force over the past 15 years, which period included both highly profitable and loss-making cycles in the gold market. It uses reported information without any bias on price, costs, profit margins, rates of production, or any other uncertain variable. In addition to analysing the impact of the Royalty Act, this section includes a quantitative comparison with the historic gold lease consideration system. The gold lease consideration system that is used in this analysis is payable on profits (similar to accounting taxable income) on a rate of y% = 15 – 90/X, where y is the lease rate, 15 the maximum lease rate, and x the profit to revenue ratio expressed as a percentage. For a comprehensive review on the structure and application of the lease formula, see Van Blerck. Profitability ratios ranged from minus 6% to plus 38% over the 15-year period, which illustrates the cyclic nature of this sub-sector. Table I provides a sample calculation showing 1996 data in order to evaluate the potential impact of the new regime as compared with the lease consideration of the past. Quarterly analysis is particularly useful for applying the marginal mine relief of the Royalty Act and the zero lease rate for the lease consideration system when the X-factor dipped below 6%.
Potential impact on the royalty amount (gold mines)
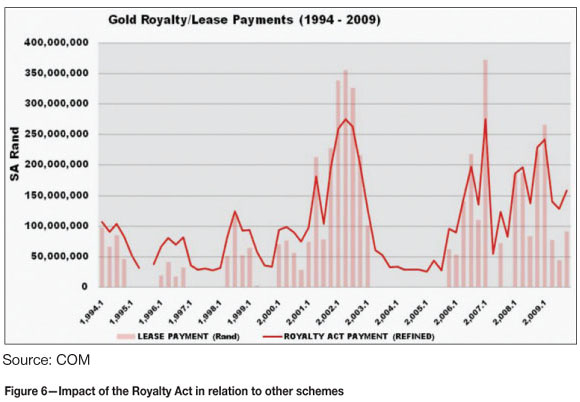
The royalty amount is calculated for the three schemes over the 15-year period to establish the quarterly amount and the flexibility of the regime to respond to changing market conditions and, more specifically, its efficiency in capturing economic rents. Figure 6 illustrates the impact, which reveals the following strengths and weaknesses of the original lease formula and the new scheme:
➤ The lease consideration is the most efficient for collecting rents during boom times, but collects no royalty revenue for government during bad times
➤ The Royalty Act does not collect as many rents as the lease consideration, but government can rely on a continuous stream of revenues during market downswings. The average royalty rate over the 15-year period was calculated as 1.41% of turnover revenue.
Potential impact on gold industry profitability
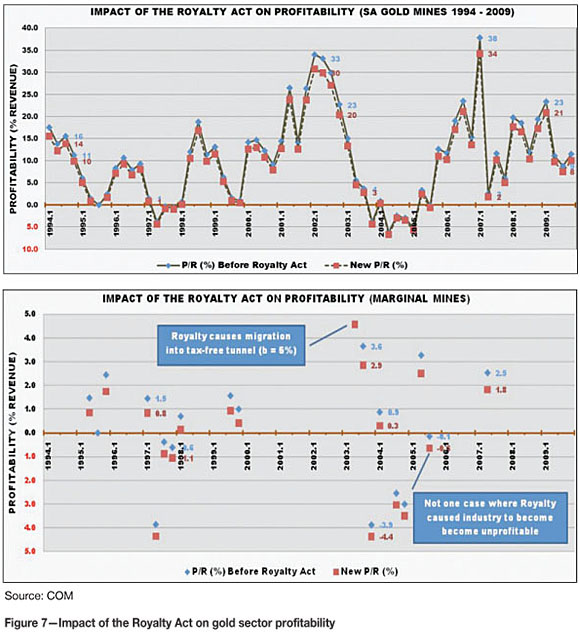
The approach for determining the impact of the royalty on profitability is similar to that taken earlier for other mines. The potential impact is illustrated in Figure 7, the first part of which compares the actual (combined) profitability (solid lines) for COM gold members against what the profitability would have been had the Royalty Act been in force (broken lines) for the past 15 years. The difference, ranging from 0.5 to 4% profitability, can be attributed directly to the Royalty Act. The second part of the figure shows an enlargement of the marginal zone, i.e. where profitability ranged from minus 5% to plus 5%. Five per cent was selected because of the income tax formula provision, which allows for a tax-free tunnel of 5%. This means that when a gold mine's aprofitability drops below 5%, it does not have to pay income tax despite being marginally profitable.
➤ The graphs illustrate the following points:
➤ Profitability ratios would have ranged from minus 6% to plus 38% over the period, which is typical of the cyclic nature of the industry>
➤ As expected, the impact of the royalty would have been significant during times of high profitability (4%), while less significant during times of low profitability (0.5%)
➤ The potential impact is minimal for marginal gold mines. Not once over the 15-year period had the royalty caused a positive ratio to become negative
➤ It is possible for the royalty payment to cause the profitability ratio to drop below the 5% margin. This drop will cause the income tax rate to become zero for that quarter and will reduce the overall impact of the royalty on the total tax take.
Despite the above observations that demonstrate affordability, gold mines are more labour-intensive compared to most other mines, and more research is required on the impact of the Royalty Act on individual mines. To fully understand the true impact further analysis is required especially of low grade marginal mines and how the Act affects employment. This study should include a comprehensive socio-economic study.
Potential impact on the gold pay limit
Determining the economic cut-off grade starts with the calculation of the mine pay limit, which is defined by Storrar (1981) as '... that value at which it is estimated that ore can be mined without a profit or loss'. For gold mines in South Africa, the pay limit is calculated as follows:
Recovery pay limit in g/t =
Cost in SA rand per tonne milled
Price in SA rand per gram of gold
From the reported quarterly information, recovery pay limits were calculated using Storrar's approach. Once the required pay limit for recovered metal in the gold plant is known, the profit margin and technical mining factors need to be considered in the estimate of the gold grade at the mining face. A flowsheet calculation is used to account for plant inefficiencies, mining inefficiencies, underground dilution, and losses during transport.This situation has the effect that the actual mining grade is higher than the calculated pay limit grade (Figure 8). The exception is for loss-making periods, which are due to the inelasticity of supply in response to lower prices in the short run (e.g. 1997/98 and 2004/05). Figure 8 also shows that this situation is corrected in the longer run and the expected time lag causes profitability margins (indicated by the gap between the two lines) to vary significantly over time. The average profit margin on grade over the 15-year period was found to be 0.48 g/t. Apart from known inelasticity of supply issues, the small margin shows commitment by the mining companies to avoid short-term high-grading strategies and willingness to weather bad times to prolong mine lives and protect employment.
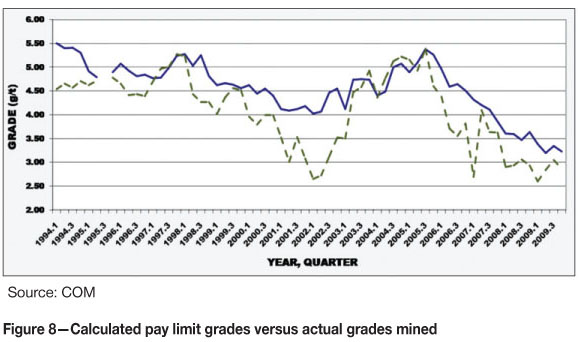
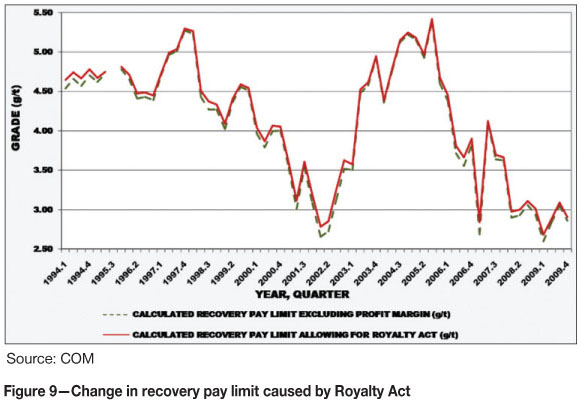
Figure 9 illustrates what impact the new Royalty Act would have had on the calculated pay limit if it were in force over the past 15 years. It shows that it would cause the pay limit to rise, thus causing a fall in production. The average impact on the pay limit of 0.06 g/t appears to be insignificant but requires further and individual investigation for low grade gold mines.
Potential impact on gold reserves
Reserves are defined in the SAMREC Code (2000) as ' the economically mineable material derived from a measured and/or indicated mineral resource. It is inclusive of diluting materials and allows for losses ... [and] ... modification by, realistically assumed mining, metallurgical, economic, marketing, legal, environmental, social and government factors.'
The new mineral royalty tax can be regarded as one of the government's modifying factors referred to in the above definition. One must appreciate that any tax impacts negatively on the mine pay limit and hence reserves; and SAMREC requires reporting of any changes that materially influence the reserve statement and hence its asset value. Materiality, according to the Code, is achieved when 'A Public Report contains all the relevant information that investors and their professional advisors would reasonably require, and expect to find, for the purpose of making a reasoned and balanced judgement regarding the Exploration Results, Mineral Resources and Mineral Reserves being reported on.'
Perhaps the best indicator for measured reserves, when one has the opportunity to look back in time, is that portion of reserves that has been mined during the review period, which implies that all legal, economic, and technical factors have already been considered. Such an exercise, combined with the new royalty, caused the mining pay limit to rise by 0.06 g/t. By comparison, the lease consideration would have caused an increase in the pay limit of 0.04 g/t. The consequence of the rise in the pay limit is that a cumulative mass of 73 182 kg of gold would potentially not have been mined between 1994 and the end of 2009 because these reserves would have been calculated as uneconomic. Considering that 5 371 782 kg had been mined during this period, the rise in the pay limit would have caused a reserve reduction of only 1.4%. In comparison, the lease consideration would have caused a decrease in reserves of 1.3%. Although this percentage seems insignificant and immaterial, it caused a destruction of value to the tune of R7.1 billion. By comparison, the lease consideration would have resulted in a loss of R5.0 billion value because of sterilized reserves. Although this 'loss' sounds like a catastrophe, one must bear in mind that, in the international context, the average calculated royalty rate of 1.4% would be considered reasonable – perhaps generous.
The gold sector investigation questions the equity of the new Royalty Act. The cumulative value of the royalty over the period is R6.5 billion, and if the costs of the royalty are considered in terms of revenue lost, this represents a net loss for the country of R0.6 billion. This calculation suggests that the value destroyed is not covered by the benefit of the royalty going to the fiscus. Another concern is that although an increase in the pay limit is not critical for already developed high-grade mines, the impact would be significant for mines that are already operating on or close to the average grade of their reserves. For mines that do not have ready-developed high grade reserves in stock, it would mean premature closure.
Potential impact on value addition
It is also essential to investigate whether or not the policy intent of motivating mineral producers to add sufficient value to production, so that the sales product could meet the Royalty Act's definition for a refined mineral resource, would be achieved. As a reward for this spending on value addition, producers will pay according to the formula that will cause the royalty rate to be reduced to a maximum of 5%. This section explains a method to judge whether or not the reduced rate is sufficiently attractive. Bradley identified the following issues that need to be considered when developing royalty instruments that promote value-addition to minerals:
➤ Different minerals require different amounts of processing before sale
➤ The value added per unit cost is not the same for all minerals
➤ The royalty on processed products must target minehead value, which could be calculated by subtracting processing costs from the value established at the point of sale (i.e. netback or Net Smelter Return calculation)
➤ As an alternative to a netback calculation, a schedule of rates according to different levels of processing can be specified. The Western Australian royalty system uses this approach. It is based on the assumption that exmine value is 25%, ex-crushing-and-screening 33%, and concentrates 50% of refined value. These values are calculated from average unit costs (or value added) by stage of processing. This approach leads to royalty rates that are scaled downward with successive stages of processing until the refined stage is achieved.
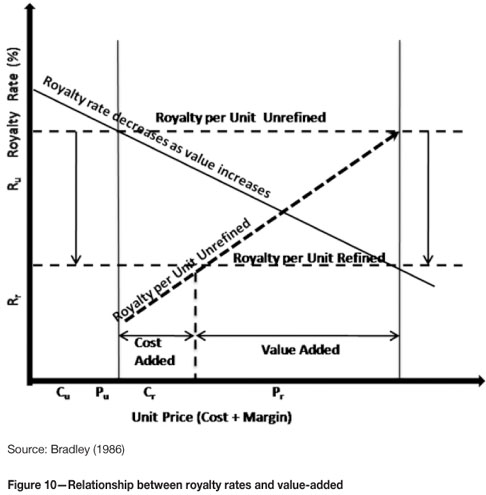
Bradley's scheme is illustrated in Figure 10, which depicts the situation where royalties are assessed at the refined stage, as is the case with the Royalty Act. The bottom line is that a low royalty rate for refined minerals (e.g. 2.5%) yields the same royalty income as a high rate is applied to minehead value (e.g. 10%). The result is a negative relationship between the royalty rate and unit price. Value-addition costs are justified when the increase in unit price less royalty savings as a result of the reduced rate is greater than the additional costs (Cr) incurred in refining the production. The value added is then the difference between the price received and the total cost required to bring production to its desired state of beneficiation. The policy objective is achieved when the unrefined rate shifts down to the refined rate. It is economically beneficial to the company when first, there is an intersection between the line joining the refined and unrefined royalty rates, and second, such intersection occur somewhere between Pu and Pr (Cr in the illustration).
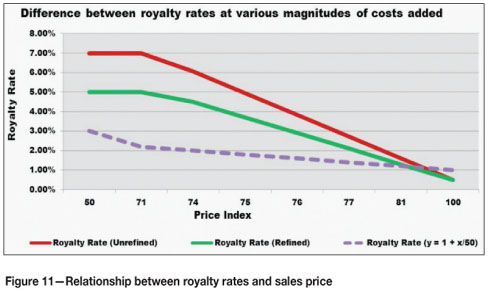
In order to apply Bradley's approach of having fixed royalty rates versus specified levels of beneficiation to the South African system, several problems need to be overcome. The most important of these are the impacts of EBIT and the dual formula system, which causes the lines to intersect at the minimum royalty rate when maximum costs are added (i.e. an index price of 100). This is illustrated in Figure 13. Because the lines are not parallel, as is the case in Figure 11, the incentive to beneficiate is reduced. The smaller area available for a clear intersection is caused by the small difference (only 2%) between the maximum rates of the two formulae. The formula system, therefore, poses a challenge in that the lines are no longer horizontal and to make things worse, a smaller area is available for intersection as the price increases because of the value added. The difficulty of achieving a clear intersection reduces the incentive for value addition. The formula approach, therefore, requires a larger difference in minimum and maximum rates before mines will take up the offer and add sufficient value to meet the definition for refined mineral resources. A better intersection can be achieved by increasing the F-factor in the royalty formula, for example from the present 12.5 to 50, which is demonstrated in Figure 11.
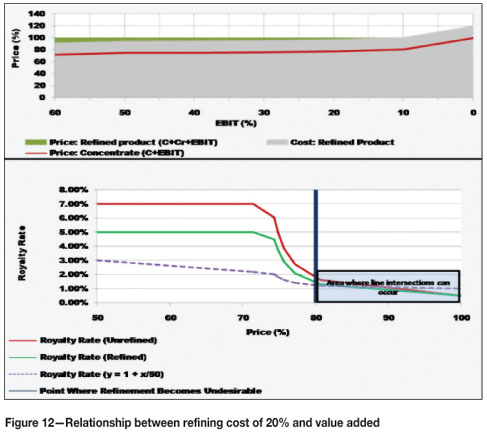
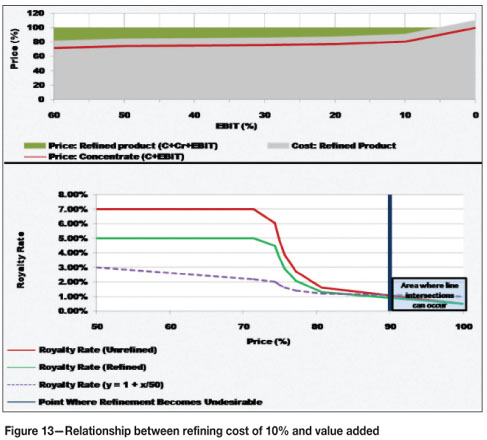
Another issue for mines to consider is the impact of value addition on the target level of profitability. Figures 12 and 13 apply Bradley's scheme to the South African regime. The top illustration gives the relationship between price (expressed as an index where the refined value is 100) and target EBIT ratios. The red line represents the total price up to concentrate level, which price includes costs plus a target EBIT margin. The grey section below the concentrate price represents the sum of the predetermined target EBIT and the cost for beneficiating the mine's production to concentrate level. The area above the red line is made up, by the addition of the refinement cost and the value added after considering the royalty scheme (green portion). The bottom illustrations explore what Bradley's graph would look like under the circumstances. It shows royalty rates against total costs as components of sales price. As a general rule, the incentive to spend the additional costs on refining (Cr) becomes less as one progresses from left to right in the graph. The right-hand side of the graph allows for fewer intersection opportunities. Unfortunately, one finds oneself at the wrong end of the graph, which suggests that the gap between the refined and unrefined royalty rates is not sufficiently wide to motivate miners who sell raw production to become refiners. The conclusions from Figures 12 and 13 are:
➤ When refinement costs represent more than 20% of the sales price, very little value is added and the costs are probably not justified
➤ When refinement costs represent 10% of the sales price, significant value is added and the costs are justified
➤ The inability to engineer a clear intersection opportunity is problematic for the decision whether or not to spend the additional capital in order to benefit from the switch from the unrefined to the refined formula
➤ It would perhaps be more effective to have one formula and allow the costs of refinement to be deducted from sales revenue. Alternatively, factor f in the refined formula can be increased so that the maximum rate is significantly reduced.
The analysis above is certainly not exhaustive. More indepth analysis using actual and mine-specific information is required before one can support the above-mentioned conclusions with confidence. However, if one compares the Western Australian assumption that refinement accounts for about 50% of the sales price with the finding above, that the motivation for South African producers diminishes when refinement costs account for more than 20% of the sales price, the additional spending on value addition will probably not be justified under the circumstances. This preliminary assessment, therefore, indicates that it is unlikely that the policy objective of value addition will be achieved under the current two formulae.
Measuring the act against standard economic principles
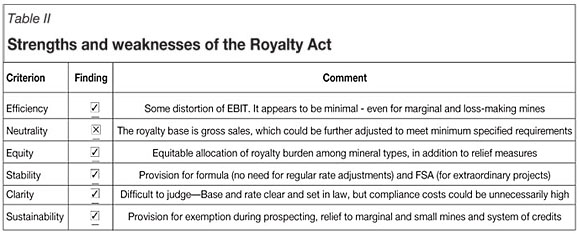
Economists have developed international standards to evaluate tax regimes. Otto observed that the principles of measuring the equity of a taxation regime apply equally to mineral royalties, i.e. the royalty should be efficient, neutral, stable, fair, clear, and allow for sustainable development of mineral resources. These principles are idealistic, and political pressure to maximize tax revenue makes it unlikely that any tax will meet all criteria. Table II summarizes the results of the exercise. The overall finding is that there are more positive than negative aspects associated with the new mineral royalty regime. At an educated guess most investors will be comfortable with most of the requirements of the Act for most of the time. This is not to say that they will find it acceptable, because some of the peculiarities, such as adjustments to gross sales value, will unnecessarily raise the cost of compliance.
Economic efficiency
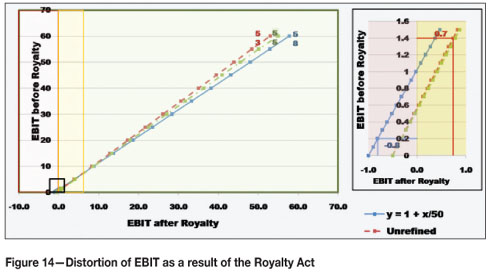
An efficient tax is one that collects revenue for the government without significantly affecting the behaviour of the pertinent economic actors or distorting economic activity. Such a tax is neither so high that it will reduce the level of activity nor excessively generous. Bradley (1986) cautioned that care must be taken to avoid economic distortion caused by gross sales royalties, and observed that the royalty becomes inefficient when it impacts on the optimal production profile. The previous section concluded that there is insignificant distortion of EBIT and the pay limit if the royalty regime is added to past reported results, which makes it efficient using Bradley's interpretation. Efficiency is further illustrated in Figure 14, which explores the relationship between EBIT before and after the royalty. The figure shows the efficiency of collecting more revenue at high EBIT ratios. The insert on the right hand side is an enlargement of the relationship between the two EBITs at marginal and lossmaking ratios. It demonstrates that the Royalty Act causes a marginal pre-royalty EBIT of 1.4% to be reduced 0.7%. For a loss-making operation, EBIT will be reduced by the minimum rate of 0.5%. Despite this negative impact, it would be unfair to blame the Royalty Act as the cause for a mine becoming unprofitable.
Neutrality
When a tax is neutral, it will not affect decisions on which projects within the industry are undertaken and which are not. It should also not affect mine design parameters. A tax is perfectly neutral when aimed at economic rent, which will also make the tax more efficient. However, political pressure to maximize revenues and sovereignty over natural resources, and fiscal instruments to protect local industries cause governments to design non-neutral regimes. Political pressure to introduce gross sales royalties pushed the Royalty Act away from tax neutrality. The insistence on a revenuebased royalty and the insignificant allowable deductions in the computation of gross sales could prove problematic in the future – especially if gross sales are adjusted upwards for marginal and loss-making mines.
Equity
Equity means fairness, which must take into account both ability to pay and benefit-related principles. This concept of utility maximization, a tax that gives greatest satisfaction to a large number of parties, then becomes the main criterion for measurement purposes. This paper illustrates that most mineral producers would be able to afford the royalty and that there is an equal burden for different mineral products across the industry. In the author's view, a fair balance in the Royalty Act in terms of equity exists – both in respect of balancing government and investor interests and applying the same formulae consistently to all mineral types and products.
Stability
This standard aims at preventing frequent adjustments to the royalty rate and base. The likelihood that a fiscal regime will remain unchanged depends on two factors, i.e. the stability of government policy and the flexibility of the regime to accommodate sudden and unexpected changes in project economics. The balance between stability and flexibility is particularly important during a project's payback period. States can achieve stability by introducing either sliding-scale instruments or Fiscal Stability Agreement (FSA). FSAs are available in countries such as Chile, Indonesia, PNG, and Peru, and can be successful if structured favourably to both the State and the investor. Stability can also be achieved by defining rates in Law, but the law-making process is too slow to respond satisfactorily to rapidly changing market conditions. The Royalty Act contains both these measures, and although the rate will change annually, the parameters of the formulae enable certainty for forecast purposes.
Clarity
The standard of clarity requires non-arbitrary administrative rules that are clearly understood by both government administrators and investors, which relates to the ease of administering the royalty and the transparency of the entire royalty regime. Smith's (1776) description of clarity is still relevant today, namely '...The tax which each individual is bound to pay ought to be certain, and not arbitrary. The time of payment, the manner of payment, the quantity to be paid, ought all to be clear and plain to the contributor'. While the simple structure of the formula means that administration should be easy, the complex wording of the Act and the provision for adjustments by SARS will unnecessarily raise compliance costs for companies.
Sustainability
This standard requires measures to be put in place to sustain the business. These measures could be implemented through a number of provisions, for example by making it possible to reinvest profits to fund expansions (credit for expenses reinvested) and to allow deduction of exploration expenses funded from mining profits. These include generous provisions for the treatment of exploration costs, e.g. uplifts, immediate deduction of new capital programmes, and large ring fences. The Royalty Act allows for exploration costs to be deducted for the purpose of EBIT, while the ITA allows for the deduction of exploration costs in the income tax calculation. The allowance for prospecting in the royalty regime is, therefore, considered adequate. In addition, the Royalty Act makes provision for exemptions, reliefs, and credits for the purpose of reducing or waiving the royalty due to the State. These exemptions are the small business exemption (Royalty Act Section 7), exemption for sampling (Royalty Act Section 8), and rollover relief upon disposals (Royalty Act Section 9).
Conclusion and opinion
This study confirms that the Royalty Act has the potential to significantly impact on government's take from the mining industry (or country benefit from mining company contributions). The impact can be summarized as follows:
➤ Mining taxes are expected to rise by about 50% after implementation of the Act in 2010, and the impact of the royalty will be more significant during times of high profitability, but less significant during times of low profitability
➤ Coal and platinum mines are expected to be the major contributors to the royalty pool in the fiscus
➤ The average royalty rate for gold mines over the past 15 years period was calculated as 1.4%. This rate would have caused the mining pay limit to rise by an average of 0.06 g/t. The increase in the pay limit would have led to a reserve reduction of 1.4%, which is immaterial from a reporting perspective. SAMREC requires a company to make the necessary adjustments when conditions change. Although a detailed report will not be necessary, a general comment that explains the downward adjustment would be appropriate in the Competent Person's report.
This article has covered some aspects of the potential impact of the new South African Royalty Act. After considering the issues, it is the author's opinion that:
➤ The State will receive its fair share of revenue perhaps more than its fair share
➤ Industry can afford the royalty regime of the Act, but more research is required on the impact on marginal mines
➤ Most stakeholders will be reasonably comfortable with most of the requirements of the Act for most of the time
➤ The Act measures up with most economic standards, except for neutrality and perhaps clarity and
➤ The dual formula system is unlikely to encourage value addition, considering the small gap between refined and unrefined royalty rates. However, more research is required on several commodities at different stages of value addition and life of mine.
References
BRADLEY, P.G. Report of the mineral revenues inquiry in regard to the study into mineral (including petroleum) revenues in Western Australia, 1986. [ Links ]
CAWOOD, F.T. Reading between the lines of the new South African Mineral and Petroleum Resources Royalty Act: background, theory and fundamental principles. Resources Policy 35, 2010. pp. 199–209. [ Links ]
MPRDA. Mineral and Petroleum Resources Development Act 28 of 2002, 3 October 2002. Government Gazette, vol. 448 No. 23922, as amended. Date of commencement 1 April 2004. [ Links ]
MPRRA. Mineral and Petroleum Resources Royalty Act 28 of 2008, GG No 31636, vol. 521 Assented to 17/11/2008 and signed into law 24/11/2008, as amended. Mineral and Petroleum Resources Royalty (Administration) Act 29 of 2008, GG vol. 521, no. 31642 of 26 November 2008, as amended. [ Links ]
OTTO, J.M. Global Mining Taxation Comparative Study. Institute for Global Resources Policy and Management, Colorado School of Mines, Golden, Colorado, USA, September 1997 [ Links ]
SAMREC. South African Code for reporting of mineral resources and mineral reserves. The Southern African Institute of Mining and Metallurgy, Johannesburg, March 2000, as revised and amended. [ Links ]
SMITH, A. An Inquiry into the Nature and Causes of the Wealth of Nations. Oxford University Press, London, various editions (1776–1993). [ Links ]
STORRAR, C.D. South African Mine Valuation. Chamber of Mines of South Africa, Johannesburg, 1981. [ Links ]
VAN BLERCK, M.C. South Africa Proposed Mining Royalties—A Critique. The Southern African Institute of Mining and Metallurgy Colloquium on The Mineral and Petroleum Royalty Bill, Johannesburg, 16 April 2003. [ Links ]◆
1 EBIT or Earnings Before Interest and Taxes closely resemble net profit and/or profit before tax definitions.
2 National Treasury & SARS, 2008/9Tax Statistics and Budget Review 2009/10 and SARS Annual Report 2007–2008/9. Available from www.treasury.gov.za and www.sars.gov.za.

