


Serviços Personalizados
Artigo
 Inglês (pdf)
 Artigo em XML
 Referências do artigo
Indicadores

Links relacionados
-
 Citado por Google
 -
 Similares em Google
Compartilhar

 Permalink
Journal of the Southern African Institute of Mining and Metallurgy
versão On-line ISSN 2411-9717
versão impressa ISSN 2225-6253
J. S. Afr. Inst. Min. Metall. vol.111 no.6 Johannesburg Jun. 2011
TRANSACTION PAPERS
Gravity separator performance evaluation using Qemscan® particle mineral analysis
J.D. GroblerI; J.B. BosmanII
IExxaro Resources
IIPESCO
SYNOPSIS
In a gravity separation device, particle shape, size and density all play a role. The combination of these determines where each individual particle reports to in the viscous fluid, where particle crowding (solids to water ratio) also plays a role. To understand the performance of gravity separation devices in the heavy mineral industry, these particle characteristics need to be measured. There are various challenges in analysing particle density and particle size simultaneously for the purpose of quantifying gravity separator performance, not to mention particle shape. These analytical challenges include the high cost of high-density sink-float fractionation, toxicity of high-density sink-float media, inability of sink-float media to fractionate at densities greater than 4.0 g/cm3, and the time-intensive nature of these fractionations. The use of the detailed particle-by-particle output from Qemscan® particle mineral analyses (PMA) as a fast and cost-effective alternative is evaluated. The size and density outputs from the Qemscan® were employed to characterize the performance of a heavy mineral spiral concentrator as an example. Critical analytical requirements are to be addressed before the Qemscan® output data can be utilized.
Keywords: Gravity separator, performance, heavy minerals, Qemscan® particle mineral analysis
Introduction
Measurement of gravity separator performance in the heavy mineral industry
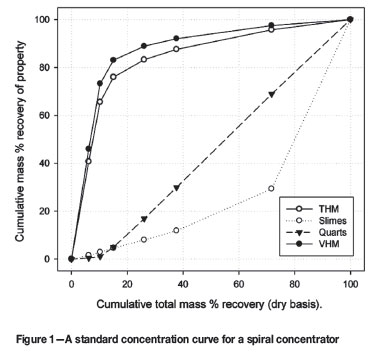
The performance of heavy mineral gravity separators is usually measured using the grade and recovery of valuable heavy minerals. This information can be used for both circuit design and evaluation. The standard practise for gathering valuable heavy mineral grade and recovery information is by sampling the gravity separator product within a measured time frame. The product is divided into different fractions using devices such as mouth organ splitters. Each of the sample fractions is analysed for its total heavy mineral content (THM) by performing a sink-float analysis in a heavy liquid medium (tetrabromo ethane medium at 2.9 g/cm3). The chemical or mineral content of the sink fractions is subsequently determined to derive the valuable mineral content (VHM)-which is usually defined as the sum of the zircon, rutile and ilmenite percentages within the THM. A standard concentration curve can be drawn up from the THM and VHM mass distribution across the gravity separator profile-see Figure 1 for a curve for a spiral concentrator.
Shortcomings in the measurement of gravity separator performance
There are various shortcomings with this standard practice. The combination of particle density, size and shape determines where the particle reports to, and not only the particle mineral content. A pure mineral particle will have the theoretical density of the mineral phase, and it is for this reason that mineral content has been used to date to characterize a gravity separator performance since it indirectly characterizes particle density (see Figure 1). In the case of large populations of mixed mineral phases in single particles, overall mineral content would not be able to describe density separation performance. The mineral content alone, would also not be sufficient to explain fundamental gravity separator behaviour. For example, the recovery of zircon would be negatively impacted if the particle size distribution of the zircon in the feed material became finer, but since only mineral content is measured and not in combination with particle size it will not be understood. The shortcomings of the current measurement technique lead to shortcomings in understanding performance, which is applicable to both the operation and design of gravity separators. The question that arises is what other, more effective, measurement techniques are available to quantify size and density simultaneously and what are their shortcomings?
Shortcomings in the simultaneous measurement of particle size and density
A particle size distribution can easily be determined by screening particle packages, but the main challenge is determining the density distribution within these sized particle packages. A standard industrial technique that can quickly and easily divide the sized particle package into its different density classes is not available. Single particle pycnometry would be ideal, but since the particles are so small (smaller than 200 µm) no accurate determination of the particle mass is possible. Sink-float fractionation at higher densities (3.5 to 4.0 g/cm3) is a costly and time-intensive exercise and it does not fractionate the more dense minerals (for example ilmenite, zircon, and monazite). Water-based separation techniques (small shaking tables or elutriators) have separation inefficiencies that compromise the accuracy. Measuring the total density of particle packages by gas or liquid displacement gives a combined density for all the particles in the population in which individual particle's character can be easily 'diluted'-unless it is similar in nature to the rest of the particle population. Effective density fractionation remains a challenge unless a technique can be utilized that does not divide the mineral particles into physical fractions. The following section explains an alternative size-density measurement technique.
Experimental
Qemscan® Particle mineral analysis output
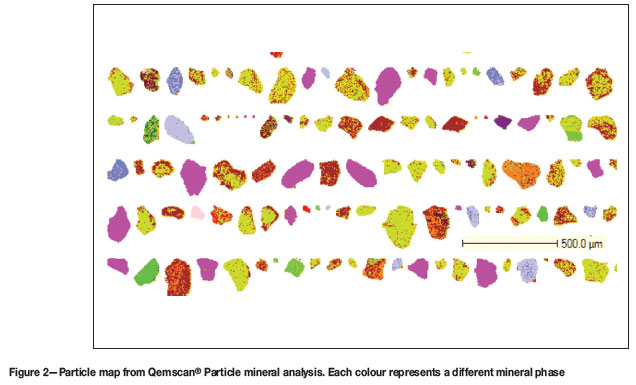
Over 10 000 heavy mineral grains are set in a resin mixture and polished to expose the individual particles. Approximately 3500 grains are analysed by the Qemscan® particle mineral analyses (PMA) technique on a 5 µm by 5 µm grid. The Qemscan® PMA produces a particle map, depicted in Figure 2 below, containing textural data such as particle size and shape, and also mineralogical data, from which particle density is derived.
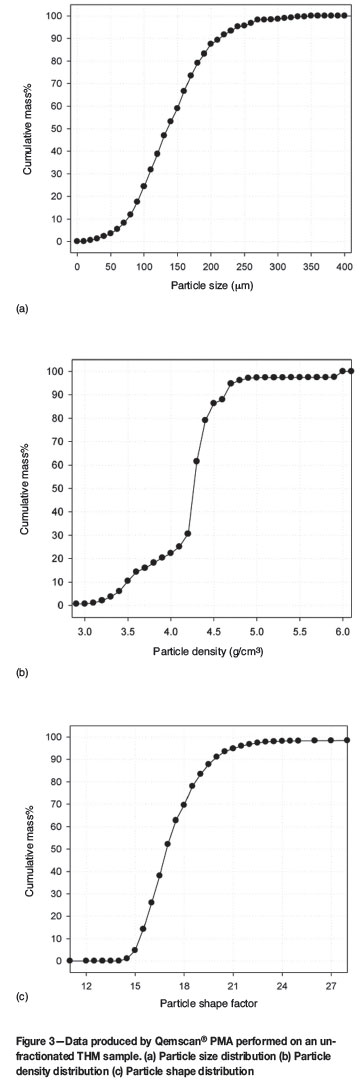
A particle size distribution, shape distribution, and density distribution can be drawn up from the data produced by the Qemscan® PMA, as shown in Figure 3. Particle shape is difficult to define as a single number and only the sphericity of the particle was evaluated for the purpose of this investigation.
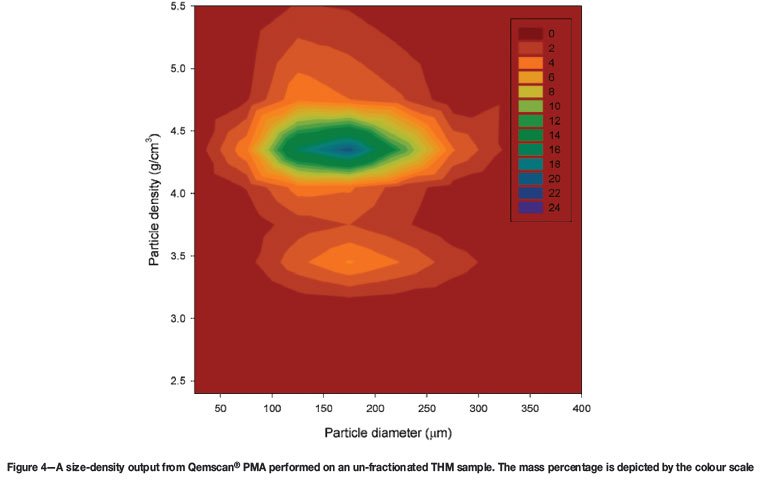
The particle masses in the population are mathematically grouped in the different size-density classes as depicted in Figure 4. The THM sample showed a high concentration of particles in the density range of 4.4 g/cm3 and particle diameter of 180 µm. Lower concentrations of low and high density particles are visible.
Prior to using the data from the Qemscan® PMA, the following important analytical requirements need to be addressed.
Analytical requirements in using Qemscan® PMA particle-by-particle data
Sample preparation and representivity
Since only a small fraction of the sample, i.e. less than 10 mg, will be exposed at the surface of the polished section and available for analysis, it is paramount to ensure that representative splitting and sample preparation procedures are applied. The splitting process through multiple splitting stages, the block preparation procedure, and block orientation within the Qemscan® analysis chamber were all evaluated to validate the output data consistency. The sample should also be scalped (850 µm) to ensure that misplaced large particles do not disproportionate the sample analysis.
Development of an accurate sip-file
The sip-file is the term used in Qemscan® terminology to describe the relationship between mineral data and analysed data. This relationship is used to convert the electron detectors' raw output to mineral output. It is therefore important that this relationship is correct to ensure the correct mineral data output and correct interpretation. The sip-file is developed and validated with other analytical techniques such as X-ray diffraction analysis, X-ray fluorescence analysis, inductively coupled plasma (ICP) analysis and iron titration-all these analytical techniques are performed on the same sample. Without a tried and proven sip-file, the outputs from the Qemscan® PMA are subject to error.
Assigned mineral densities
The Qemscan® software requires the user to define the densities of the primary mineral phases as developed in the sip-file. These densities are used to convert analysed particle surface to particle mass. It is therefore important that the correct densities are used, as supported by various sources in literature1,2, to ensure that the mass conversion is done correctly and that the particle density calculation is accurate. However, phases showing extensive solid solution substitution or alteration are also assigned the same density as the pure mineral phase.
De-clustering of particles
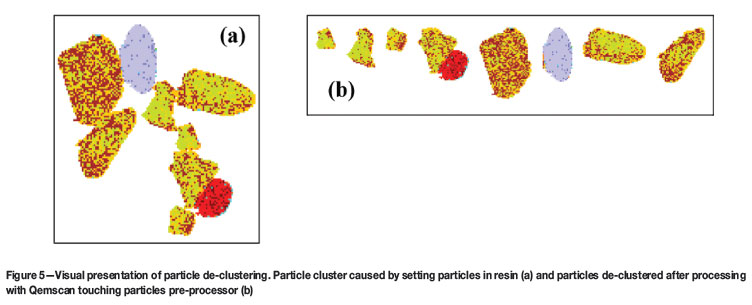
The textural data from Qemscan® PMA needs to be corrected to characterize particle size. The discrepancy arises during the sample preparation process. During the setting of thousands of particles in resin there are many instances of particles that are touching each other. The Qemscan® analyser will not recognize that these particles, are not individual particles and will interpret them as a single large particle with an abnormally large particle diameter and irregular shape with a weighted mineral density of all the particles present in the particle cluster, as shown in Figure 5.
To overcome this problem the particle information should firstly be processed and saved in the particle manager (Qemscan® software), after ripping the clusters as far as possible 'digitally' apart so that the analysis represents single particles as present in the separation vessel and not as clusters which is a result of the sample preparation technique. The de-clustering process can increase the number of analysed particles from 2000 up to 3500 particles, thus increasing the particle population significantly. Excessive declustering will alter the natural size distribution and create small artifacts. The particle shape trends of the population before and after the de-clustering process will assist the operator in selecting the correct settings.
After the correction process, that is de-clustering and raw particle-by-particle data export, the PMA 'picture' output is converted to a mathematical output-a list of approximately 3500 particles, each particle with its unique mass, diameter, density (a function of the minerals present in the particle) and shape factor (a ratio of area to perimeter distance indicating its closeness to a sphere).
Gravity separator performance evaluation using Qemscan® particle mineral analysis
Number of particles to be analysed and particle size restrictions
The accuracy of the analysis is directly correlated with the number of particles being analysed, especially in the presence of large composition variations. It is therefore suggested that a simple magnetic or size fractionation could aid grouping similar particles together to be analysed separately. A large number of particles implies longer analysis acquisition times, and a balance between the number of particles to be analysed and the level of accuracy required must be determined prior to data capturing. During this investigation, more than 2500 particles were analysed. Particles larger than 500 µm could be problematic since only a small number of particles are available on the surface of the polished block to be analysed, which could be insufficient from a representivity point of view. Particles smaller than 1 µm are problematic since the interference with the background becomes too significant. This size range (-500 µm + 1 µm) restricts the application of this particle-by-particle technique to mostly heavy minerals (natural occurring particles), since other sample types (iron ore and coal) need to be milled finer which destroys the natural particle entity.
Generation of artificial ultra-fine particles
It is suspected that during sample block polishing some fragments are physically ripped off from larger particles, but remain behind in the resin of the polished block and are also analysed. Since all the samples were wet screened at 45 µm and subjected to sink-float analysis with TBE it is highly unlikely that there would be particles smaller than 45 µm. These ultra-fine particles would remain behind in the heavy liquid medium that was used to do the sink-float analysis. This artefact will increase the ultra-fine particle population and it should be taken into account when comparing conventional screen data to Qemscan® PMA data.
Qemscan® PMA stereological correction
The Qemscan® PMA produces a two-dimensional image (from reflected light and backscattered electrons) which is converted to a mathematical list of three-dimensional particles that is used for calculations and interpretations. The Qemscan® software does consider the stereological effect in the assignment of a diameter to the particle3 . There are numerous articles discussing the theory behind stereological corrections4,5 and it is not the purpose of this investigation to validate the Qemscan® PMA two-dimensional to threedimensional conversion, nor to demonstrate the statistical basis of the process. The investigation rather aims to demonstrate the available size-density outputs, comparing it to other available techniques, and applying the technique to a density separator to evaluate the potential for improving the understanding of its performance.
Results and discussion
Some analytical requirements for using Qemscan® PMA particle-by-particle data
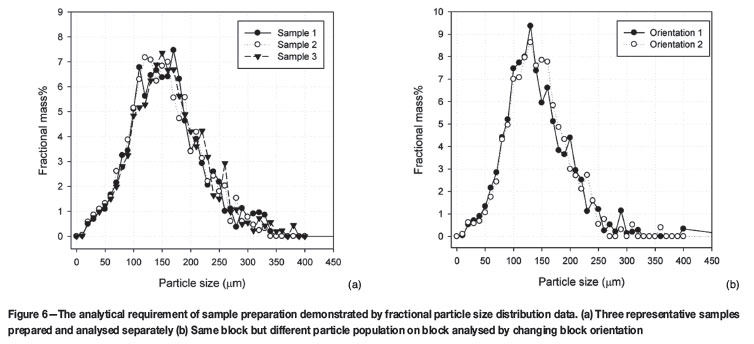
The fractional mass data from the particle sizes were used to evaluate the consistency of the sample preparation process. The sample preparation procedure, which includes the sample splitting with small and micro rotary splitters and block preparation, demonstrated a consistent particle size data output, shown in Figure 6a. The block orientation evaluation, in which different particle populations are analysed on the same polished block, also show a consistent size data output, as shown in Figure 6b.
The minimum number of particles to be analysed was investigated and it was demonstrated that 2500 particles produce particle size data similar to a larger population of 20 000 particles (see Figure 7a). The 1200 particle analysis showed a significant variation compared to the larger populations, indicated in Figure 7b. This demonstrated the sensitivity of the Qemscan® PMA with regards to the particle population size.
Particle size distribution comparison with conventional screening
Conventional dry screening techniques were compared with the Qemscan® PMA particle size distribution. Over 60 samples were analysed using both techniques. The samples were grouped with the aim to develop trends that could be used in future comparisons and calculations. Figure 8 shows three sample types or groups.
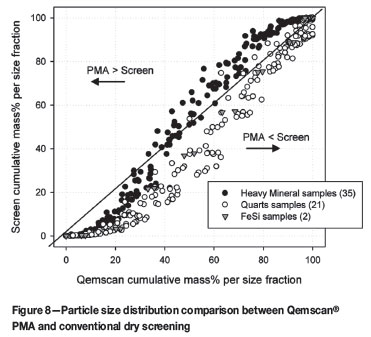
There is a clear distinction between the heavy mineral sample group and the quartz sample group. The Qemscan® PMA tend to be slightly coarser than the screening with regards to the heavy mineral samples analysed, lying more on the upper part of the straight line. The quartz samples tend to be lying more on the lower part, indicating that the Qemscan® PMA will predict a slightly finer particle size distribution. The ferrosilicon sample, which is a manufactured spherical particle population, lies between the other two sample sets.
It is still unclear why there is such a significant difference between the heavy mineral sample population and quartz sample population, and it is suspected to be closely related to particle shape. Figure 9 shows the difference between the Qemscan® shape factor distributions of each of the particle populations. Shape factor in this case is defined by the simple equation (see Equation [1]).
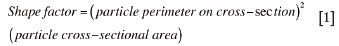
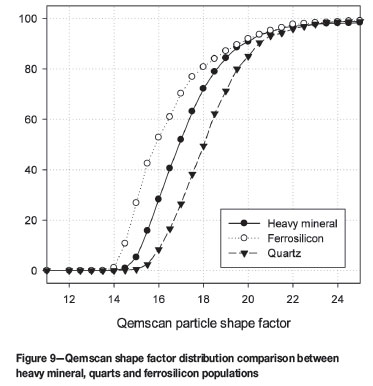
For a perfect sphere the shape factor will be 12.6, while for a needle-shaped particle it is 400, a square particle is around 16 and a triangular particle is around 23. This shape factor measures only single shape parameter and is not sufficient to explain the differences in Figure 8.
The heavy mineral particles were far more rounded and significant portions of the particle population were elongated, while the quartz particles were far more angular with sharp edges. The ferrosilicon sample, which contained 95% spherical particles by mass, showed the closest correlation with conventional screening since particle shape was regular, as shown in Figure 8.
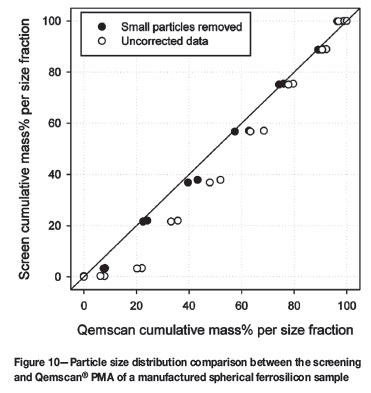
The grouping of the sample points around the lower cumulative mass percentages is most likely due to the artificial increase in fine particles as a result of the polished block preparation process. This effect is visible in all three particle populations. The -45 µm particles were removed from the ferrosilicon Qemscan® data since there was no mass in this fraction for the screen data on the same sample - a re-plot of the ferrosilicon sample is shown in Figure 10. The result shows a close correlation between screening particle size distribution and Qemscan® PMA particle size distribution.
Particle density distribution
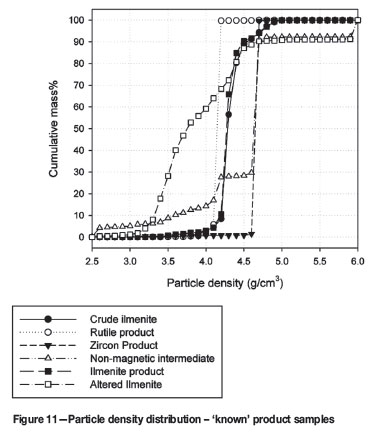
There are no known techniques available to use as a direct comparison with the high resolution particle density distribution (PDD) output from the Qemscan® PMA. The approach followed was to measure final product samples with 'known densities'. A wide range of mineral types was considered in the PDD comparison, i.e. zircon product, rutile product, ilmenite product, and mixed mineral sample (shown in Figure 11).
Gravity separator performance evaluation using Qemscan® particle mineral analysis
The PDD lines clearly demonstrate the characteristic densities of the different mineral samples. The zircon product shows a sharp and narrow PDD around 4.6 g/cm3 as expected. The rutile product also has a sharp distribution at 4.1 g/cm3, but 5% mass was of slightly lower density which indicates leucoxene intergrowths or leucoxene particles (confirmed by mineralogy). The ilmenite product showed a density variation between 4.2 and 4.5 g/cm3 as expected. The non-magnetic fraction contained zircon (60% by mass), rutile (around 15% by mass), lower density trash minerals (10% by mass between density 3 and 4) and with quartz below 3.0 g/cm3 (5% by mass). The altered ilmenite showed a wide PDD, indicating that this mineral will be most likely misplaced in the spiral beneficiation process.
Application to a density separator
Applying the particle size distribution characterization and the particle density distribution characterization to the products of a gravity separation process can lead to a better understanding of the behaviour of the separation device. Figure 12 shows the three-dimensional character of the feed, concentrate, middlings and tails of a spiral concentrator as a function of the combination of size and density data from the Qemscan® PMA.
The feed distribution, Figure 12a, shows a high concentration of quartz and low concentration of heavy minerals. The concentrate produced by the spiral (10% by mass) showed high concentration of heavy minerals, Figure 12b, with a specific size and density distribution. Some fine quartz particles are present in the concentrate. The middling distribution, Figure 12c, which accounted for 5% of the mass, showed coarser heavy mineral particles and finer quartz particles compared to the feed distribution. The tails distribution, Figure 12d, showed a similar quartz distribution compared to feed but no heavy minerals are visible.
Although the size and density outputs from the Qemscan® PMA were not specifically validated in these results, potential for future confirmation of the wider application of this method is indicated. The high resolution size-density data can be effectively used for gravity separator modelling. The time and cost involved in characterizing different feed materials and separator products in terms of size, density, and shape by means of Qemscan® PMA for model development and model validation is a fraction of the cost of physical fractionation of size and density populations.
Conclusions
The representivity of the sample to be analysed is paramount, since only small amounts of sample are analysed. The analytical requirements with regards to the correction of the data are crucial if the Qemscan® PMA results are to be successfully applied to a gravity separation process, and the stereological correction of the data and statistical foundation still need to be better understood. Based upon the above, the Qemscan® PMA has demonstrated the potential to provide a time and cost effective alternative, producing higher resolution results compared to the current size and density fractionation techniques available. Qemscan® PMA analysis of gravity separator products has demonstrated the potential that could lead to improved understanding of the performance of gravity separators.
References
1. http://webmineral.com [ Links ]
2. http://www.mindat.org [ Links ]
3. http://www.intellection.com.au - iQ-0710-04 Grain Size External.doc [ Links ]
4. GAY, S.L. and KEITH, J.M. Geometric probability based stereological corrections, ANZIAM J. 45 (E), 2004. pp. C618-C631. [ Links ]
5. GAY, S.L. and KEITH, J.M. Stereological correction of the surface area of particle. Applied Mineralogy '01. Brisbane, March 26-28, 2001. [ Links ]
© The Southern African Institute of Mining and Metallurgy, 2011. SA ISSN 0038-223X/3.00 + 0.00.
This paper was first presented at the, Heavy Minerals Conference, 'What next?', 20-23 September 2009, Champagne Sport Resort, Drakensberg.

