


Services on Demand
Article
 English (pdf)
 Article in xml format
 Article references
Indicators

Related links
-
 Cited by Google
 -
 Similars in Google
Share

 Permalink
South African Journal of Communication Disorders
On-line version ISSN 2225-4765
Print version ISSN 0379-8046
S. Afr. J. Commun. Disord. vol.62 n.1 Johannesburg 2015
http://dx.doi.org/10.4102/SAJCD.V62I1.95
ORIGINAL RESEARCH
Vocal effectiveness of speech-language pathology students: Before and after voice use during service delivery
Stephanie Couch; Dominique Zieba; Jeannie van der Linde; Anita van der Merwe
Department of Speech-Language Pathology, University of Pretoria, South Africa
ABSTRACT
BACKGROUND: As a professional voice user, it is imperative that a speech-language pathologist's (SLP) vocal effectiveness remain consistent throughout the day. Many factors may contribute to reduced vocal effectiveness, including prolonged voice use, vocally abusive behaviours, poor vocal hygiene and environmental factors
OBJECTIVES: To determine the effect of service delivery on the perceptual and acoustic features of voice
METHOD: A quasi-experimental., pre-test-post-test research design was used. Participants included third- and final-year speech-language pathology students at the University of Pretoria (South Africa). Voice parameters were evaluated in a pre-test measurement, after which the participants provided two consecutive hours of therapy. A post-test measurement was then completed. Data analysis consisted of an instrumental analysis in which the multidimensional voice programme (MDVP) and the voice range profile (VRP) were used to measure vocal parameters and then calculate the dysphonia severity index (DSI). The GRBASI scale was used to conduct a perceptual analysis of voice quality. Data were processed using descriptive statistics to determine change in each measured parameter after service delivery
RESULTS: A change of clinical significance was observed in the acoustic and perceptual parameters of voice
CONCLUSION: Guidelines for SLPs in order to maintain optimal vocal effectiveness were suggested
Introduction
The vocal health and voice management of professional voice users has gained increasing interest in recent years: professional voice users are considered to be at risk of developing voice problems and complaints (Van Lierde et al., 2008). Since the professional voice users rely on their voices as the means to carry out their occupational duties, their voices can be described as a 'primary tool of trade' (Warhurst, Madill, McCabe, Heard & Yiu, 2010; Titze, Lemke & Montequin, 1997). Considering the importance of voice to professional voice users, it is imperative that their voices remain clear and stable throughout the day. Less than optimal vocal effectiveness (pitch, loudness, quality and flexibility) may negatively influence the professional voice user's ability to carry out their daily occupational demands (Hazlett, Duffy & Moorhead, 2009; Roy, Merril, Thibeault, Gray & Smith, 2004). This highlights the need for the prevention, identification and treatment of voice problems before they become significant enough to influence occupational duties negatively.
Professional voice users are amongst the most likely individuals to develop vocal pathologies or voice disorders as a result of improper or excessive voice use (Broaddus-Lawrence et al., 2000). They often demonstrate excessive amounts of voice use in sometimes non-optimal environments as part of their occupational requirements or demands (Colton, 2011). Occasional vocal abuse or misuse may not have a significant impact on vocal parameters, however, the chronic use of vocally abusive behaviours may result in vocal problems such as hoarseness, reduced pitch range, vocal fatigue and the sensation of pressure, tightness or pain in the throat (Ng, Bailey & Lippert, 2005). Given the vocal demands placed on the professional voice user's voice, it is almost expected that vocal problems may manifest. Pathologies on the vocal folds may occur as a result of vocal overuse, chronic voice abuse and misuse (Johns, 2003). Organic manifestations such as nodules, cysts and granuloma may develop after initial wounds have healed which resulted in the remodelling of the superficial layer of the lamina propria. Lesions on the vocal folds, such as nodules, result in mucosal wave disruption during phonation (Johns, 2003). This in turn may result in perturbation of the acoustic wave. In an attempt to overcome the resulting change in voice parameters, the individual may attempt to compensate by making use of excessive effort, abuse and misuse of the voice. Subsequently, a vicious cycle of vocal misuse and abuse may ensue in order to compensate for the loss of vocal effectiveness. Some of the most common consequences of voice problems may include a change in job performance and an absence from work (Yiu, 2002; Roy et al., 2004).
The SLP is a professional voice user with a very specialised set of voice use requirements. The occupational vocal demands that SLPs experience daily are profession-specific (Warhurst et al., 2010). These demands may be a significant causal factor in the development of vocal difficulties. Increasing vocal intensity or loudness whilst maintaining a clear voice quality, as well as maintaining appropriate vocal power, stamina and control are, amongst other conditions, categorised as vocal demands (Timmermans, De Bodt, Wuyts & Van de Heyning, 2004; Warhurst et al., 2010). SLPs may use an increasing number of vocally demanding behaviours to keep the client's attention in therapy; for instance, using auditory highlighting. Voice therapy particularly requires not only the proper use of voice to be demonstrated to clients who are receiving therapy for their voice disorder but also incorrect vocal behaviours. SLPs use their voices in a variety of ways for a range of additional purposes. These purposes may include public speaking, counselling, conferencing, therapy and class presentations in the school context (Gottliebson, Lee, Weinrich & Sanders, 2006). Therefore, as the profession that treats voice disorders and that has a role in advocating vocal health, it is essential that the speech-language pathologist prioritise vocal health and adequate vocal effectiveness.
According to Gottliebson et al. (2006), a lower prevalence of voice disorders occurs in SLP students than in other students; however, a small number of SLP students are still identified as having a voice disorder. For these students, the resolution of their difficulties will be essential to a 'successful professional voice career' (Gottliebson et al., 2006, p. 704). The purpose of this study is to determine whether two hours of voice use during service delivery (e.g. providing therapy to an individual client) has an effect on the voice characteristics of a group of SLP students. It is possible that both the perceptual and the acoustic features of voice will demonstrate a diminished effectiveness as a result of voice use during service delivery.
Method
Research design
A quasi-experimental, pre-test-post-test design was applied.
Participants
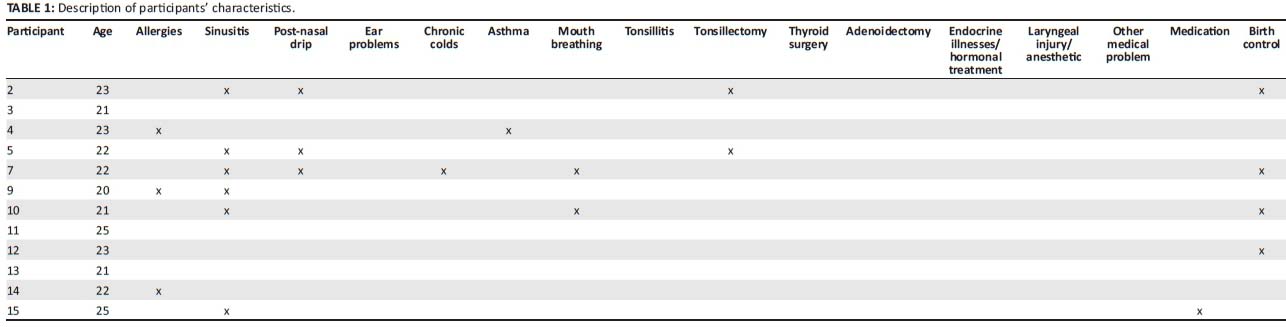
Purposive sampling was used and 12 participants (see Table 1) were selected according to the pre-set selection criteria: participants were required to be female and between the ages of 18 and 30 years. Participants were excluded if they were smokers and had a history of voice disorders or gastro-oesophageal reflux disease. The population included third- and final-year SLP students enrolled at a university in South Africa.
Information letters were provided to each participant and informed consent was given by all the participants in the study. No risks were involved in the study.
Protocol used for data collection
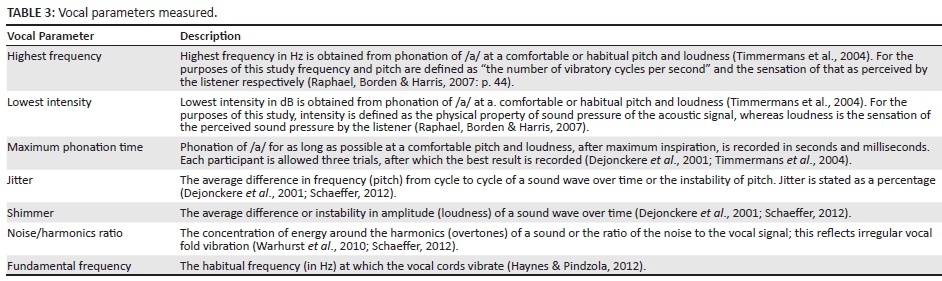
A short case history was obtained and three assessment instruments were used. The data collected in the case history included a search for factors that may have a negative influence on vocal effectiveness. The assessment instruments included the GRBASI 4-point scale (see Table 2) to rate perceptual data (Yamauchi, Imaizumi, Maruyama & Haji, 2010), the Dysphonia Severity Index (DSI) (Wuyts et al., 2000), a quantitative correlate of vocal quality, maximum phonation time and the s/z ratio (Shipley & McAfee, 2009). The Voice Range Profile (VRP) and the Multidimentional Voice Program (MDVP) software packages (KayPENTAX, 2008) were used to measure the vocal parameters necessary to calculating the DSI, including shimmer, jitter, highest frequency, lowest intensity, fundamental frequency and noise to harmonics ratio (see Table 3).

Procedures
Each participant completed a case history. Participants were instructed not to drink caffeinated drinks or alcoholic beverages 12 hours prior to the first assessment to ensure the use of these did not influence their voice quality. Audio recordings of the voices of each participant were made. Participants were instructed to hold the microphone at a fixed distance of 30 cm from the mouth to obtain the most consistent results across the different participants and to obtain optimal quality recordings (Van Lierde et al., 2008; Timmermans et al., 2004).
Voice recordings for acoustic analysis were made in a sound-proof room. The recording facility of the computerised speech lab (or CSL) (KayPENTAX, 2008) was used to make the recordings. Participants were asked to sustain phonation of the /a/, /i/ and /u/ sounds three times each at a comfortable pitch and loudness. The /a/ vowel was used to record the highest and lowest frequency and the highest and lowest intensity using the VRP. The participant was instructed to produce highest and lowest pitch. A stop-watch was used to record the maximum phonation time of the participant using the /a/ sound. The s/z ratio was recorded by using the stop-watch.
Participants completed two hours of speech therapy individually in similar noise-controlled room conditions. The type of therapy provided varied between participants and included adults and children. Noise levels in surrounding rooms and corridors were kept to a minimum to prevent this factor from negatively influencing the results. This helped to control the impact of treating adults and children. High noise levels in the environment may also negatively influence vocal parameters (Lehto et al., 2006).
The post-test was done once the participants had completed the experimental condition (providing two consecutive hours of therapy) and before any amount of voice rest was possible. Voice rest may result in an improved quality of voice (Van der Merwe, 2004). The same procedures were performed as during the pre-test.
Quantitative data analysis
The perceptual data of the participants' voice quality was collected following the GRBASI scale (Table 2). A listener panel consisting of three judges took part in the analysis. To ensure reliable data all of them were experienced listeners (Howard & Lohmander, 2011). The sentence recordings were played back in random order to remove bias. Each member of the panel of listeners gave a rating for each component of the GRBASI scale. Consensus was then reached by majority vote for each component.
The DSI was calculated from the measurements collected by the MDVP, VRP and the maximum phonation time. The DSI is interpreted as follows: scores may range from -5 to +5. A score of +5 indicates a perceptually normal voice whereas a score of -5 indicates a voice that is severely dysphonic. The degree of dysphonia as measured by the DSI represents the optimal combination of independent variables to correspond with the G component of the GRBASI scale (Timmermans et al., 2004; Wuyts et al., 2000). In Table 3 the vocal parameters measured were presented. Changes in the acoustic data were related to the presence or absence of participant characteristics (collected in the case history) that may have been contributors to reduced vocal effectiveness.
Data processing
The perceptual data were processed by comparing the scores obtained for each participant in the pre- and post-tests. For each component within the GRBASI scale, values may range from 0-3 (where 0 = normal, 1 = slight, 2 = moderate, 3 = severe).
The acoustic data were analysed by means of descriptive statistics using STATA 12. Descriptive statistics consisted of calculations of medians and range for each acoustic value (shimmer, jitter, highest frequency, lowest intensity, fundamental frequency and noise to harmonics ratio) collected before and after the experimental condition. The sign test was used to determine whether the median for acoustic values differed from the pre-test to the post-test results (Dixon & Mood, 1946). A p-value was calculated for each parameter to determine whether change that occurred was statistically significant.
Results
Perceptual results
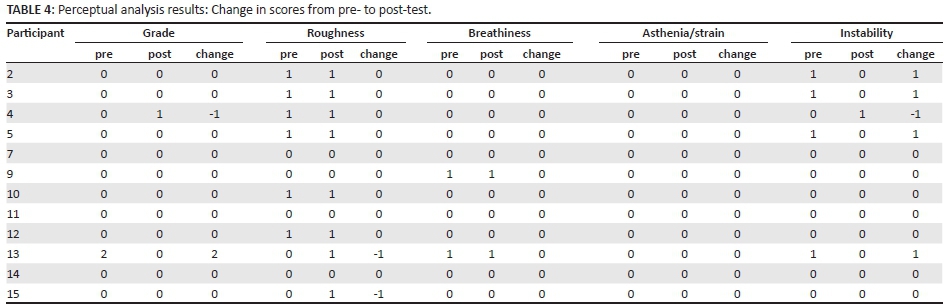
Table 4 depicts the pre-test and post-test scores for each component of the GRBASI scale, as well as the changes noted from pre- to post-test. The perceptual voice quality of 50% of the participants did not change from the pre-test to the post-test. The other 50% of the participants demonstrated a change in perceptual voice quality by no more than one point per parameter.
Of the 12 participants in this study, the GRBASI scores (perceptual data) of six (50%) remained the same from the pre-test to the post-test. Of the six participants (the other 50%) who did demonstrate changes in GRBASI scores, three received an improved rating of one point (from slight to normal) in instability, but roughness remained the same (slight). One participant was rated normal for hoarseness and instability in the pre-test and was scored as slightly hoarse and unstable in the post-test. One participant received an improved rating of hoarseness and instability but scored as slightly rough in the post-test from a normal score of roughness in the pre-test. Participant 12 was also rated as having slight roughness in the post-test from a normal rating of roughness in the pre-test. No change was noted in the parameters asthenia or strain and breathiness. Two candidates who were rated as slightly breathy in the pre-test were scored the same degree of breathiness in the post-test. One of these participants was part of the 50% who did demonstrate change in GRBASI ratings from pre-test to post-test, whereas the other participant was part of the 50% who demonstrated no change.
Acoustic results
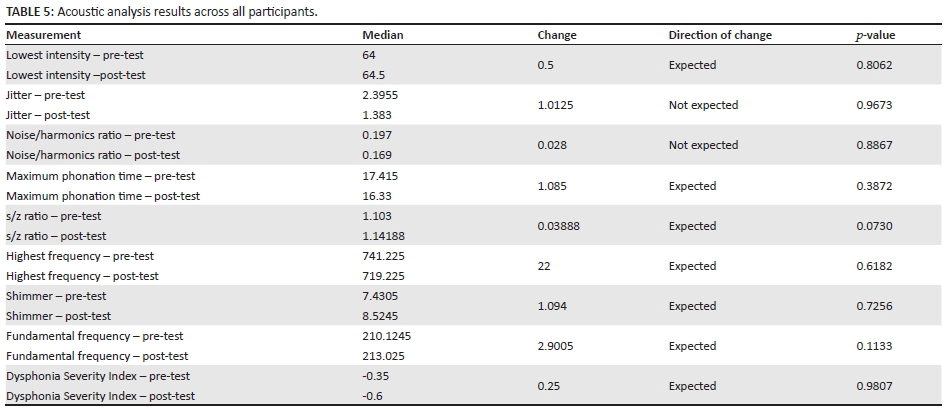
Table 5 depicts the pre-test and post-test median values for each acoustic parameter measured. The change in median values from pre- to post-test for every parameter is presented. The direction of change is indicated, as is whether or not the direction of change was as expected. A p-value is presented, representing whether or not the results are statistically significant.
For all the measured acoustic parameters a p-value indicated that pre-test and post-test parameters did not differ significantly: Lowest intensity, Maximum phonation time, s/z ratio, highest frequency, shimmer, fundamental frequency and the DSI were parameters in which change occurred in the expected direction (the expected direction indicating a decreased effectiveness of voice from pre- to post-test). Noise or harmonics ratio and jitter measurements resulted in a change in the direction that was not expected, indicating results which alluded to improved effectiveness of voice (see Table 2 for a definition of the parameters).
With regard to those parameters that changed in the expected direction (decreased effectiveness of voice), lowest intensity demonstrated an increase (i.e. lowest intensity range was reduced) after the experimental condition. Maximum phonation time demonstrated a decrease after the experimental condition. The s/z ratio indicated poorer vocal effectiveness in the post-test. The highest frequency decreased from the pre- to the post-test as expected. An increase in shimmer and fundamental frequency was observed in the post-test measurements. The DSI results indicated that participants were more dysphonic in the post-test than in the pre-test, indicating a diminished voice quality. For the parameters that changed in the direction not expected, noise or harmonics ratio demonstrated a decrease in the post-test. Since the values of jitter were in the region of 1%-2% and also decreased, this parameter was not responsible for the shift in the DSI. The implications of the values of jitter indicate that the other variables used to calculate the DSI (MPT, lowest intensity, highest frequency) were responsible for the shift to a more negative DSI value.
Discussion
Changes in perceptual and acoustic features of voice
Although not statistically significant, change that was of clinical significance was observed in the acoustic and perceptual parameters of voice in the expected direction.
The change in the s/z ratio and maximum phonation time indicated poorer vocal effectiveness in the post-test in comparison to the pre-test. This reflects a decrease in overall 'phonatory ability' and demonstrates a decreased efficiency in subglottic pressure, airflow resistance and vocal fold closure (Wuyts et al., 2000, p. 803). The decrease in highest frequency noted in the results often indicates an increased vocal fold mass which hampers vocal fold vibration at higher rates. In addition, the increase in the shimmer value demonstrates the inability of the vocal folds to support a periodic vibration for a distinct period and indicates the existence of turbulent noise in the voice signal (KayPENTAX, 2008). Vocal fatigue and vocal pathology are associated with a decrease in fundamental frequency following a period of voice use (Stemple, Stanley & Lee, 1995; Guimarães & Abberton, 2005; Altman, Atkinson & Lazarus, 2005), as seen in the results of the current study.
The two participants who were rated as mildly breathy in the pre-test were scored as mildly breathy in the post-test. Instability values changed in five participants: of all the parameters demonstrating change, it was the parameter that changed in the highest number of participants from the pre-test to the post-test.
Despite the fact that much of the change in the parameters of voice occurred in the expected direction for both perceptual and acoustic results, there were several unexpected changes in the opposite direction. For perceptual results, an improvement in hoarseness for one participant and in instability for four participants was noted. Acoustic results revealed a decrease in jitter for seven participants, and a decrease in noise or harmonics ratio for seven participants. These changes suggest improved effectiveness of voice, which was not as expected. It is important to consider that the improvements noted may have resulted from a 'warm-up' effect. A study conducted by Van Lierde et al. (2011) revealed that vocal warm-ups of only 30 minutes significantly increased DSI values. Voice use during the experimental condition may have acted as a form of warm up for voice use and therefore the functioning of the intrinsic and extrinsic laryngeal muscles may have improved. It is likely, then, that improvements in hoarseness and instability, and decreases in jitter and noise or harmonics ratio may have resulted from this warm-up effect. The improvements noted indicate that vocal warm-up exercises may be a tool that should be used by SLPs in conserving their voices.
It should also be taken into consideration that participants' performance in the post-test may have improved due to their having knowledge of the testing procedures. Participants may have proceeded cautiously in the pre-test but more confidently and comfortably in the post-test.
The results obtained for individual participants were found to coincide with specific participant characteristics that put them at risk for a voice disorder. Poorer vocal effectiveness (as indicated by shimmer, fundamental frequency and highest frequency) was found to be associated with the presence of participant characteristics, including sinusitis, birth control measures, allergies and post-nasal drip.
Participant characteristics and acoustic change
Fundamental frequency, highest frequency and shimmer showed measurements that suggested decreased vocal effectiveness in a number of participants' post-test results. In the case of fundamental frequency, seven of the 12 participants demonstrated scores in the post-test that indicated poorer vocal effectiveness. These participants presented with similar characteristics in that four of the seven suffered from sinusitis and were currently implementing birth control. The characteristics associated with poorer vocal effectiveness can be explained as follows: highest frequency was found to be poorer (reduced pitch range) in four of the 12 participants after voice use and this change coincided with the presence of allergies and sinusitis. A combination of sinusitis and post-nasal drip was found to coincide with poorer scores of shimmer for three participants in the post-test. These associations highlight the importance for SLPs to be aware of factors that may contribute to the development of a voice disorder. The treatment and control of these factors will be central to preventative strategies that these professionals may take to preserve their vocal effectiveness.
Effects of occupational voice use
Overall, the following symptoms were evident in the post-test after all the participants were exposed to the experimental condition: a decrease in vocal effectiveness and efficiency, decreased vocal fold vibration at higher frequencies, impaired ability to maintain periodicity in the amplitude of the voice, vocal fatigue and a diminished voice quality. Although none of the change in any voice parameter was statistically significant, much of it was in the expected direction (decreased vocal effectiveness) and subsequently holds clinical significance. It must be taken into account that over a longer testing period or longer period of voice use, more pronounced results may be obtained. Extended voice use resulting in vocal fatigue or reduced vocal effectiveness may lead to difficulties in controlling voice production and subsequently the voice may deteriorate more quickly or present with more severe dysphonia (Stemple et al., 1995). Periods of voice rest have also been found to improve the parameters of voice and have been found to be a valuable addition to voice therapy (Van der Merwe, 2004). The voice use of a professional voice user is not likely to be confined to a two-hour period in a day and typically spans the length of a working day. Considering the change that occurred in vocal effectiveness after only two hours of voice use, it may be inferred that after a typical day of voice use, vocal effectiveness may be diminished to a much larger degree. A period of voice rest lasting 30-60 minutes, combined with appropriate hydration, may restore vocal effectiveness and assist in preventing the development of vocal pathologies (Van der Merwe, 2004; Van Lierde, Claeys, De Bodt & van Cauwenberge, 2007) The implications of the results of this study suggest that the SLP should consider a period of voice rest and hydration after two hours of service delivery. This strategy, consisting of two-hour sessions of service delivery, is consistent with specific guidelines developed for appropriate vocal hygiene and voice conservation such as those set out by Deem and Miller (2000).
Occupationally related voice dysfunction may have a significant impact on job performance, attendance and future career choices (Roy et al., 2004). Furthermore, economic burdens may be placed on the professional voice user who displays diminished vocal effectiveness, including costs related to sick leave, voice therapy or surgical management (Roy et al., 2004). The implications of reduced effectiveness of voice point to the importance of developing effective prevention and management programmes for SLPs who are either experiencing or at risk of developing reduced effectiveness of voice.
Limitations and recommendations for future research
This was an exploratory study and further research with this and other populations is necessary. The implications of the results obtained in this study underline the need for future research.
Further research into the effects of voice use during service delivery is necessary because of the importance of voice conservation. This research should be expanded to a larger number of participants in order for results to be more representative of the effects that occur in the real-life everyday use of the SLP. The wide variety of measurements of vocal parameters collected in this study provided a multi-faceted picture of the voice before and after voice use. These measurements are not time consuming to collect and are also collected as a set by the software used. As a set, the measurements provide valuable data. Future research can include the use of all the parameters and measurements used in this study. The experimental condition should be extended to the length of a working day for the effects of voice use to be more representative of typical voice use.
Experimental control should be tightened in future studies. More control over food and drink ingested before the experiment should occur as certain foods may have a negative effect on the parameters of voice (Deem & Miller, 2000). Furthermore, future research should introduce a control group that does not allow hydration during the period of voice use. The amount and type of hydration permitted in the experimental group should be specified and closely monitored. The type of therapy provided by the participants should be more controlled and possibly limited to either adults or children with similar disorders.
Conclusion
This study has revealed both the positive and the negative effects of voice use during service delivery. The occupational use of voice in SLP students demonstrated a change (whether positive or negative) in the parameters of voice. Although no statistical significance was established, signs which are of clinical significance were observed. These changes may be indicative of the harmful effects of voice overuse, vocal abuse and vocal misuse that are often occupationally required by the SLP.
The importance of vocal hygiene programmes has been brought to light. A suggested strategy is two-hour sessions of service delivery, followed by a period of voice rest and hydration. Vocal hygiene as part of voice conservation may result in prevention, identification and treatment of voice problems before they become significant enough to influence service delivery negatively.
Acknowledgements
Competing interests
The authors declare that they have no financial or personal relationship(s) that may have inappropriately influenced them in writing this article.
Authors' contributions
D.Z. (University of Pretoria) and S.C. (University of Pretoria) conducted the data collection. J.v.d.L. (University of Pretoria) and A.v.d.M. (University of Pretoria) supervised the research. All the authors contributed to writing the article.
References
Altman, K.W., Atkinson, C. & Lazarus, C. (2005). Current and emerging concepts in muscle tension dysphonia: A 30 month review. Journal of Voice, 19(2), 261-267. http://dx.doi.org/10.1016/j.jvoice.2004.03.007 [ Links ]
Broaddus-Lawrence, P.L., Treole, K., McCabe, R.B., Allen, R.L. & Toppin, L. (2000). The effects of preventative vocal hygiene education on the vocal hygiene habits and perceptual vocal characteristics of training singers. Journal of Voice, 14(1), 58-71. http://dx.doi.org/10.1016/S0892-1997(00)80095-8 [ Links ]
Colton, R.H. (2011). Understanding voice problems: A physiological perspective for diagnosis and treatment. Philadelphia: Wolters Kluwer Health/Lippincott Williams & Wilkins.
Deem, J.F. & Miller, L. (2000). Manual of voice therapy. Austin, TX: Pro-Ed.
Dejonckere, P.H., Bradley, P., Clemente, P., Cornut, G., Crevier-Buchman, L., Friedrich, G. et al. (2001). A basic protocol for functional assessment of voice pathology, especially for investigating the efficacy of (phonosurgical) treatments and evaluating new assessment techniques. European Archives of Oto-Rhino-Laryngology 258, 77-82. http://dx.doi.org/10.1007/s004050000299
Dixon, W.J. & Mood, A.M. (1946). The statistical sign test. Journal of the American Statistical Association, 41(236), 557-566. http://dx.doi.org/10.1080/01621459.1946.10501898 [ Links ]
Gottliebson, R.O., Lee, L., Weinrich, B. & Sanders, J. (2006). Voice problems of future speech-language pathologists. Journal of Voice, 21(6), 699-704. http://dx.doi.org/10.1016/j.jvoice.2006.07.003 [ Links ]
Guimarães, I. & Abberton, E. (2005). Fundamental frequency in speakers of Portuguese for different voice samples. Journal of Voice, 19(4), 592-606. http://dx.doi.org/10.1016/j.jvoice.2004.11.004 [ Links ]
Haynes, W.O. & Pindzola, R.H. (2012). Diagnosis and evaluation in speech pathology (8th edn.). New Jersey: Allyn and Bacon.
Hazlett, D.E., Duffy, O.M. & Moorhead, S.A. (2009). Review of the impact of voice training on the vocal quality of professional voice users: Implications for vocal health and recommendations for further research. Journal of Voice, 25(2), 181-191. http://dx.doi.org/10.1016/j.jvoice.2009.08.005 [ Links ]
Howard, S & Lohmander, A. (2011). Cleft palate speech: Assessment and intervention. Oxford: Wiley-Blackwell. http://dx.doi.org/10.1002/9781118785065
Johns, M.M. (2003). Update on the etiology, diagnosis, and treatment of vocal fold nodules, polyps, and cysts. Current Opinion in Otolaryngology & Head and Neck Surgery, 11, 456-461. http://dx.doi.org/10.1097/00020840-200312000-00009 [ Links ]
KayPENTAX. (2008). Multidimensional Voice Program (MDVP) Model 5105: Software instruction manual issue E. USA: KayPENTAX.
Lehto, L., Laaksonen, L., Vilkman, E. & Alku, P. (2006). Changes in objective acoustic measurements and subjective voice complaints in call center customer-service advisors during one working day. Journal of Voice, 22(2), 164-177. http://dx.doi.org/10.1016/j.jvoice.2006.08.010 [ Links ]
Ng, M.L., Bailey, R.L. & Lippert, L.R. (2005). Comparison of vocal characteristics of future professionals in three different university majors. Contemporary Issues in Communication Science and Disorders, 32, 142-150. [ Links ]
Raphael, L.J., Borden, G.J. & Harris, K.S. (2007). Speech science primer: Physiology, acoustics and perception of speech (5th edn.). Baltimore: Lippincott. Williams and Wilkins.
Roy, N., Merril, R.M., Thibeault, S., Gray, S.D. & Smith, E.M. (2004). Voice disorders in teachers and the general population: Effects on work performance, attendance and future career choices. Journal of Speech, Language and Hearing Research, 47, 542-551. http://dx.doi.org/10.1044/1092-4388(2004/042) [ Links ]
Schaeffer, N. (2012). Assessment of voice disorders. In: C. Stein-Rubin & R. Fabus (pp. 305-346) Clinical assessment and professional report writing in speech-language pathology (1st edn.). USA: Cengage Learning.
Shipley, K.G. & McAfee, J.G. (2009). Assessment in speech-language pathology: A resource manual (4th edn.). USA: Delmar Cengage Learning.
Stemple, J.C., Stanley, J. & Lee, L. (1995). Objective measures of voice production in normal subjects following prolonged voice use. Journal of Voice, 9(2), 127-133. http://dx.doi.org/10.1016/S0892-1997(05)80245-0 [ Links ]
Timmermans, B., De Bodt, M.S., Wuyts, F.L. & Van de Heyning, P.H. (2004). Analysis and evaluation of a voice-training program in future professional voice users. Journal of Voice, 19(2), 202-210. http://dx.doi.org/10.1016/j.jvoice.2004.04.009 [ Links ]
Titze, I.R., Lemke, J. & Montequin, D. (1997). Populations in the U.S. workforce who rely on voice as primary tool of trade: A preliminary report. Journal of Voice, 11(3), 254-259. http://dx.doi.org/10.1016/S0892-1997(97)80002-1 [ Links ]
Van der Merwe, A. (2004). The voice use reduction program. American Journal of Speech-Language Pathology, 13, 208-218. http://dx.doi.org/10.1044/1058-0360(2004/022) [ Links ]
Van Lierde, K.M., Claeys, S., De Bodt, M. & van Cauwenberge, P. (2007). Long-term outcome of hyperfunctional voice disorders based on a multiparameter approach. Journal of Voice, 21(2), 179-188. http://dx.doi.org/10.1016/j.jvoice.2005.11.002 [ Links ]
Van Lierde, K.M., D'haeseleer, E., Wuyts, F.L., De Ley, S., Geldof, R., De Vuyst, J & Sofie, C. (2008). The objective vocal quality, vocal risk factors, vocal complaints, and corporal pain in Dutch female students training to be speech-language pathologists during the 4 years of study. Journal of Voice, 24(5), 592-598. http://dx.doi.org/10.1016/j.jvoice.2008.12.011 [ Links ]
Van Lierde, K.M., D'haeseleer, E., Baudonck, N., Claeys, S., De Bodt, M. & Behlau, M. (2011). The impact of vocal warm-up exercises on the objective vocal quality in female students training to be speech language pathologists. Journal of Voice, 25(3), e115-e121. http://dx.doi.org/10.1016/j.jvoice.2009.11.004 [ Links ]
Warhurst, S., Madill, C., McCabe, P., Heard, R. & Yiu, E. (2010). The vocal clarity of female speech-languge pathology students: An exploratory study. Journal of Voice, 26(1), 63-68. http://dx.doi.org/10.1016/j.jvoice.2010.10.008 [ Links ]
Wuyts, F.L., De Bodt, M.S., Molenberghs, G., Remacle, M., Heylen, L., Millet, B., Van Lierde, K., Raes, J. & Van de Heyning, P.H. (2000). The Dysphonia Severity Index: An objective measure of vocal quality based on a multiparameter approach. Journal of Speech, Language and Hearing Research, 43, 796-80. http://dx.doi.org/10.1044/jslhr.4303.796 [ Links ]
Yamauchi, E.J., Imaizumi, S., Maruyama, H. & Haji, T. (2010). Perceptual evaluation of pathological voice quality: A comparative analysis between the RASATI and GRBASI scales. Logopedics Phoniatrics Vocology, 35, 121-128. http://dx.doi.org/10.3109/14015430903334269 [ Links ]
Yiu, E.M.L. (2002). Impact and prevention of voice problems in the teaching profession: Embracing the consumer's view. Journal of Voice, 16(2), 215-228. http://dx.doi.org/10.1016/S0892-1997(02)00091-7 [ Links ]
 Correspondence:
Jeannie van der Linde
Department of Speech-Language Pathology and Audiology
University of Pretoria, Pretoria 0002, South Africa
Email: jeannie.vanderlinde@up.ac.za
Received: 02 June 2014
Accepted: 24 Aug. 2014
Published: 26 Mar. 2015

