


Services on Demand
Article
 English (pdf)
 Article in xml format
 Article references
Indicators

Related links
-
 Cited by Google
 -
 Similars in Google
Share

 Permalink
African Journal of Laboratory Medicine
On-line version ISSN 2225-2010
Print version ISSN 2225-2002
Afr. J. Lab. Med. vol.9 n.1 Addis Ababa 2020
http://dx.doi.org/10.4102/ajlm.v9i1.1244
OPINION PAPER
Scaling up testing for COVID-19 in Africa: Responding to the pandemic in ways that strengthen health systems
Farouk A. Umaru
Department of Global Public Health, United States Pharmacopeia, Rockville, Maryland, United States
^rND^1A01^nThumeka P.^sJalavu^rND^1A01^nMegan^sRensburg^rND^1A01^nRajiv^sErasmus^rND^1A01^nThumeka P.^sJalavu^rND^1A01^nMegan^sRensburg^rND^1A01^nRajiv^sErasmus^rND^1A01^nThumeka P^sJalavu^rND^1A01^nMegan^sRensburg^rND^1A01^nRajiv^sErasmus
ORIGINAL RESEARCH
Clinical staff knowledge and awareness of point-of-care-testing best practices at Tygerberg Hospital, South Africa
Thumeka P. Jalavu; Megan Rensburg; Rajiv Erasmus
National Health Laboratory Service, Department of Chemical Pathology, Faculty Health Sciences, Stellenbosch University, Stellenbosch, South Africa
ABSTRACT
BACKGROUND: Point-of-care testing (POCT) is defined as testing done near or at the site of patient care with the goal of providing rapid information and improving patient outcomes. Point-of-care testing has many advantages and some limitations which affect its use and implementation.
OBJECTIVE: The aim of the audit was to determine the current practices, staff attitudes and training provided to hospital clinical staff.
METHODS: The audit was conducted with the use of a questionnaire containing 30 questions. One hundred and sixty questionnaires were delivered to 55 sites at Tygerberg Academic Hospital in Cape Town, South Africa, from 21 June 2016 to 15 July 2016. A total of 68 questionnaires were completed and returned (42.5% response rate).
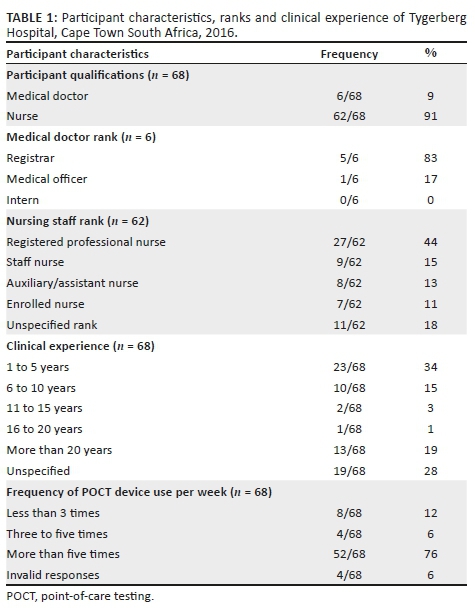
RESULTS: Most participants were nursing staff (62/68, 91%), and the rest were medical doctors (6/68, 9%). Most participants (66/68, 97%) performed glucose testing, 16/68 (24%) performed blood gas testing and 17/68 (25%) performed urine dipstick testing. Many participants (35/68, 51%) reported having had some formal training in one or more of the tests and 25/68 (37%) reported having never had any formal training in the respective tests. Many participants (46/68, 68%) reported that they never had formal assessment of competency in performing the respective tests.
CONCLUSION: Participants indicated a lack of adequate training in POCT and, thus, limited knowledge of quality control measures. This audit gives an indication of the current state of the POCT programme at a tertiary hospital and highlights areas where intervention is needed to improve patient care and management.
Keywords: POCT; near-patient testing; ISO 22870; pathology; chemical pathology.
Introduction
Point-of-care testing (POCT) is defined as testing done at or near the site of patient care, with the aim of providing rapid information and improving patient outcomes.1 The goal of POCT is to provide timely information regarding the patient's condition, and to adjust management and improve the quality of care whilst avoiding medical errors.2
The ideal POCT programme must meet several requirements; these include organisation, supervision, written procedures, operator training and competency testing, instrument evaluation, proficiency testing, quality control, and appropriate result recording and notification.1 The main guidelines used to design and implement POCT programmes are the International Organization for Standardization (ISO) 22870:2016 and Clinical Laboratory Standards Institute guidelines such as POCT4,3,4 which provide comprehensive guidance on POCT practice. The Royal College of Pathologists of Australia has a framework for POCT in the laboratory and at POCT sites that can be adapted for use at independent sites offering POCT.5 These are some of the goals for a POCT programme applicable to the hospital environment.
Part of quality management may include internal quality control and external quality assurance (EQA), depending on the type of POCT device in use. Nursing staff form an essential part of the clinical team and routinely perform POCT; therefore, a regular provision of training should be provided to ensure adequate knowledge and compliance with the above requirements.5 Documentation, information management and record keeping are also an important part of the POCT process. Ideally, the systems should be linked to the laboratory information systems; if this is not available, the POCT team should develop programmes to ensure that this is done.6,7 This process includes documentation of non-conformances, and protocols on how to identify, investigate and take appropriate corrective and preventative measures. Indirect costs associated with POCT may also include training of personnel, quality control, maintenance, external quality control/proficiency testing, etc.8,9 Incidents of nosocomial infections related to sharing of devices between patients, as well as viral infections related to contaminated lancet holders, have been reported.10 These are some of the reasons why it is recommended to have a POCT committee which ensures proper training and compliance with both local and international guidelines for the implementation and management of a POCT programme.
South Africa currently has no formal national policy on POCT and training of personnel for healthcare facilities. Different hospitals implement their own programmes and it is not clear if the same protocols are followed everywhere. Point-of-care testing is widely available for use in the general and some emergency hospital units. National guidelines are necessary to inform the planning of POCT programmes, training and assessment of practitioners, or guidance on issues around quality management. Hospital and facility managers are often the main stakeholders involved in POCT programmes, without involvement of any laboratory representatives. It is against this background that different hospitals operate their POCT programmes, without national guidelines; this is also applicable to Tygerberg Academic Hospital (hereafter, Tygerberg Hospital).
Healthcare workers who use POCT at Tygerberg Hospital in Cape Town, South Africa, include approximately 550 medical staff (interns, officers, specialists, registrars, etc.) and nursing staff (approximately 2100 professional nurses, staff nurses, and nursing assistants). A variety of point-of-care tests are in use. For example, medical wards, such as the internal medicine and endocrine wards, use glucose meters and urine dipsticks on a regular basis, as do the diabetes and renal clinics. The intensive care and high care units use these POC tests as well as arterial blood gas analysers, which are benchtop POCT devices that require more skill to operate than the other two tests and are often performed by medical staff, professional nurses or technicians, when available.
This study audited current practices and training provided to hospital personnel who regularly use POCT at Tygerberg Hospital, to determine whether collaboration is necessary between the laboratory and the hospital management team responsible for the current POCT instruments used. The audit aimed to determine the current training provided to clinical staff about the use of POCT devices, investigate staff practices and attitudes towards POCT, and to ascertain the general level of training and knowledge of quality control in the practice of POCT. The information gathered will help to give feedback to the stakeholders on areas that can be improved in the current POCT programme. Such areas include staff training, competency assessment, and regular refresher courses on both the theory and the practical aspects of POCT. The stakeholders include hospital administration, nursing staff, doctors, clinical technologists, laboratory technologists and pathologists of the relevant disciplines. The audit was not requested by the hospital; it was laboratory initiated.
Methods
Ethical consideration
Ethics approval was obtained from the University of Stellenbosch health research ethics committee (Reference: S15/11/269). Written permission was also obtained from the hospital management to conduct the audit in the hospital medical wards and outpatient clinics. Participants were given information leaflets and signed informed consent forms after agreeing to participate in the study.
Study design
This study is a descriptive, cross-sectional audit conducted with the use of a questionnaire containing 30 questions (Supplementary Document 1). A questionnaire was chosen as the most ideal and feasible format for conducting this qualitative audit. The questions were designed to cover the important aspects, based on the ISO 22870 guideline.
Questionnaire
The questionnaire was developed by the primary investigator, with the input and supervision of the co-investigators, based on a thorough literature review. This initial draft was further adapted to include the relevant sections from ISO 22870 in order to incorporate quality management aspects. Questions included general knowledge about POCT at the different sites, theoretical knowledge around POCT, formal training and competency assessment of POCT operators, quality control measures and current perceptions of operators on their respective tests. Formal training was defined as a lecture-type session lasting approximately 1 hour, including a practical demonstration and practice in the use of the specific POCT device. Questions were grouped in sections, with a few confirmatory questions which did not follow a specific order. Routine performance of tests was assessed by asking about the frequency of tests performed per week; that is, participants were asked to indicate the average number of times they performed each test applicable to them (more than one test could be selected from a table). The questionnaire was validated at two locations and with colleagues within the department to ensure the questions were understandable prior to distribution of questionnaires.
Setting and tests included
This study was conducted at Tygerberg Academic Hospital, a tertiary hospital with an inpatient capacity of 1384 beds situated in the northern suburbs of Cape Town, Western Cape, South Africa. The hospital serves a community of approximately 3.6 million from the public health system. Three point-of-care tests - blood glucose, blood gases and urinalysis - were chosen for the audit, because they are performed routinely throughout the hospital and fall under the expertise of the study team. All POCT devices used in the hospital are from Roche ACCU-CHEK® (Roche Diabetes Care GmBH, Mannheim, Germany). Other non-chemistry point-of-care tests, such as those for HIV haemoglobin, were not included in the audit as they fall outside the scope of the investigators' expertise.
Data collection and analysis
An average of three questionnaires was delivered to 55 sites in the hospital, comprising wards, emergency units and outpatient clinics, between 21 June 2016 and 15 July 2016. A few sites only accepted one or two questionnaires, because the nursing managers could not identify anyone else who was suitable to participate, so the total number of questionnaires delivered was 160. Site inclusion criteria included any hospital site that routinely uses POCT as part of patient management. This included all general medical and surgical wards, emergency units, intensive care units and high care units.
The psychiatric and orthopaedic wards and clinics were excluded, because of the low likelihood for use of POCT at these sites.
Ward managers were approached to help with selection of suitable nursing staff to complete the questionnaires. We expected professional nurses, staff nurses and nursing assistants to form the majority of participants from the nursing side. We also expected interns, medical officers and registrars to form the majority of participants from the medical staff. This expectation was based both on their respective clinical duties and on their close involvement in daily patient care as medical doctors without the competing managerial duties applicable to senior and higher rank medical consultants and specialist doctors. Students were excluded from the study because they were not employed by the hospital and were at different levels of study.
Participants were given an option to complete the questionnaire at the time of delivery or to complete it in their own time when not busy with core duties. All participants were encouraged to complete the questionnaire as comprehensively as possible and all those who delayed in completing the questionnaire were given a second or third chance to do so.
Information from the questionnaires was captured on Microsoft Excel 2016 version 16.0 (Microsoft, Redmond, Washington, United States), which was used to calculate basic descriptive statistics for the data. In the analyses, each ward or clinic included in the study counted as a single site. Missing data included questionnaires that were returned uncompleted and those which were completed only in part. The latter group was included in the data analysis as most of them had completed over 80% of the questions. Missing data were also taken into account when specific questions were reported. Responses are reported as percentages of the final sample size. Each question analysed includes an indication of the percentages of those who did not answer the specific question (Tables 1 and 2). No further adjustments were made to compensate for missing data.
Results
Study participants and tests administered
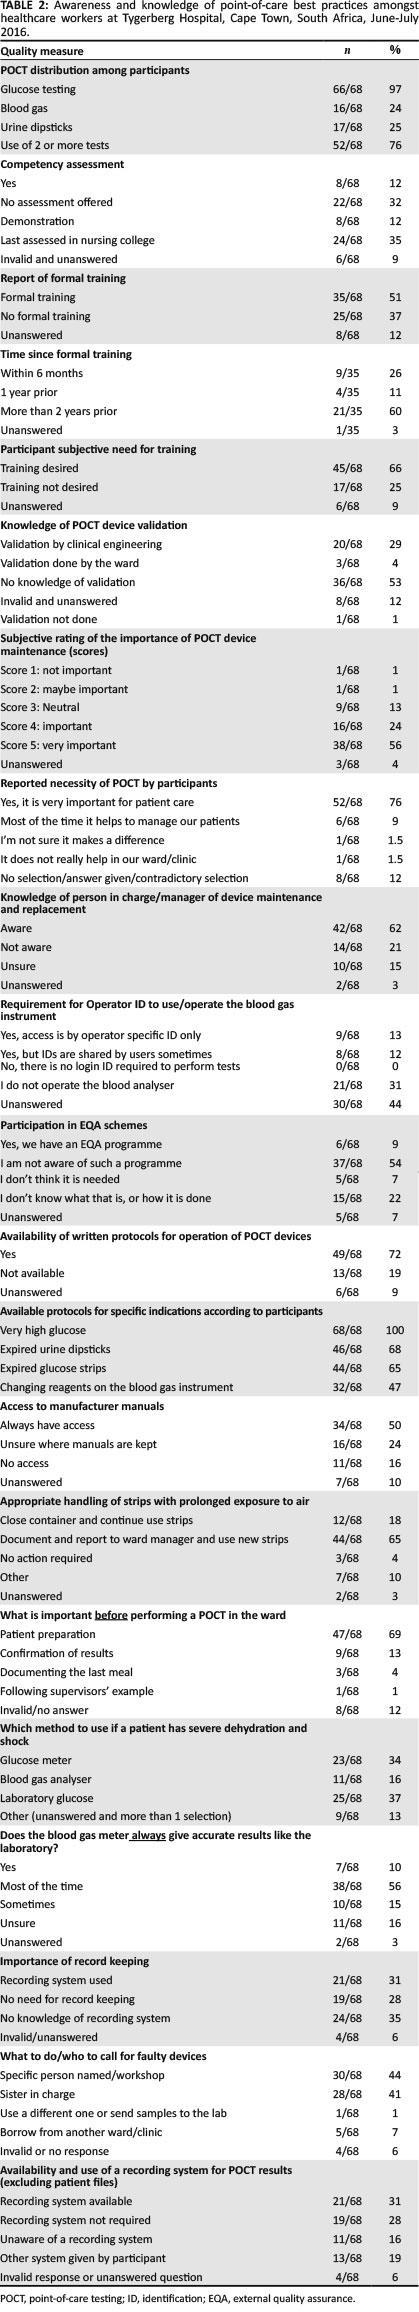
Out of the 160 questionnaires delivered, 68 were returned completed (42.5% response rate) (Table 1). Most participants (66/68, 97%) performed glucose monitoring, 16/68 (24%) performed blood gas testing, and 17/68 (25%) performed urine dipstick testing (Table 2). A total of 52/68 (76%) performed one or more of the tests more than five times per week, mainly glucose, followed by urine dipsticks and blood gas analysis (Table 1).
Knowledge and awareness of point-of-care-testing best practices
Although a majority (35/68, 51%) indicated that they had formal training, many indicated that they had not (25/68, 38%) (Table 2). Those participants who indicated that they had knowledge of device validation, reported that this was performed by either the clinical engineering department or the ward. Most respondents (57/68, 78%) indicated that POCT is necessary in their respective wards or clinics. Most of the staff (42/68, 62%) indicated that they knew who was managing POCT in their respective locations.
The present study found that 31% (n = 21) of participants indicated they used a recording system in addition to patient files, 28% (n = 19) indicated they did not require use of a recording system, and 16% (n = 11) were unaware of a recording system in their ward or clinic. Nineteen percent (n = 13) of participants indicated using other means of record control, mostly involving duplicating of result entries in the nursing notes as well as the designated charts on patient files; one participant indicated that doctors enter POCT results on their computer for future reference. Six percent (n = 4) of participants selected more than one of the four answer options, thus providing conflicting responses.
When asked about the important step(s) before performing a point-of-care test, 47/68 (69%) correctly indicated that patient preparation was vital, whilst 9/68 (13%) indicated that confirmation of results was an important first step. A large proportion (25/68, 37%) indicated that the laboratory method was more accurate for glucose measurement in a patient with dehydration or shock, whilst 23/68 (34%) felt the glucose meter was as accurate as the laboratory; a further 11/68 (16%) indicated that the blood gas measurement is the most reliable if a patient is dehydrated. Record keeping of test results was another parameter used as a marker of quality management in POCT; 21/68 (31%) of participants said they used a recording system, 19/68 (28%) felt there was no need for it, and 24/68 (35%) either did not know if there was a recording system or selected other forms of a recording system. More than half of the participants (38/68, 56%) viewed POCT as being an important part of patient management (Table 2).
Discussion
Most respondents to this audit of the use of POCT by clinical staff at a South African tertiary hospital found that POCT was a vital part of patient care; this is important, as it is likely to ensure that the staff is open to learning and keeping up to date with new information and practices. The second main observation was that there is a lack of formal training of hospital staff in the practice of POCT, and most of the participants indicated that they needed formal training in POCT. This is an important issue which requires consideration by stakeholders as it may impact patient outcomes and improve staff confidence in performing the tests.11 Staff confidence requires formal skills training and competency testing in order to minimise the risk of errors.12 Errors can be attributed to several underlying reasons, including poor technique, abnormal haematocrit, failure to adhere to the correct procedure, and presence of interfering substances. For example, the POCT devices used in the hospital are Roche ACCU-CHEK® devices, which are known to be prone to galactose, ascorbic acid and ceftriaxone interference, and which may deliver false high or -low glucose results in the presence of interference.13 The package insert also states that the use of the glucose meter is not advised in patients with peripheral vascular disease or with dehydration from several causes. Without theoretical knowledge relevant to the test performed, the clinical personnel are at a disadvantage and are not fully equipped to perform these tests. All persons involved in POCT should be aware of potential interferences, why patient preparation is important, and the concepts of accuracy and precision. Such knowledge requires training by experts in the field, such as laboratory professionals who would provide valuable input in the training of clinical personnel.
The participants showed a limited awareness of quality control procedures, such as POCT device validation and EQA. This was indicated by the high number of participants (54%, n = 37) who were not aware of any EQA involvement in their ward or clinic and the 53% (n = 36) who did not know if any device validation or verification was performed prior to the use of new POCT devices in their wards or clinics. This is related to the lack of training in POCT basics and principles. The purpose of POCT device validation, internal quality control and EQA is to ensure that the results obtained are of a good quality and give confidence to the clinician who will initiate or change the treatment of the patient based on the result obtained from a POCT device. Laboratories are required to participate in internal quality control and EQA activities in order to be accredited to international standards. Point-of-care testing programmes also benefit from such quality control measures, as this would allow them to compare with other POCT sites and allow early identification of non-conformances. International guidelines, such as ISO 22870:2016 and (CLIA) POCT04, recommend operator training in both the theory and the practice of internal quality control of POCT devices.3
Some countries, such as Australia and New Zealand, have local guidelines on the use and implementation of POCT based on both national and international recommendations.6,14 When testing for glucose, theoretical knowledge is required in order for the tester to be aware of factors such as haematocrit levels, systemic shock oxygenation status and exposure of strips to humidity, which can reduce the shelf-life of the strips.15,16 A low haematocrit level (< 30% - 35%) may lead to overestimation of glucose, whilst a haematocrit above 45% may lead to underestimation of glucose results by some POCT devices. Some of the above factors have predictable effects, such as overestimation or underestimation of tests such as glucose, or to the delivery of false-positive dipstick results because of exposure of the strips to humidity. Exposure of glucose meter reagent strips to humidity does not have a predictable effect of over- or underestimation of glucose results, unlike the aforementioned examples. Some POCT devices for glucose have been shown to have poor accuracy at critical glucose levels (critically high: > 33.3 mmol/L; critically low: < 2.2 mmol/L) and to have significant bias compared to other devices and the central laboratory method.17 It is therefore important for POCT operators to know when to question a POCT device result and to confirm with the central laboratory method. Some studies have also shown that POCT in high-risk patient groups, such as those patients in either adult or paediatric intensive care units, can lead to misdiagnosis.16,18 This requires staff to be very knowledgeable about potential sources of error, dealing with critical values and the use of protocols to guide POC test use in these settings.
Point-of-care testing has become an integral part of healthcare in both the primary care and the hospital setting.1 With the increasing use of POCT, there is also an increasing need to adopt and practise global principles to avoid medical errors and ensure patient safety.2 Potential disadvantages of POCT include insufficient validation of trained and certified operators, insufficient supervision, limited understanding of quality control testing, little or no security of patient test results and quality control data and limited connectivity of POCT devices.2,12 This audit sought to evaluate the current state of POCT practice at Tygerberg Hospital by focusing on the most widely-available and commonly-used tests in the hospital. In agreement with international practices in the hospital setting,5,12 nurses form the bulk of the POCT operators in this study. However, Nnakenyi et al. showed different findings in their audit of 5 hospitals in Nigeria. Their study had 40% physicians, 32% nurses and 27% technologists, with a total of 98 participants across all five hospitals.19 The study above is comparable to the present study in terms of sample size and recorded a good response rate from doctors. Our study was targeted at clinical staff, namely, nurses and doctors only. Great effort was made to recruit doctors in this study; the poor response rate from the doctors in this study may indicate the low level of interest of doctors in POCT. This finding supports the recommendation by some to keep POCT programmes under the control of the laboratory. This would mean that the Head of Chemical Pathology or the principal chemical pathologist becomes the chair of the POCT committee in the hospital, and she or he would be directly involved in the decision making and running of the programme as recommended by international guidelines.
In many hospitals in sub-Saharan Africa, POCT is performed by clinical staff because of the limited availability of medical technologists, who are primarily employed in core laboratories with limited numbers, if any, involved in hospital POCT. Clinical staff are therefore at the forefront of hospital POCT in sub-Saharan Africa and a good source of information about the practices, successes, and limitations of hospital POCT in this setting.
A study conducted in Nigeria included only doctors, which provided a different perspective but limits a direct comparison between the different African studies.20 This study used an interviewer-administered questionnaire on doctors at two different hospitals in Nigeria. The sample selection method was not explained clearly; the response from the two hospitals seems to have been 22% for one and 32% for the other. There is no specific mention of how the selection process was conducted and the rationale behind the exclusion of nursing staff in their study. Our study, by contrast, mainly included nursing staff who are the main operators of POCT in the hospital setting. The questionnaire was designed to obtain information, to identify current gaps in the system and to find solutions that may be easy to implement. Some questions were asked to elicit information about record keeping and maintaining a clear paper trail. This has been shown to be a limitation of many POCT programmes where devices do not have connectivity to the laboratory system and rely only on the manual transcription of results.21
There were varied responses to these questions in this study, and this may point to the lack of a formalised system for recording POCT results separate from the entries in patient files.
Focus group discussions have been conducted amongst personnel to determine their perception and operational impact of POCT on clinical duties in parts of rural Australia and Uganda (23,24).22,23 Most participants of these focus groups indicated that they valued POCT, but were dissatisfied with the implementation and their exclusion from the planning process. In our setting, the use of focus groups was not feasible, because of staff shortages and the limited time available to engage with the nursing staff whilst they concentrated on their clinical duties. The present study found that the majority of participants (76%, n = 52) also valued POCT and regarded it as being an important component of patient care in their environment. Many (66%, n = 45) indicated that they would want formal training in POCT, 25% (n = 17) indicated no desire to have training in POCT, and 9% (n = 6) did not answer the question. The questionnaire did not specifically include questions about views on implementation or involvement of participants in the planning of the POCT programme in the hospital. The focus was primarily on the practice of POCT, knowledge of POCT theory, and perceptions of participants regarding POCT in the wards and clinics where POCT programmes are already implemented.
The findings of the study are mainly applicable to Tygerberg Hospital and to other tertiary hospitals that do not currently have a POCT training programme, and where the central laboratory is not involved in POCT. These findings may not apply to other hospitals in South Africa who have a different POCT management system. The training of nurses should be explored in other institutions in South Africa to give a comprehensive picture of the POCT programmes in local hospitals. This should be followed by the development of training programmes and regular re-training to ensure that clinical personnel keep their knowledge and skills up to date. At the time this audit was conducted, there were no national guidelines or policies guiding the practice of POCT in South African hospitals. There is limited published information on current practices in POCT in South Africa and within the rest of the African continent. Many of the studies available in Africa have looked at implementation of specific POCT instruments and clinical outcomes. These studies do not primarily look at the availability of local guidelines and training of personnel on POCT and therefore cannot be compared directly with the current study. Compared with other POCT programmes, such as HIV-POCT, general POC biochemistry tests have been around for much longer. A collaborative study of Zambia and South Africa on HIV-POCT found that intensive training, supervision and robust quality assurance mechanisms were required to optimise community HIV-POCT.24 A similar approach can be applied to other POCT programmes to improve their quality.
This audit is the first of its nature to be conducted and reported in South Africa. It will provide a basis for the laboratory and hospital to determine the need for collaborative training of clinical staff.
Limitations
The limitations of the study include the small number of questionnaires sent, which was estimated based on the knowledge that not all staff in the ward perform POCT and that those who do are usually busy with clinical duties and we did not want to distract them from service delivery. The response rate was quite low overall; in some sites, available staff members were busy when questionnaires were distributed and even upon follow-up, they still did not have time to complete them.
This applied to both nursing staff and the mid-level/junior medical staff.
The questionnaire did not focus on the views of participants regarding planning and implementation of POCT programmes in the hospital, this information would have been valuable and used to gauge the general attitude of participants in being directly involved in the planning and implementation of POCT in the hospital. Some questions may not have been clear or explicit enough for participants to provide accurate feedback; even though the questionnaire was piloted with nursing staff and medical doctors, some participants may still have found some questions unclear.
Recommendations
We recommend the introduction of training and certification programmes for point-of-care test operators in keeping with international guidelines. We also recommend that a POCT coordinator be appointed to lead the current programmes with the assistance of a dedicated POCT team in the hospital, as well as the involvement of the clinical laboratory for the continuous evaluation and improvement of the current programme.
Conclusion
This audit found that a significant percentage of the participants did not receive adequate training in POCT and had very limited knowledge of quality control measures. This audit gives an indication of the current state of the POCT programme in the hospital and highlights areas where intervention is most needed to improve patient care. Current guidelines recommend that hospital personnel have basic knowledge and skills to perform routine POCT. Appropriate implementation of a POCT service requires focus on all aspects, including staff training and quality assurance. This information is also important to inform the Department of Health of the need to consider implementing guidelines and policies on POCT in all health facilities in South Africa.
Acknowledgements
We would like to thank all of the nurses and doctors who agreed to take part in the study and all colleagues who gave advice and guidance during the development of the study protocol. We also thank the Tygerberg Academic Hospital management for allowing us to conduct the audit in the hospital.
Competing interests
The authors declare that they have no financial or personal relationship(s) that may have inappropriately influenced the writing of this article.
Authors' contributions
All three listed authors were responsible for the study design and protocol development until submission to ethics. T.P.J. collected the data, through distribution and collection of questionnaires, and entry of data onto the Microsoft Excel spreadsheet for data analysis, and drafted the first manuscript. R.E. and M.R. further contributed by critical revision of the manuscript in preparation for submission. All listed authors approved of the final version of the manuscript for publication.
Source of support
None.
Data availability statement
Data sharing is not applicable to this article as no new data were created or analysed in this study.
Disclaimer
The views and opinions expressed in this article are those of the authors and do not necessarily reflect the official policy or position of any affiliated agency of the authors.
References
1.Dyhdalo KS, Howanitz PJ, Wilkinson DS, Souers RJ, Jones BA. Documentation of quality control and operator training at point-of-care testing. Arch Pathol Lab Med. 2014;138(11):1444-1448. https://doi.org/10.5858/arpa.2013-0552-CP [ Links ]
2.Kost GJ. Preventing medical errors in point-of-care testing. Arch Pathol Lab Med. 2001;125(10):1307-1315. [ Links ]
3.International Organization for Standardization. ISO 22870:2016 point-of care-testing (POCT) - Requirements for quality and competence. Geneva, Swizerland: International Organization for Standardization; 2016. [ Links ]
4.Clinical Laboratorory Standards Institute. POCT04; Essential tools for implementation and management of a point-of-care testing program. 3rd ed. Wayne, PA: Clinical Laboratory Standards Institute; 2016. [ Links ]
5.Robertson-Malt S. Nursing role in point-of-care testing. Point Care. 2008;7(4):246-247. https://doi.org/10.1097/POC.0b013e3181885d37 [ Links ]
6.The Royal College of Pathologists of Australia. Point of care testing: Elements of a quality framework [homepage on the Internet]. The Royal College of Pathologists of Australia; 2014 [cited 2015 Aug 10]. Available from: https://www.rcpa.edu.au [ Links ]
7.Lewandrowski K, Gregory K, Macmillan M. Assuring quality in point-of-care testing: Evolution of technologies, informatics, and program management. Arch Pathol Lab Med. 2011;135(11):1405. https://doi.org/10.5858/arpa.2011-0157-RA [ Links ]
8.Marshall WJ, Lapsley M, Day A, Ayling R. Hypoglycaemia. In: Marshall WJ, Lapsley M, Day A, Ayling R, editors. Clinical biochemistry: Metabolic and clinical aspects. 3rd ed. London, UK: Churchill Livingstone, Elsevier Ltd, 2014; p. 333-348. [ Links ]
9.Junker R, Schlebusch H, Luppa PB. Point-of-care testing in hospitals and primary care. Deutsches Ärzteblatt Int. 2010;107(33):561. https://doi.org/10.3238/arztebl.2010.0561 [ Links ]
10.Nicols JH. Point-of-care-testing. In: Kaplan LA, Pesce AJ, editors. Clinical chemistry: Theory, analysis, correlation. 5th ed. Maryland Heights, MO: Elsevier Mosby, 2010; p. 379-392. [ Links ]
11.Delany C. The point-of-care coordinator training program - Standardizing point-of-care coordinator training globally. Point Care. 2012;11(3):165-171. https://doi.org/10.1097/POC.0b013e3182666e98 [ Links ]
12.Lehto L, Bloigu A, Liikanen E, Ruokonen A. Interactive 2-step training strategy for nurses: The long-term quality of glucose point-of-care testing in hospital and primary health care unit. Point Care. 2015;14(1):32-36. https://doi.org/10.1097/POC.0000000000000044 [ Links ]
13.Roche. ACCU-CHEK active blood glucose monitoring system package insert. Roche Diabetes Care GmBH, Mannheim, Germany; 2015. [ Links ]
14.Shephard M, Shephard A, McAteer B, Regnier T, Barancek K. Results from 15 years of quality surveillance for a National Indigenous Point-of-Care Testing Program for diabetes. Clin Biochem. 2017 Dec;50(18):1159-1163. https://doi.org/10.1016/j.clinbiochem.2017.07.007 [ Links ]
15.Ginsberg BH. Factors affecting blood glucose monitoring: Sources of errors in measurement. J Diab Sci Technol. 2009;3(4):903-913. https://doi.org/10.1177/193229680900300438 [ Links ]
16.Schifman RB, Nguyen TT. Reliability of point-of-care capillary blood glucose measurements in the critical value range. Arch Pathol Lab Med. 2014;138(7):962. https://doi.org/10.5858/arpa.2013-0455-OA [ Links ]
17.Rensburg MA, Hudson C, Erasmus RT. Evaluation and performance of StatStrip glucose meter. Point Care. 2014;13(4):137-141. https://doi.org/10.1097/POC.0000000000000037 [ Links ]
18.Cook A, Laughlin D, Moore M, et al. Differences in glucose values obtained from point-of-care glucose meters and laboratory analysis in critically III patients. Am J Crit Care. 2009 Jan 1;18(1):65-72. https://doi.org/10.4037/ajcc2009626 [ Links ]
19.Nnakenyi ID, Onyenekwu C, Imoh L, Ntuen N, Mohammed I, Nlemadim C. A multicenter evaluation of the quality management practices for point-of-care testing in Nigeria: Point of care. J Near Patient Test Technol. 2017 Dec;16(4):173-176. https://doi.org/10.1097/POC.0000000000000152 [ Links ]
20.Onovughakpo-Sakpa EO, Osemwenkha SO, Adewolu OF, Okhimamhe AF. Point of care testing: Knowledge and utilization amongst doctors in government hospitals in Edo State, Nigeria. Niger J Clin Pract. 2015 Dec;18(6):780-785. https://doi.org/10.4103/1119-3077.163279 [ Links ]
21.Marshall WJ, Lapsley M, Day AP, Ayling RM, editors. Clinical biochemistry: Metabolic and clinical aspects. 3rd ed. Edinburgh: Churchill Livingstone, 2014; 932 p. [ Links ]
22.Dahm MR, McCaughey E, Li L, et al. Point-of-care testing across rural and remote emergency departments in Australia: Staff perceptions of operational impact. Stud Health Technol Inform. 2017;239:28-34. [ Links ]
23.Rasti R, Nanjebe D, Karlström J, et al. Health care workers' perceptions of point-of-care testing in a low-income country - A qualitative study in Southwestern Uganda. PLoS One. 2017 Jul 27;12(7):e0182005. https://doi.org/10.1371/journal.pone.0182005 [ Links ]
24.Bock P, Phiri C, Piwowar-Manning E, Kosloff B, Mandla N, Young A, et al. Understanding low sensitivity of community-based HIV rapid testing: experiences from the HPTN 071 (PopART) trial in Zambia and South Africa. J Int AIDS Soc. 2017 Aug;20(Suppl 6):21780. https://doi.org/10.7448/IAS.20.7.21780 [ Links ]
 Correspondence:
Thumeka Jalavu
jalavutp@gmail.com
Received: 27 June 2018
Accepted: 24 Mar. 2020
Published: 16 July 2020
Note: Additional supporting information may be found in the online version of this article as Online Supplementary Document 1.
^rND^sDyhdalo^nKS^rND^sHowanitz^nPJ^rND^sWilkinson^nDS^rND^sSouers^nRJ^rND^sJones^nBA^rND^sKost^nGJ^rND^sRobertson-Malt^nS^rND^sLewandrowski^nK^rND^sGregory^nK^rND^sMacmillan^nM^rND^sMarshall^nWJ^rND^sLapsley^nM^rND^sDay^nA^rND^sAyling^nR^rND^sJunker^nR^rND^sSchlebusch^nH^rND^sLuppa^nPB^rND^sNicols^nJH^rND^sDelany^nC^rND^sLehto^nL^rND^sBloigu^nA^rND^sLiikanen^nE^rND^sRuokonen^nA^rND^sShephard^nM^rND^sShephard^nA^rND^sMcAteer^nB^rND^sRegnier^nT^rND^sBarancek^nK^rND^sGinsberg^nBH^rND^sSchifman^nRB^rND^sNguyen^nTT^rND^sRensburg^nMA^rND^sHudson^nC^rND^sErasmus^nRT^rND^sCook^nA^rND^sLaughlin^nD^rND^sMoore^nM^rND^sNnakenyi^nID^rND^sOnyenekwu^nC^rND^sImoh^nL^rND^sNtuen^nN^rND^sMohammed^nI^rND^sNlemadim^nC^rND^sOnovughakpo-Sakpa^nEO^rND^sOsemwenkha^nSO^rND^sAdewolu^nOF^rND^sOkhimamhe^nAF^rND^sDahm^nMR^rND^sMcCaughey^nE^rND^sLi^nL^rND^sRasti^nR^rND^sNanjebe^nD^rND^sKarlström^nJ^rND^sBock^nP^rND^sPhiri^nC^rND^sPiwowar-Manning^nE^rND^sKosloff^nB^rND^sMandla^nN^rND^sYoung^nA^rND^1A01^nCarla M.^sMadeira^rND^1A01^nKhalide I.^sAzam^rND^1A02^nDaisy N.^sSato^rND^1A03^nCelso^sKhosa^rND^1A03^nNilesh^sBhatt^rND^1A04^nSofia O.^sViegas^rND^1A01^nCarla M.^sMadeira^rND^1A01^nKhalide I.^sAzam^rND^1A02^nDaisy N.^sSato^rND^1A03^nCelso^sKhosa^rND^1A03^nNilesh^sBhatt^rND^1A04^nSofia O.^sViegas^rND^1A01^nCarla M^sMadeira^rND^1A01^nKhalide I^sAzam^rND^1A02^nDaisy N^sSato^rND^1A03^nCelso^sKhosa^rND^1A03^nNilesh^sBhatt^rND^1A04^nSofia O^sViegasORIGINAL RESEARCH
Evaluation of the Ogawa-Kudoh method for tuberculosis isolation in two health units in Mozambique
Carla M. MadeiraI; Khalide I. AzamI; Daisy N. SatoII; Celso KhosaIII; Nilesh BhattIII; Sofia O. ViegasIV
INational Tuberculosis Reference Laboratory, Instituto Nacional de Saúde, Marracuene, Mozambique
IIAmerican Society for Microbiology, São Paulo, Brazil
IIICentro de Investigação e Treino em Saúde da Polana Caniço, Instituto Nacional de Saúde, Marracuene, Mozambique
IVDepartment of the Laboratory Network and Reference Services, Instituto Nacional de Saúde, Marracuene, Mozambique
ABSTRACT
BACKGROUND: Mozambique is among the highest tuberculosis, tuberculosis-HIV and multidrug-resistant-tuberculosis burden countries. Although molecular technologies are available in-country, mycobacterial isolation through culture remains an important tool for tuberculosis diagnostics and drug susceptibility testing.
OBJECTIVE: We evaluated the use of the Ogawa-Kudoh (OK) mycobacterial culture, a simple technique, to isolate Mycobacterium tuberculosis in two health units, in Maputo City, Mozambique.
METHODS: From May to December 2014, 122 patient samples were collected in Chamanculo General Hospital and Polana Caniço General Hospital. The specimens were first tested in the health units using the OK method and afterwards shipped to the National Tuberculosis Reference Laboratory for mycobacterial culture using the NALC-NaOH-Citrate (NALC) decontamination method followed by inoculation in Lowenstein Jensen (LJ) solid media as the reference standard.
RESULTS: Among 107 samples with valid results, 98 (91.6%) had concordant results in both methods; 9 (8.4%) had discordant results. The contamination rate was 4.1% (5/122) for the OK and 9.0% (11/122) for the NALC/LJ methods. The sensitivity of OK was 80% (95% confident interval [CI]: 51.4-94.7) and the specificity was 94% (95% CI: 85.8-97.3). The degree of agreement between both methods was moderate (Kappa: 0.68; 95% CI: 0.48-0.89.
CONCLUSION: The OK method showed satisfactory sensitivity and specificity. The method also had a lower contamination rate when compared to the NALC/LJ. Similar to other studies in resource-limited settings, our findings showed that the OK method can effectively be implemented in settings with limited laboratory capacity to isolate tuberculosis bacteria by culture for further testing.
Keywords: Ogawa-Kudoh; mycobacterial culture; tuberculosis diagnostics; Mozambique; laboratory.
Introduction
Mozambique is amongst the highest tuberculosis, tuberculosis-HIV and multidrug-resistant-tuberculosis burden countries.1 At present, the country has a tuberculosis laboratory network comprised of three tuberculosis reference laboratories, 85 sites performing Xpert® MTB/RIF (Cepheid, Sunnyvale, California, United States) and 400 smear microscopy laboratories. Mycobacterial culture is only performed in the three tuberculosis reference laboratories, using both solid Lowenstein Jensen (LJ) media and liquid mycobacterial growth indicator tubes for simultaneous analysis. The national testing algorithm recommends mycobacterial culture for Xpert® MTB/RIF-resistant cases and for treatment monitoring of resistant cases in order to isolate Mycobacterium tuberculosis for further drug susceptibility testing. Mycobacterial culture is considered the reference standard for tuberculosis diagnosis. However, one of its major constraints is sample transportation from the collection site to the reference laboratory. In most cases, long transportation distances are associated with the need for a cold chain, prompting high contamination rates in the presence of fast-growing bacteria, and that can lead to under-diagnosis of tuberculosis.
Another constraint on the performance of mycobacterial cultures is the need for high-level containment laboratories, because of testing procedures, and the need for qualified laboratory staff.2,3,4 These requirements come with high costs, which contribute to challenges associated with implementing mycobacterial culture in rural areas.4
In order to detect and treat all tuberculosis cases, it is necessary to expand simple and accessible diagnostic laboratory services, especially in resource-limited countries such as Mozambique. In 1974, Kudoh and Kudoh described a simple, rapid and inexpensive mycobacterial culture method, the Ogawa- Kudoh (OK) method,5 which does not require high-level laboratory containment or extensive technical training.5 Evaluating the applicability of the OK mycobacterial method opens up the possibility for less specialised laboratories to carry out tuberculosis culture, increasing the diagnosis capacity in the country. The aim of this study was to evaluate the accuracy and applicability of the OK method, as compared to LJ mycobacterial culture as the reference standard, for M. tuberculosis isolation in two peri-urban health units in Maputo City, Mozambique.
Methods
Ethical considerations
Ethical approval to conduct the study was obtained from the National Bioethics Committee (CNBS), Ministry of Health, Mozambique, with the reference number 368/CNBS/13. The patients were included after understanding the study procedures and signing a written informed consent form.
Study setting
The study was conducted in two health units in Maputo City, Chamanculo General Hospital and Polana Caniço General Hospital. Both are level II health units, located in peri-urban areas of Maputo. The distance from the National Tuberculosis Reference Laboratory in Maputo to Chamanculo General Hospital is 4.5 km and to Polana Caniço General Hospital is 2.3 km. At the time of the evaluation, both laboratories were only performing tuberculosis diagnosis by smear microscopy. Requests for mycobacterial cultures from the two health units were sent to the National Tuberculosis Reference Laboratory in Maputo.
Patients and specimens
This cross-sectional study was conducted between May 2014 and December 2014. A total of 122 samples, one per patient, categorised as new (i.e. patients with presumptive pulmonary tuberculosis who had never been treated for tuberculosis or had been treated for less than 30 days) or previously-treated (i.e. patients with presumptive pulmonary tuberculosis who had been treated for tuberculosis for more than 30 days), were consecutively included in the study. The specimens were first tested in the health units using the OK method and the remaining samples were shipped to the National Tuberculosis Reference Laboratory in Maputo for mycobacterial culture using the N-acetyl-L-cysteine (NALC)-sodium hydroxide (NaOH)-citrate decontamination method, followed by inoculation in LJ solid media, which was used as a reference standard. Auramine-O staining was also performed at Chamanculo General Hospital, and a Ziehl-Nielsen smear microscopy was performed at Polana Caniço General Hospital.
A 5-day training schedule was performed for laboratory technicians from the two health units, which also included biosafety and OK technical training. Staff technical competency was also evaluated. Standard operational procedures and registration forms were implemented for the study and supervision visits were performed once a week at each participating site. Basic patient demographics were collected from laboratory request forms.
Ogawa-Kudoh method
The OK method was performed as described by Kudoh and Kudoh.5 Briefly, sputum samples were impregnated in a swab. The impregnated swab was placed in a sterile tube containing 3 mL of 4% NaOH solution for 2 minutes and then inoculated with rotary movements in the OK media. Mycobacterial cultures were incubated at 36 ± 1 °C for up to 60 days.
NALC-NaOH-Citrate/LJ method
Equal volumes of sputum sample and NALC-NaOH-citrate reagent were added to a 50 mL conical tube, after which the mixture was stirred and allowed to stand for 15 min at room temperature. After 15 min, 35 mL 0.067M phosphate buffer (pH 6.8) was added to the mixture. The mixture was then mixed by inversion and centrifuged at 3000 g for 15 min. The supernatant was discarded and the pelleted material was resuspended in 1 mL of buffer. From the suspension, 0.5 mL was inoculated into solid LJ medium and incubated at 37 °C for up to 8 weeks. Tubes were read weekly to verify the presence of mycobacteria.6
The use of LJ as the reference standard method, instead of the liquid mycobacterial growth indicator tube culture, which had higher sensitivity and higher contamination rates when compared to LJ, was made in order to establish a direct comparison between the two solid media methods (OK and LJ). A smear microscopy examination of the suspension was also performed.
Statistical analyses
The culture contribution to diagnostics was calculated based on the recovery rate for both methods, OK and LJ, as the ratio between positive cultures and negative smear microscopy. A database was created in Microsoft Office Access (2007, Version 12; Microsoft Corp, Redmond, Washington, United States), and was later exported to IBM SPSS Statistics for Windows (2015, version 23.0; IBM Corp., Armonk, New York, United States) for analysis of sensitivity, specificity, predictive values (positive and negative) and the degree of agreement between the methods. Concordance between the tests was analysed using the Friedman Kappa test. To verify whether there were associations between the performance of the methods, and the demographic characteristics and categories of patients, the Chi-square test was performed.
The level of statistical significance was set to 0.05 (two-sided) for all analyses. Formulas to calculate sensitivity, specificity, positive predictive value, and negative predictive value were used as previously described.7 Levels of agreement were interpreted as follows: values greater than or equal to 0.75 were interpreted as having 'excellent' concordance between the two variables; values between 0.4 and 0.75, 'sufficient to good' agreement; and values smaller than 0.40, 'weak' agreement.
Results
Of the 122 samples analysed, 60 were from female patients and 62 were from male patients. The median age was 36 years (range:8-70 years). Regarding the category of the patients, most cases had previously been treated (n = 84, 68.9%) and 38 cases were new (31.1%) (data not shown in tables).
A total of 98 (80.3%) patients had concordant culture results for both methods, 9 (7.4%) had discordant results and 15 (12.3%) had contaminated results (10 samples were contaminated on LJ only, 4 contaminated on OK only, and 1 was contaminated on both methods). The contamination rate for OK was 4.1% (5/122) and for NALC/LJ, 9.0% (11/122).
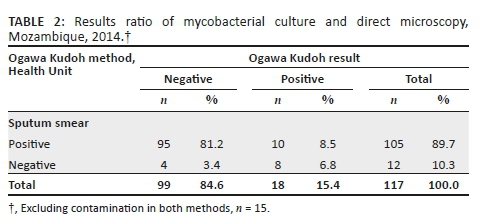
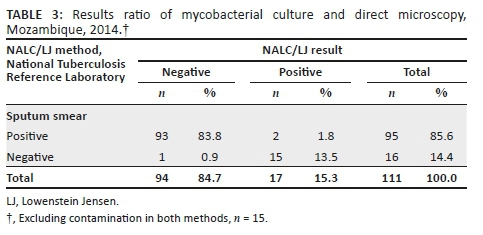
Against the NALC/LJ method as the reference standard, and excluding contaminated results, the sensitivity of the OK method was 80% (12/15; 95% CI: 51.4-94.7), the specificity was 93.5% (86/92; 95% CI: 85.8-97.3), the proportion of patients with true-negative results in both techniques was 96.6% (86/89; 95% CI: 89.9-99.1), and the proportion of patients with true-positive results using both techniques was 66.7% (12/18; 95% CI: 41.2-85.6). The agreement between the two methods was Kappa = 0.68 (95% CI: 0.48-0.89) (Table 1).
For the comparison between the two culture methods, contaminated results were also excluded from the analysis. Mycobacterial culture positivity was 17/111 (15.3%) for NALC/LJ and 18/117 (15.4%) for the OK method. The recovery rate was similar for both methods, 17.1% (18/105) for OK and 17.9% (17/95) for LJ (Tables 2 and 3).
Discussion
In this study, sensitivity, specificity, positive predictive value and negative predictive value were acceptable for the OK method. In addition, there was a high degree of agreement and the recovery rate was similar between the OK and NALC/LJ methods. The contamination rate of the NALC/LJ method was twice as high as the OK method. This finding reinforces the capacity of OK to kill other contaminants, since the OK media is slightly more acidic compared to LJ and neutralises the high concentration of NaOH used to decontaminate the sample. Similar studies performed in Brazil (in 1999, 2006, and 2018) and Peru (in 2007) also found significant differences between the contamination rates obtained with OK and with standard mycobacterial culture methods, again showing that the OK method is efficient in recovering mycobacteria and efficiently killing contaminants.8,9,10,11 These results indicate the value of the OK mycobacterial method for diagnosis of pulmonary tuberculosis as a possible alternative for the NALC/LJ method.
The OK mycobacterial method has been used successfully in other countries, particularly in Latin America, including Brazil, as an alternative to traditional culture methods.4,12,13 The Pan-American Health Organization recommends the use of OK for tuberculosis diagnosis in areas with limited laboratory capacity.14 A study conducted in Uruguay, with the purpose of assessing the efficacy of the OK method for mycobacterial culture in sputum samples, found that after conserving and shipping specimens at room temperature without the addition of any substances to prevent the overgrowth of contaminating bacteria, the OK method was appropriate for culturing mycobacteria, even when processing was delayed for 2-4 days from collection.15 Furthermore, the study showed that the duration of the decontamination time was not critical and satisfactory outcomes can still be obtained by increasing the decontamination time up to 4 min.15
In general, mycobacterial culture on LJ, when performed on sputum samples, generates approximately 20% more positives than smear microscopy,4 because the sensitivity of smears is lower when compared to culture. Access to mycobacterial culture is a challenge in Mozambique, since there are only three tuberculosis reference laboratories, some health units are hard to access by road, the distances are long and the laboratory capacity is limited. Additionally, Mozambique is a tropical country, where the temperature can reach 40 °C during summer. The sample transport system is very mixed and relies on motorbikes, bicycles, ambulances or partners, and samples are not shipped daily. All of these factors contribute to delays in samples reaching the reference laboratories and to sample contamination, leading to inconclusive results.
Although advanced molecular methods, such as the Xpert® MTB/RIF, are available in Mozambique, mycobacterial culture remains the reference standard for tuberculosis diagnosis. Furthermore, culture is needed to isolate the bacteria for other tests, including drug susceptibility tests and sequencing in this environment of increasing resistance to tuberculosis drugs. The mycobacterial culture using the OK method is a simple-to-perform, low-cost method and its biosafety requirements present a lower risk to laboratory technicians, since it does not require agitation or centrifugation steps, and thus reduces the production of aerosols. However, establishment of this assay in peripheral laboratories requires biosafety training and awareness of the risks and precautions for manipulation of Class III pathogens. Additionally, triple packing biosafety procedures must be implemented to ship positive samples from these laboratories to reference laboratories for further diagnostic assays, such as identification of the M. tuberculosis complex and drug susceptibility tests.
Limitations
The present study was conducted at only two health facilities in Maputo City, which might not provide the study with the power to generalise the findings. In addition, there may have been delays in shipping samples from the Health Centres to the National Tuberculosis Reference Laboratory in Maputo, as a result of transportation constraints. This can affect the quality of the specimen, allowing the growth of other bacteria and leading to contamination. Liquid (mycobacterial growth indicator tube) culture results were not evaluated, and were not compared with the OK or LJ mycobacterial culture methods. Liquid culture is known to have higher sensitivity, and could have had implications for the OK or LJ findings. Re-decontamination and re-inoculation of the contaminated tubes, to increase valid results and to reduce contamination rates, was not considered for the present study.
Conclusion
The OK method showed satisfactory sensitivity and specificity, with lower contamination rates and higher detection rates when compared to the NALC/LJ method. The OK method can effectively be implemented in settings with limited laboratory capacity to isolate tuberculosis bacteria by culture for further testing.
Acknowledgements
The authors acknowledge the National Tuberculosis Reference Laboratory staff for their support during the study and their commitment to improve tuberculosis diagnosis in Mozambique.
Competing interests
The authors declare that they have no financial or personal relationships that may have inappropriately influenced them in writing this article.
Authors' contributions
C.M.M. conceived the study design, performed the laboratory tests, and wrote the first draft of the article. K.I.A. supervised the laboratory work and supported the data analysis. D.N.S. and S.O.V. provided general supervision during the study implementation and reviewed the manuscript draft. C.K. and N.B. participated in the data analysis, reviewed the draft and provided writing support. All authors gave final approval of the version to be published and agree to be accountable for the accuracy and integrity of the work.
Sources of support
None.
Data availability statement
Data sharing is not applicable to this article as no new data were created or analysed in this study.
Disclaimer
The views expressed in the submitted article are the authors' own and not an official position of the institution or funder.
References
1.World Health Organization. 2018. Global tuberculosis report 2018. World Health Organization. Geneva, Switzerland. [ Links ]
2.European Centre for Disease Prevention and Control. Handbook on tuberculosis laboratory diagnostic methods in the European Union - Updated 2018 [https://ecdc.europa.eu]. Stockholm: ECDC, 2018;p. 115. [cited 2019 May 23]; Available from: https://ecdc.europa.eu/sites/portal/files/documents/TB-handbook-2018-final.pdf [ Links ]
3.World Health organization. Implementing tuberculosis diagnostics. Policy framework [https://www.who.int]. 2015. [cited 2016 February 18]; Available from: https://www.who.int/tb/publications/implementing_TB_diagnostics/en/ [ Links ]
4.Ministério da Saúde, Secretaria de Vigilância em Saúde, Departamento de Vigilância Epidemiológica. Manual Nacional de Vigilância Laboratorial da Tuberculose e outras micobactérias. 1a Edição. Brasília, 2008;p. 436. [ Links ]
5.Kudoh S, Kudoh T. A simple technique for culturing tubercle bacilli. 1974;51(1):71-82. [ Links ]
6.Kubica GP, Dye WE, Cohn ML, Middlebrook G. Sputum digestion and decontamination with N-acetyl-L-cysteine-sodium hydroxide for culture of mycobacteria. Am Rev Respir Dis. 1963;87(5):775-779. [ Links ]
7.Pestana MH, Gageiro JN. Análise de Dados para Ciências Sociais - A Complementariedade do SPSS [https://www.researchgate.net]. 6th ed. Lisbon; 2014. [cited 2015 January 28]; Available from: https://www.researchgate.net/publication/272817141_ANALISE_DE_DADOS_ PARA_CIENCIAS_SOCIAIS_A_Complementaridade_d o_SPSS_6_EDICAO_Revista_Atualizada_e_Aumentada_MARIA_HELENA_PESTANA_JOAO_NUNES_GAGEIRO [ Links ]
8.Coelho AG, Zamarioli LA, Vicente MP, Reffo e Silva R. Avaliaçäo do método de Ogawa: Kudoh para o isolamento de micobactérias/Evaluation of the Ogawa: Kudoh method for the isolation of mycobacteria. Rev Inst Adolfo Lutz. 1999;2(58):57-61. [ Links ]
9.Parimango Rodríguez D, Chávez Castillo M, Luján Velásquez M, Otiniano García M, Robles Castillo H, Muñoz Ganoza E. Comparación de los medios Ogawa y Löwenstein Jensen en el aislamiento de Mycobacterium tuberculosis de pacientes con tuberculosis pulmonar. Hospital Regional Docente de Trujillo, Perú. Rev Med Vallejiana. 2007;4(1):24-31. https://doi.org/10.18050/revistamedicavallejiana.v4i1.2217 [ Links ]
10.Jaspe RC, Rojas YM, Flores LA, Sofia Toro E, Takiff H, De Waard JH. Evaluation of the Kudoh swab method for the culturing of Mycobacterium tuberculosis in rural areas. Trop MedInt Health. 2009;14(4):468-471. https://doi.org/10.1111/j.1365-3156.2009.02236.x [ Links ]
11.Costa RR da, Silva SF da, Fochat RC, et al. Comparison between Ogawa-Kudoh and modified Petroff techniques for mycobacteria cultivation in the diagnosis of pulmonary tuberculosis. Einstein (São Paulo) [www.scielo.br]. 2018 [cited 2019 May 23]; 16(2). Available from: http://www.scielo.br/scielo.php?script=sci_arttext&pid=S1679-45082018000200209&lng=en&tlng=en [ Links ]
12.Aily DCG, Shikama M de LM, Oliveira MLF, Silva RM. Perfil bacteriológico da tuberculose pulmonar na região de Campinas e das Diretorias Regionais de Saúde XII, XV e XX - 1999/2000. Rev Inst Adolfo Lutz. 2003;62(1):5-10. [ Links ]
13.Borges M, Cafrune PI, Possuelo LG, Valim AR de M, Ribeiro MO, Rossetti MLR. Análise molecular de cepas de Mycobacterium tuberculosis provenientes de um centro de saúde ambulatorial em Porto Alegre, (RS). J BrasPneumol. 2004;30(4):358-364. https://doi.org/10.1590/S1806-37132004000400010 [ Links ]
14.Organización Panamericana de la Salud. Manual para el diagnóstico bacteriológico de la tuberculosis parte II - CULTIVO [https://www.paho.org/en]. 2008, 107 p. [Acessed on January 19, 2015]; Available from: http://www1.paho.org/Spanish/AD/DPC/CD/tb-labs-cultivo.pdf. [ Links ]
15.Rivas C, Coitinho C, Dafond V, Corbo M, Baldjian M. Performance of the Ogawa-Kudoh method for isolation of mycobacteria in a laboratory with large-scale workload. Rev ArgentMicrobiol. 2010;42(2):87-90. [ Links ]
Correspondence:
Sofia Viegas
viegas_sofia@hotmail.com
Received: 30 Oct. 2018
Accepted: 07 Apr. 2020
Published: 20 July 2020
ORIGINAL RESEARCH
Prevalence of cryptococcal antigen (CrAg) among HIV-positive patients in Eswatini, 2014-2015
Samson M. HaumbaI; Mitsuru TodaII, III; Rossana JeffriesI; Peter EhrenkranzIV; Munyaradzi PasipamireV; Trong AoVI; Nomthandazo LukheleV; Sikhathele MazibukoV; Mandzisi MkhontfoI; Rachel M. SmithIII; Tom ChillerIII
IUniversity Research Co., LLC, Mbabane, Eswatini
IIEpidemic Intelligence Service (EIS), Division of Scientific Education and Professional Development, Center for Surveillance, Epidemiology, and Laboratory Services (CSELS), Centers for Disease Control and Prevention (CDC), Atlanta, Georgia, United States
IIIMycotic Diseases Branch (MDB), Division of Foodborne, Waterborne, and Environmental Disease (DFWED), National Center for Emerging and Zoonotic Infectious Diseases (NCEZID), Centers for Disease Control and Prevention (CDC), Atlanta, Georgia, United States
IVGlobal Development, Bill and Melinda Gates Foundation, Seattle, Washington, United States
VMinistry of Health Eswatini National AIDS Programme (ENAP), Mbabane, Eswatini
VICenters for Disease Control and Prevention (CDC), Mbabane, Eswatini
ABSTRACT
BACKGROUND: Cryptococcal meningitis is a leading cause of death amongst people living with HIV. However, routine cryptococcal antigen (CrAg) screening was not in the national guidelines in Eswatini.
OBJECTIVES: A cross-sectional study was conducted between August 2014 and March 2015 to examine CrAg prevalence at Mbabane Government Hospital in Eswatini.
METHODS: We collected urine and whole blood from antiretroviral-therapy-naïve patients with HIV and a cluster of differentiation 4 (CD4) counts < 200 cells/mm3 for plasma and urine CrAg lateral flow assay (LFA) screening at the national HIV reference laboratory. Two CD4 cut-off points were used to estimate CrAg prevalence: CD4 < 100 and < 200 cells/mm3. Sensitivity and specificity of urine CrAg LFA was compared to plasma CrAg LFA.
RESULTS: Plasma CrAg prevalence was 4% (8/182, 95% confidence interval [CI]: 2-8) amongst patients with CD4 counts of < 200 cells/mm3, and 8% (8/102, 95% CI: 3-15) amongst patients with CD4 counts of < 100 cells/mm3. Urine CrAg LFA had a sensitivity of 100% (95% CI: 59-100) and a specificity of 80% (95% CI: 72-86) compared with plasma CrAg LFA tests for patients with CD4 < 200 cells/mm3. Forty-three per cent of 99 patients with CD4 < 100 were at World Health Organization clinical stages I or II.
CONCLUSION: The prevalence of CrAg in Eswatini was higher than the current global estimate of 6% amongst HIV-positive people with CD4 < 100 cell/mm3, indicating the importance of initiating a national screening programme. Mechanisms for CrAg testing, training, reporting, and drug and commodity supply issues are important considerations before national implementation.
Keywords: cryptococcal antigenaemia screening; prevalence; people living with HIV; cryptococcal meningitis; advanced HIV disease package; Eswatini.
Introduction
Cryptococcosis, caused by Cryptococcus neoformans or Cryptococcus gattii, is an invasive and life-threatening fungal infection, often affecting immunocompromised patients. Cryptococcal meningitis, a type of cryptococcosis affecting the brain meninges, is one of the leading opportunistic infections and causes of death amongst people living with HIV. It especially affects patients with advanced HIV who have a cluster of differentiation 4 (CD4) count < 200 cells/mm3 or who are at stages III or IV of the World Health Organization (WHO) HIV infection clinical stages.1 In 2014, globally, the cryptococcal antigenaemia prevalence was estimated at 6% (278 000) amongst patients with CD4 < 100 cells/mm3, with approximately 223 100 cryptococcal meningitis cases occurring annually.2 In the same year, 2014, the annual deaths due to cryptococcal meningitis were estimated at 181 100, with 75% (135 900) of deaths occurring in sub-Saharan Africa.2
The WHO recommends targeted screening of HIV-positive patients to enable early detection and pre-emptive treatment of cryptococcal infection.1 Pre-emptive antifungal therapy can prevent cryptococcal meningitis-related mortality and morbidity in cryptococcal antigen (CrAg)-positive antiretroviral therapy (ART)-naïve patients.3 The CrAg lateral flow assay (LFA) is an affordable,4 cost-effective,5 and simple point-of-care assay for CrAg testing in blood and cerebrospinal fluid (CSF). CrAg can be detected a median of three weeks before clinical evidence of cryptococcal meningitis.6
The prevalence of HIV in Eswatini (formerly Swaziland) is amongst the highest in the world.7 Despite the high HIV prevalence and known risk of cryptococcal meningitis, CrAg prevalence amongst people with advanced HIV disease, or CD4 < 200 cells/mm3, is unknown in Eswatini. At the time of this study, routine CrAg screening was not included in the national guidelines and its clinical utility was unknown. We conducted a cross-sectional study to examine CrAg prevalence at a national hospital in Eswatini. We also compared sensitivity and specificity of urine CrAg LFA relative to plasma CrAg LFA.
Methods
Ethical considerations
The Swaziland Scientific and Ethics Committee (MH/599C/ FWA 000 15267), and the Centers for Disease Control and Prevention Institutional Review Board reviewed and approved the study protocol (CGH HSR tracking #2014-139). Study nurses obtained verbal informed consent from all participants.
Study location and population
A cross-sectional study was implemented at Mbabane Government Hospital, a national hospital, in Eswatini. Mbabane Government Hospital is a public hospital with a 500 bed capacity. It is the largest HIV treatment and care centre in Eswatini and serves the population of the Hhohho region (320 651), as well as the population of the nation at large (1 093 2381 million).8
We assessed eligibility of ART-naïve adults ≥ 18 years old in the study who attended the Voluntary Counseling and Testing clinic, as well as hospitalised patients, by determining their CD4 levels using Alere PimaTM (Abbott Laboratories, Chicago, Illinois, United States). For HIV-positive patients with CD4 ≤ 350 cells/mm3 by the Alere PimaTM CD4 test, a confirmatory test was completed using BD FACSCaliburTM (Beckton Dickinson, San Jose, California, United States) flow cytometry. Patients with CD4 < 200 cells/mm3 on BD FACSCaliburTM were enrolled in the study.
Enrolment occurred from 18 August 2014 to 19 March 2015. We excluded pregnant women, patients with a previous diagnosis or treatment for cryptococcal meningitis, and patients who had ever received fluconazole for < 5 days before study enrolment. Blood and urine samples were obtained during the patient's first visit to the HIV testing clinic or soon after HIV testing, if an inpatient. Plasma and urine CrAg screening were conducted using a LFA (IMMY, Norman, Oklahoma, United States) at the hospital laboratory for patients both with and without signs of cryptococcal meningitis.
Data collection
Trained study nurses and research assistants conducted data collection. Study nurses and research assistants gave a communication leaflet providing basic information on Cryptococcus spp. and HIV infection as well as the objectives of the study to eligible patients. After the informed consent process, data on patient demographic characteristics including age, sex, marital status, area of residence (rural or urban), level of education, and the clinical stage of HIV infection9 were collected.
Clinical procedures
At enrolment, study nurses assessed patients' clinical signs and symptoms of cryptococcal meningitis such as fever, headache, neck stiffness, altered mental status, photophobia, nausea, night sweats, cough, vomiting, shortness of breath, skin papules, or kerning sign. Patients with positive plasma CrAg results and signs and symptoms of cryptococcal meningitis underwent a lumbar puncture as part of routine practice. CSF samples obtained from the lumbar puncture were collected for CrAg LFA to diagnose cryptococcal meningitis. Patients diagnosed with cryptococcal meningitis were treated according to a standard of care based on WHO guidelines,3 which included amphotericin B (0.7 mg/kg/day) and fluconazole (800 mg) for 2 weeks followed by 400 mg of fluconazole for 8 weeks and then maintained at 200 mg for secondary prophylaxis. Patients who refused a lumbar puncture but had positive plasma CrAg results were offered pre-emptive therapy which followed WHO recommendations of fluconazole 800 mg/day for the first 2 weeks, followed by 8 weeks of 400 mg/day of fluconazole daily, and a 200 mg/day fluconazole maintenance dosage.3
The South African clinical guidelines (2013) were followed for patients with positive plasma CrAg and negative CSF CrAg results.10 ART was delayed for 2 weeks to decrease the risk of immune reconstitution inflammatory syndrome, and they were prescribed pre-emptive fluconazole oral treatment to prevent the development of meningeal infection.10 Because of resource constraints, patients' cryptococcal infections were not verified using X-ray or other imaging technology, and we did not follow the individual patients' clinical course to collect outcome measures for the purposes of this study.
Laboratory procedures
All blood and urine specimens were packaged according to WHO standards. Study nurses collected fresh urine samples and recorded urine CrAg LFA positive results. In addition, study nurses collected whole blood in ethylene diamine tetra acetic acid-treated test tubes and stored it at room temperature. The blood was centrifuged for 5 min at 300 revolutions per minute to obtain plasma samples on the same day that blood was collected. Plasma and urine samples were stored at 2 °C - 8 °C for up to 72 h. CD4 retesting was completed using FACSCaliburTM and research assistants conducted CrAg testing at the laboratory the next day using CrAg LFA on samples from patients with CD4 < 200 cells/mm3. In addition, research assistants performed daily positive and negative control LFA testing as well as lot-to-lot testing to ensure the quality of reagents. Research assistants communicated all laboratory results to physicians for clinical management, and clinicians informed the participants of their results.
Sensitivity and specificity analyses
We compared urine and plasma CrAg LFA results using plasma LFA as the gold standard. Records were retained for study purposes and not for clinical diagnosis or treatment purposes, and our specificity and sensitivity analyses did not take into account clinical or radiological findings.
Analyses
Data were double entered using EpiData (EpiData Association, Odense, Denmark). The descriptive analyses and calculation of Wilson scores on 95% confidence intervals (CI) on the CrAg prevalence were conducted using Stata 15 (StataCorp, College Station, Texas, United States).
Results
Of 313 patients initially screened for eligibility, 58% (182/313) had CD4 counts < 200 cells/mm3 by FACSCaliburTM (Figure 1). Of the 182 eligible patients, 79% (144/182) were from the outpatient Voluntary Counseling and Testing clinic and 21% (38/182) were from the inpatient ward (Table 1).
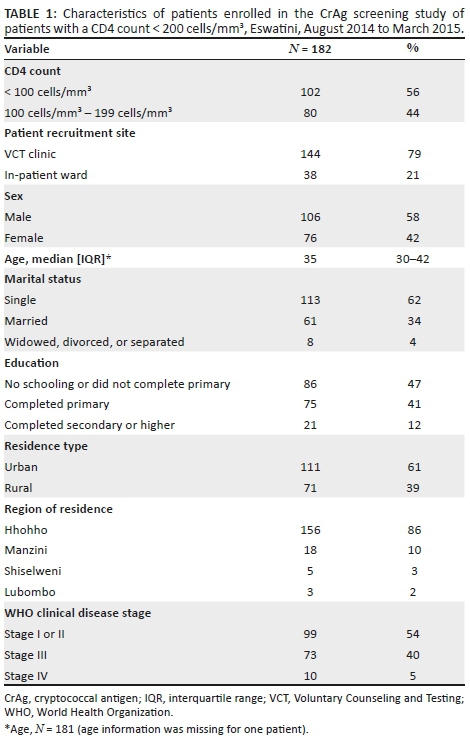
Of the 182 patients with CD4 counts < 200 cells/mm3 by FACSCaliburTM, 42% (76/182) were women, the median age of the participants was 35 years (interquartile range: 30-42)], and 61% (111/182) were from urban areas (Table 1). Most (86%, 156/182) patients were from the Hhohho region, 10% (18/182) from Manzini, 3% (5/189) from Shiselweni, and 2% (3/182) from Lubombo. Almost half of the patients (47%, 86/182) did not complete primary school or did not receive any schooling, 41% (75/182) completed primary school, and 12% (21/182) completed secondary school or higher. Most (62%, 113/182) patients were single and never married, 34% (61/182) were married, and 4% (8/182) were widowed, divorced, or separated. More than half of the patients (54%, 99/182) were at WHO clinical stages I or II, 40% (73/182) at stage III, and 5% (10/182) at stage IV.
Of the 182 patients with CD4 count < 200 cells/mm3, 56% (102/182) had a CD4 count < 100 cells/mm3. Forty-three percent (44/102) of these were at WHO clinical stages I or II and 57% (58/102) at stages III or IV. Of patients with CD4 counts 100 cells/mm3 - 199 cells/mm3, 69% (55/80) were at WHO clinical stages I or II and 31% (25/80) at stages III or IV.
Cryptococcal antigen lateral prevalence
The plasma CrAg prevalence was 8% (8/102, 95% CI: 3-15) amongst patients with CD4 counts < 100 cells/mm3. When considering the higher cut-off point of a CD4 count < 200 cells/mm3, the plasma CrAg prevalence decreased to 4% (8/182, 95% CI: 2-8) (Figure 1). All eight plasma CrAg-positive patients had CD4 cell counts < 100 cells/mm3 and none had CD4 cell counts in the 100 cells/mm3 - 199 cells/mm3 range (prevalence 4% [8/182], 95% CI: 2-8).
Of the patients at the Voluntary Counseling and Testing clinic, 47% (68/144) had CD4 counts 100 cells/mm3 - 199 cells/mm3, and 53% (76/144) patients had CD4 counts < 100 cells/mm3. Of the 76, 5% (4/76), were plasma CrAg-positive. Three out of the four patients who were plasma CrAg-positive were CSF CrAg negative; one patient did not complete a lumbar puncture.
Of the patients at the inpatient ward, 32% (12/38) had CD4 counts 100 cells/mm3 - 199 cells/mm3 and 68% (26/38) had CD4 counts < 100 cells/mm3. Fifteen percent (4/26) of patients, all with CD4 counts < 100 cells/mm3, were plasma CrAg-positive. Of the four patients who were plasma CrAg-positive at the inpatient ward, one patient was CSF CrAg-positive and the other three patients were CSF CrAg negative (Figure 1).
Sensitivity and specificity of urine cryptococcal antigen lateral flow assay
Urine samples were collected from 168 patients; 82% (137/168) from the Voluntary Counseling and Testing clinic and 18% (31/168) from the inpatient ward. Forty-six percent (77/168) of patients had CD4 counts of 100 cells/mm3 - 199 cells/mm3 and 54% (91/168) had CD4 counts < 100 cells/mm3 by FACSCaliburTM. Urine CrAg-positive prevalence was 25% (23/91) amongst patients with CD4 counts < 100 cells/mm3 and 22% (17/77) amongst patients with CD4 counts 100 cells/mm3 - 199 cells/mm3.
Urine CrAg LFA had a sensitivity of 100% (95% CI: 59-100) and a specificity of 80% (95% CI: 72-86) compared with plasma CrAg LFA for patients with CD4 < 200 cells/mm3. There were seven true positives, 33 false positives (i.e., positive on urine CrAg LFA but negative on plasma CrAg LFA), 128 true negatives, and zero false negatives (i.e., negatives on urine CrAg LFA but positive on plasma CrAg LFA) (Table 2).

For patients with < 100 cells/mm3, sensitivity of the urine CrAg LFA compared with plasma CrAg LFA was 100% (95% CI: 59-100), and specificity was 81% (95% CI: 71-89). There were seven true positives, 16 false positives (i.e., positive on urine CrAg LFA but negative on plasma CrAg LFA), 68 true negatives, and zero false negatives (i.e., negatives on urine CrAg LFA but positive on plasma CrAg LFA) (Table 3).

Discussion
We conducted a cross-sectional study on CrAg prevalence at a national reference hospital in Eswatini. The study showed that patients with CD4 < 100 cells/mm3 at the national reference hospital had a CrAg prevalence of 8%, which is higher than the 2014 global estimate of 6%2 and similar to the prevalence found in Uganda5 and South Africa.11 This study is relevant in the context of recent WHO guidelines on managing advanced HIV disease, rapid initiation of ART,1,9 and the current recommendation to include CrAg screening in national guidelines in Eswatini12 and in other countries.13
Combining CrAg screening and early treatment for cryptococcal infection are cost-effective interventions compared with standard care to prevent morbidity and mortality from cryptococcal meningitis amongst immunocompromised people living with HIV.5,11,14,15,16,17 Most importantly, CrAg screening has the potential to improve HIV outcomes by reducing morbidity and mortality. The 'Reduction of Early Mortality among HIV-infected Subjects sTarting AntiRetroviral Therapy' (REMSTART) trial in Tanzania and Zambia showed CrAg screening, pre-emptive treatment, and community support that led to a 28% reduction in mortality amongst patients with advanced HIV disease,18 and the 'Reduction of EArly mortaLITY in HIV-infected African adults and children starting antiretroviral therapy' (REALITY) trial in Kenya, Malawi, Uganda, and Zimbabwe showed that an enhanced prophylaxis package reduced mortality by 27%.19
CD4 cell counts are essential in determining the timing of ART initiation for patients with advanced HIV disease, because early ART initiation could lead to worse outcomes for CrAg-positive patients.20 Current WHO recommendations include CrAg screening for people living with HIV at CD4 cell counts < 100 cells/mm3, and offering pre-emptive antifungal therapy before initiating ART.1 In the era of '90-90-90'21 and 'test and start' strategies where rapid ART initiation is promoted, there is potential risk in offering ART to patients presenting with advanced HIV disease with low CD4 cell counts or WHO clinical stages III or IV22 who are at high risk of opportunistic infection.23 Screening these patients for undiagnosed Cryptococcus infection can prevent life-threatening immune reconstitution inflammatory syndrome.26 Yet, assessment of a clinical stage without a CD4 count is not sufficient. In our study, 43% of patients with CD4 < 100 cells/mm3 were classified as WHO clinical stages I or II. These patients would not have been screened for CrAg in the absence of CD4 cell count testing.
Although studies suggest that screening may be considered at CD4 < 200 cells/mm3,24 our study suggests that selecting for patients with CD4 < 100 cells/mm3 might be a priority, since all plasma CrAg-positive patients had CD4 < 100 cells/mm3. Since CrAg-positive patients were found at both outpatient (prevalence: 5%) and inpatient (prevalence: 15%) facilities, CD4-directed CrAg screening should be recommended for patients presenting in either setting.
The sensitivity and specificity of urine CrAg compared with plasma CrAg testing were similar to the finding of a Tanzanian study.25 Those findings showed that urine CrAg testing could be useful in ruling out disease, if the result is negative, but may not be a reliable stand-alone screening tool because of the prevalence of false-positive results.
The Eswatini Ministry of Health revised its HIV guidelines in 2018 and included CrAg screening for adults with CD4 cell < 100 cells/mm3 or children with CD4 counts at less than 25% of total lymphocytes,12 as well as pre-emptive treatment as a package for advanced disease management to reduce morbity and mortality.26,27,28 Education of patients is important in order to inform them that cryptococcal meningitis is not, as some Swazi patients refer to it, the 'headache that kills', but rather a preventable and treatable disease (personal communication with patients). Before rollout, training of the clinical and laboratory workforce on CrAg testing and reporting, and ensuring adequate supplies of antifungal prophylaxis, treatment (fluconazole, flucytocine, and amphotericin B), lumbar puncture kits and CrAg LFA kits are essential. Moreover, joint ownership of the CrAg screening program by the Swaziland National HIV/AIDS Programme and Swaziland Health Laboratory Services have been established in-country, which could help accelerate buy-in from the clinical and laboratory workforces and successfully roll out the national CrAg screening programme.
Limitations
There are several limitations to this study. Firstly, the study was conducted in one hospital, thus it is not a nationally-representative sample. However, this hospital is a national reference hospital that captures a large number of patients who are CrAg-positive. Secondly, the study only assessed ART-naïve patients, whereas patients failing ART may also have CD4 cell counts < 100 cell/mm3 and become at risk of cryptococcal infection. In addition, the cross-sectional study design and small sample size limited our ability to measure or compare patient outcomes. Further studies to examine patient treatment and outcome measures, and address CrAg prevalence among ART-experienced patients, are warranted. Finally, sensitivity and specificity analyses of urine CrAg LFA were evaluated compared with plasma LFA and did not take into account radiological or clinical findings.
Conclusion
This study indicated that the CrAg prevalence at a national hospital in Eswatini was higher than the global CrAg estimates of 6% amongst HIV-positive people with CD4 < 100 cell/mm3. Our findings support the current Eswatini national cryptococcal screening and treatment guidelines. Issues of drug and commodity supply and training mechanisms for CrAg testing, monitoring, evaluation and reporting are important considerations, before national implementation of plasma CrAg LFA screening.
Trustworthiness
The following measures were undertaken to ensure trustworthiness:
Cryptococcal antigen lateral flow assay Quality Control: Laboratory technologists at the National Reference Laboratory conducted quality control testing for the CrAg LFA reagents on a weekly basis. A positive and negative control LFA test as well as lot-to-lot testing were performed to ensure the quality of the reagents. The reagents were discarded when the positive or negative controls did not yield the expected results, and a new set of LFA reagents were requested from the laboratory supervisor and tested prior to further patient testing for CrAg.
Training of clinicians and study personnel: The CDC-Eswatini and CDC-Atlanta study teams, who were experienced in CrAg screening, trained the research assistants, clinicians and laboratory personnel involved in the care of patients.
The training of clinicians and study personnel covered the following topics:
•Basic information about cryptococcal disease, including early and disseminated infection
•Explanation of the rationale behind the implementation of this screening programme
•Review of the algorithm for implementation and associated study forms and documents
•Review of procedure for sending samples to the National Reference Laboratory and obtaining results
•Role-playing using different clinical scenarios in order to ensure proper adherence to the algorithm and flow of patients
•Instructions and practice in performing and interpreting the LFA CrAg test
•Review of the procedure for sending CSF CrAg results to HIV Care Centre staff
•Reviewing standard operating procedures relevant to the laboratory staff
•Study protocol
•Data collection tools
•Research ethics
•Quality Assurance.
Acknowledgements
We would like to thank the Eswatini Ministry of Health, the Mbabane Government Hospital Voluntary Counseling and Testing Clinic, laboratory, and inpatient wards for facilitating the study and all of the patients and healthcare workers who participated in this study. We thank Charmaine Khudzie Mlambo, Lydia Mpango and Marianne Calnan for being part of the team that conceptualised this study, Kelly Rose-Clarke and Greg Greene for training data collectors, Thokozani Maseko and Mulungie Mwembo for enrolling participants and collecting specimens, Dan Gama for facilitating reagent support from the African Society for Laboratory Medicine, and Nombuso Ntshalintshali for testing specimens in the laboratory. We are grateful to Brendan R. Jackson, Alexander Jordan, and Juliana Da Silva for providing valuable feedback to the draft manuscript.
Competing interests
Authors declare that they have no competing interests.
Authors' contributions
S.M.H. (project team leader), P.E., T.A. and T.C. conceived the study. R.J. (overall study implementation coordinator), S.M.H., M.P., T.A., N.L., S.M. and R.M.S. oversaw implementation of the study. M.T. and R.J. performed the analysis, and M.T., S.M.H., M.M. and R.J. wrote the original draft. All authors read and approved the final manuscript.
Source of support
The study was made possible by the generous support of the American people through the United States President's Emergency Plan for AIDS Relief through the United States Centers for Disease Control and Prevention under the Provision of HIV/AIDS and TB Related Laboratory Support and Technical Assistance project in Eswatini managed by University Research Co., LLC (Cooperative Agreement Number 1U2G/PS001896 and Principal Investigator - Dr. Neeraj Kak). Study reagents were procured through the African Society for Laboratory Medicine.
Data availability statement
The data that support the findings of this study are available from the corresponding author, [S.M.H.], upon reasonable request.
Disclaimer
The findings and conclusion in this report are those of the authors and do not necessarily represent the official position of the Centers for Disease Control and Prevention.
References
1.World Health Organization. Guidelines for the diagnosis, prevention, and management of cryptococcal disease in HIV-infected adults, adolescents and children, March 2018: Supplement to the 2016 consolidated guidelines of the use of antiretroviral drugs for treating and preventing HIV infection [homepage on the Internet]. 2018 [cited 2018 May 18]. Available from: http://www.who.int/hiv/pub/guidelines/cryptococcal-disease/en/ [ Links ]
2.Rajasingham R, Smith RM, Park BJ, et al. Global burden of disease of HIV-associated cryptococcal meningitis: An updated analysis. Lancet Infect Dis. 2017;17(8):873-881. https://doi.org/10.1016/S1473-3099(17)30243-8 [ Links ]
3.World Health Organization. Rapid advice: Diagnosis, prevention and management of cryptococcal disease in HIV-infected adults, adolescents and children [homepage on the Internet]. 2011 [cited 2018 Jan 10]. Available from: http://www.who.int/hiv/pub/cryptococcal_disease2011/en/ [ Links ]
4.Boulware DR, Rolfes MA, Rajasingham R, et al. Multisite validation of cryptococcal antigen lateral flow assay and quantification by laser thermal contrast. Emerg Infect Dis. 2014;20(1):45. https://doi.org/10.3201/eid2001.130906 [ Links ]
5.Meya DB, Manabe YC, Castelnuovo B, et al. Serum cryptococcal antigen (CRAG) screening is a cost-effective method to prevent death in HIV-infected persons with CD4≤ 100/μL starting HIV therapy in resource-limited settings. Clin Infect Dis. 2010;51(4):448. https://doi.org/10.1086/655143 [ Links ]
6.Kozel TR, Bauman SK. CrAg lateral flow assay for cryptococcosis. Expert Opin Med Diagn. 2012;6(3):245-251. https://doi.org/10.1517/17530059.2012.681300 [ Links ]
7.Nkambule R, Nuwagaba-Biribonwoha H, Mnisi Z, et al. Substantial progress in confronting the HIV epidemic in Swaziland: First evidence of national impact. In: Proceedings from the International AIDS Society 9th IAS Conference on HIV Science, 23-26 July 2017, Paris, France. Abstract 5837 [homepage on the Internet]. 2017 [cited 2018 May 18]. Available from: http://programme.ias2017.org/Abstract/Abstract/5837. [ Links ]
8.Swaziland Central Statistical Office. The 2017 population and housing census: Preliminary results [homepage on the Internet]. Mbabane; 2017 [cited 2019 May 17]. Available from: http://sz.one.un.org/content/unct/swaziland/en/home/news-centre/news/swaziland-releases-population-count-from-2017-housing-and-popula.html [ Links ]
9.World Health Organization. Guidelines for managing advanced HIV disease and rapid initiation of antiretroviral therapy [homepage on the Internet]. 2017 [cited 2018 Jan 12]. Available from: http://www.who.int/hiv/pub/guidelines/advanced-HIV-disease/en/ [ Links ]
10.Govender N, Meintjes G, Bicanic T, et al. Guideline for the prevention, diagnosis and management of cryptococcal meningitis among HIV-infected persons: 2013 update. S Afr J HIV Med. 2013;14(2):76-86. https://doi.org/10.4102/sajhivmed.v14i2.82 [ Links ]
11.Jarvis JN, Lawn SD, Vogt M, et al. Screening for cryptococcal antigenemia in patients accessing an antiretroviral treatment program in South Africa. Clin Infect Dis. 2009;48(7):856-862. https://doi.org/10.1086/597262 [ Links ]
12.Ministry of Health: Swaziland. Swaziland integrated HIV management guidelines [homepage on the Internet]. 2018 [cited 18 May 2019]. Available from: http://www.infocenter.nercha.org.sz/sites/default/files/Swaziland%20Integra ed%20HIV%20Management%20Guidelines_0.pdf [ Links ]
13.Greene G, Sriruttan C, Le T, et al. Looking for fungi in all the right places: Screening for cryptococcal disease and other AIDS-related mycoses among patients with advanced HIV disease. Curr Opin HIV AIDS. 2017;12(2):139-147. https://doi.org/10.1097/COH.0000000000000347 [ Links ]
14.Beyene T, Woldeamanuel Y, Asrat D, et al. Comparison of cryptococcal antigenemia between antiretroviral naïve and antiretroviral experienced HIV positive patients at two hospitals in Ethiopia. PLoS One. 2013;8(10):e75585. https://doi.org/10.1371/journal.pone.0075585 [ Links ]
15.Boulware DR, Meya DB, Muzoora C, et al. Timing of antiretroviral therapy after diagnosis of cryptococcal meningitis. New Engl J Med. 2014;370(26):2487-2498. https://doi.org/10.1056/NEJMoa1312884 [ Links ]
16.Jarvis JN, Harrison TS, Lawn SD, et al. Cost effectiveness of cryptococcal antigen screening as a strategy to prevent HIV-associated cryptococcal meningitis in South Africa. PLoS One. 2013;8(7):e69288. https://doi.org/10.1371/journal.pone.0069288 [ Links ]
17.Micol R, Tajahmady A, Lortholary O, et al. Cost-effectiveness of primary prophylaxis of AIDS associated cryptococcosis in Cambodia. PLoS One. 2010;5(11):e13856. https://doi.org/10.1371/journal.pone.0013856 [ Links ]
18.Mfinanga S, Chanda D, Kivuyo SL, et al. Cryptococcal meningitis screening and community-based early adherence support in people with advanced HIV infection starting antiretroviral therapy in Tanzania and Zambia: An open-label, randomised controlled trial. Lancet. 2015;385(9983):2173-2182. https://doi.org/10.1016/S0140-6736(15)60164-7 [ Links ]
19.Hakim J, Musiime V, Szubert AJ, et al. Enhanced prophylaxis plus antiretroviral therapy for advanced HIV infection in Africa. New Engl J Med. 2017;377(3):233-245. https://doi.org/10.1056/NEJMoa1615822 [ Links ]
20.Abassi M, Rhein J, Meya DB, et al, editors. Cryptococcal disease in the era of "test and treat": Is there cause for concern? Open forum infectious diseases. Oxford University Press US; 2017. [ Links ]
21.Joint United Nations Programme on HIV/AIDS (UNAIDS). 90-90-90 an ambitious treatment target to help end the AIDS epidemic [homepage on the Internet]. 2014 [cited 18 May 2019]. Available from: http://www.unaids.org/sites/default/files/media_asset/90-90-90_en_0.pdf [ Links ]
22.Ford N, Meintjes G, Calmy A, et al. Managing advanced HIV disease in a public health approach. Clin Infect Dis. 2018;66(suppl_2):S106-S110. [ Links ]
23.Denning DW. Minimizing fungal disease deaths will allow the UNAIDS target of reducing annual AIDS deaths below 500 000 by 2020 to be realized. Phil Trans Royal Soc B: Biol Sci. 2016;371(1709):20150468. https://doi.org/10.1098/rstb.2015.0468 [ Links ]
24.Ford N, Shubber Z, Jarvis JN, et al. CD4 cell count threshold for cryptococcal antigen screening of HIV-infected individuals: A systematic review and meta-analysis. Clin Infect Dis. 2018;66(suppl_2):S152-S159. https://doi.org/10.1093/cid/cix1143 [ Links ]
25.Magambo KA, Kalluvya SE, Kapoor SW, et al. Utility of urine and serum lateral flow assays to determine the prevalence and predictors of cryptococcal antigenemia in HIV-positive outpatients beginning antiretroviral therapy in Mwanza, Tanzania. J Int AIDS Soc. 2014;17(1):19040. https://doi.org/10.7448/IAS.17.1.19040 [ Links ]
26.Scriven JE, Lalloo DG, Meintjes G. Changing epidemiology of HIV-associated cryptococcosis in sub-Saharan Africa. Lancet Infect Dis. 2016;16(8):891-892. https://doi.org/10.1016/S1473-3099(16)30145-1 [ Links ]
27.Williamson PR. The relentless march of cryptococcal meningitis. Lancet Infect Dis. 2017;17(8):790-791. https://doi.org/10.1016/S1473-3099(17)30245-1 [ Links ]
28.WHO. Rapid advice: Diagnosis, prevention and management of cryptococcal disease in HIV-infected adults, adolescents and children [homepage on the Internet]. 2011 [cited 2019 May 17]. Available from: https://apps.who.int/iris/bitstream/handle/10665/44786/9789241502979_eng.pdf?sequence=1 [ Links ]
Correspondence:
Samson Haumba
samsonh@urc-sa.com
Received: 05 Nov. 2018
Accepted: 07 Apr. 2020
Published: 29 July 2020
ORIGINAL RESEARCH
Detecting tuberculosis in pregnant and postpartum women in Eswatini
Munyaradzi PasipamireI; Edward BroughtonII, III; Mandzisi MkhontfoIV; Gugu MaphalalaV; Batsabile Simelane-VilaneIV; Samson HaumbaIV
IResearch and Evaluation, Eswatini National AIDS Programme, Ministry of Health, Mbabane, Eswatini
IIResearch and Evaluation, University Research Co. LLC, Chevy Chase, Maryland, United States
IIIInternational Health, Johns Hopkins Bloomberg School of Public Health, Baltimore, Maryland, United States
IVUniversity Research Co. LLC, Mbabane, Eswatini
VEswatini Health Laboratory Services, Mbabane, Eswatini
ABSTRACT
BACKGROUND: Tuberculosis diagnosis in pregnancy is complex because tuberculosis symptoms are often masked by physiological symptoms of pregnancy. Untreated tuberculosis in pregnant and postpartum women may lead to maternal morbidity and low birth weight. Tuberculosis in HIV-positive pregnant women increases the risk of maternal and infant mortality.
OBJECTIVE: This study aimed to determine tuberculosis prevalence stratified by HIV status and identify screening algorithms that maximise detection of active tuberculosis among pregnant and postpartum women in Eswatini.
METHODS: Women were enrolled at antenatal and postnatal clinics in Eswatini for tuberculosis screening and diagnostic investigations from 01 April to 30 November 2015 in a cross-sectional study. Sputum samples were collected from all participants for tuberculosis diagnostic tests (smear microscopy, GeneXpert, MGIT culture). Blood and urine samples were collected from HIV-positive women for cluster-of-differentiation-4 cell count, interferon gamma release assay and tuberculosis lateral flow urine lipoarabinomannan tests.
RESULTS: We enrolled 990 women; 52% were pregnant and 47% were HIV-positive. The prevalence of tuberculosis among HIV-positive pregnant women was 5% (95% confidence interval [CI]: 2-7) and among postpartum women it was 1% (95%CI: -1-3). Tuberculosis prevalence was 2% (95%CI: 0-3) in HIV-negative pregnant women and 1% (95%CI: -1-2) in HIV-negative postpartum women. The national tuberculosis symptom screening tool failed to identify women who tested tuberculosis-culture positive.
CONCLUSION: Routine tuberculosis symptom screening alone is insufficient to rule out tuberculosis in pregnant and postpartum women. Only sputum culture maximised the detection of tuberculosis, indicating a need to balance access and cost in developing countries
Keywords: Tuberculosis; pregnant women; postpartum women; tuberculosis screening; tuberculosis diagnosis; HIV; Eswatini.
Introduction
There has been a major decline in maternal mortality over the past two decades.1 However, pregnancy poses several challenges to tuberculosis management because of its adverse effects on diagnosis and treatment outcomes.2,3,4 The exact burden of tuberculosis among pregnant women is undefined.5 The incidence of tuberculosis among postpartum women is unknown and difficulties with diagnosis suggest underestimation.6 In 2015, the World Health Organization (WHO) advocated for research on new diagnostic methods targeting pregnant and postpartum women including HIV-positive women7 and inexpensive tuberculosis screening algorithms for this population.8
The clinical presentation of tuberculosis may be similar to some manifestations of pregnancy, making tuberculosis diagnosis in this population difficult.6 The presence of tuberculosis during pregnancy may result in a threefold increase in adverse birth outcomes such as preterm birth, low weight at birth and foetal growth restriction.8,9 Screening for tuberculosis in women of reproductive age is imperative, because concomitant tuberculosis disease causes higher case fatality rates than in men of the same age.10
Active tuberculosis disease, especially when treated late or left untreated, is likely to result in severe adverse outcomes affecting both mother and baby,11,12,13 with an estimated 3.4-fold increase in infant mortality.14,15 The WHO has recommended three options for tuberculosis symptom screening based on availability of Xpert MTB/RIF assay, chest X-ray and also HIV status of the individual.16 The option one algorithm uses a cough lasting more than 2 weeks to screen positive, option two uses any tuberculosis symptom and option three relies on positive chest X-ray findings.16 Option two of the WHO symptom-screening algorithm gives a positive screen if a cough of any duration or any other tuberculosis symptom is evaluated.16 The national tuberculosis symptom screening tool (NTBSS) adapted option one of the WHO screening algorithm, through which individuals screen positive if there is a cough of at least 2 weeks duration,16 or a cough plus any other symptom of fever or unexplained loss of weight or night sweats, or if any two symptoms are present.16,17 Despite developments in screening and diagnosis, emerging data show that the WHO-recommended four-symptom screen may miss persons with tuberculosis disease.4 Studies on HIV-positive pregnant women found that the sensitivity of any one of the four tuberculosis symptoms was 28% in South Africa18 and 42.9% in Kenya.19
Few studies have considered the potential use of tuberculosis lateral flow urine lipoarabinomannan (LF-LAM) as an add-on to the tuberculosis screening algorithm for HIV-positive pregnant and postpartum women.20 Xpert® MTB/RIF testing has been rolled out in Eswatini and is the preferred tuberculosis diagnostic method for women. However, a study among HIV-positive pregnant women in Kenya reported Xpert® MTB/RIF sensitivity of 43% and a specificity of 100%, when compared to Mycobacterium tuberculosis culture results19 as the gold standard. Bactec MGIT 960 liquid culture has been shown to have a sensitivity and specificity of 100% and 93.3%.21
Tests for latent tuberculosis infection have shown mixed value for determining the presence of the infection.22 Existing tests for latent tuberculosis infection include the tuberculin skin test (TST) and the newer interferon-gamma release assays (IGRAs) but both have drawbacks.23,24 The limitations of the TST include low sensitivity and specificity among HIV-positive patients and possibly among pregnant women.11 Similarly, a study in Kenya using the T-SPOT TB IGRA showed a more than threefold increased risk of active tuberculosis or mortality among pregnant women who tested positive using IGRA.25
In Eswatini, tuberculosis prevalence among pregnant women is not documented. Use of the recommended WHO four-symptom screen has identified very few pregnant women with positive results.26 The objectives of this study were to determine the prevalence of bacteriologically confirmed tuberculosis among the study population of HIV-positive and HIV-negative pregnant and postpartum women and to identify effective tuberculosis screening algorithms.
Methods
Ethical considerations
Ethical approval was obtained from the Eswatini National Health Research Board (formerly Scientific and Ethics Committee [Approval reference: MH/599C]), CDC Institutional Review Board (IRB) (Reference: CGH-HSR Tracking #: 2015-196), and University Research Co. LLC IRB (02 March 2015). Participants signed informed consent written in their preferred language (SiSwati or English). Participants received no incentives but were reimbursed transport costs for additional visits to read TST. Diagnostics tests and treatment, if required, were free of out-of-pocket charges.
Study design
We conducted a cross-sectional study enrolling pregnant and postpartum women, aged 18 years and older, attending antenatal and postnatal care clinics, from 01 April to 30 November 2015 at three public health facilities in three of the four regions of Eswatini. Sociodemographic and clinical data, including past tuberculosis screening results where applicable, were collected. Eswatini is categorised by WHO as a high tuberculosis/HIV burdened country with a co-infection rate of 70% and a tuberculosis incidence rate of 398 per 100 000 population.27
Inclusion criteria
Participants were pregnant and postpartum women who were not on anti-tuberculosis treatment at enrolment or who had not taken anti-tuberculosis medicines, including isoniazid for tuberculosis preventive therapy, within the 2 months preceding enrolment, based on documented evidence from patient clinical records, and who provided informed consent. Four groups of women were enrolled: HIV-positive pregnant, HIV-negative pregnant, HIV-positive postpartum, and HIV-negative postpartum.
Study population and sample size
A sample size of 183 in each group was determined and a full narrative of sample size calculation is fully described in our protocol paper titled 'Screening in Maternity to Ascertain Tuberculosis Status (SMATS) study'.4 Participants were consecutively enrolled until the sample size was reached.
Clinical and laboratory procedures
Symptom screening
All participants were screened using the WHO-recommended national tuberculosis four-symptom screening (standard NTBSS) tool. Participants held clinic cards which were checked for evidence of tuberculosis symptom screening at their last clinical encounter to ascertain routine tuberculosis screening coverage at their previous visit. Participants were screened as positive using the standard NTBSS tool, if they had a cough lasting at least 2 weeks,16 or a cough lasting less than 2 weeks plus any other symptom of fever or unexplained loss of weight or night sweats, or if any two symptoms were present.16,17 Enhancements of the tuberculosis screening tool were done by adding to the four symptom screening tool any history of contact with a person on tuberculosis treatment or who had been diagnosed with tuberculosis and the presence of tuberculosis symptoms within the household inhabitants. We measured sensitivity, specificity and predictive values (positive and negative) of the WHO-recommended four symptom tuberculosis screening tool among HIV-positive and HIV-negative pregnant and postpartum women compared with sputum culture, the gold standard for M. tuberculosis detection.
Radiological procedures
Even though chest radiographs are not contraindicated in pregnancy, chest radiographs were only carried out among postpartum women (both HIV-positive and HIV-negative) to eliminate risk of radiation exposure to the foetus.
Specimen collection and laboratory procedures
Two samples of sputum (for Xpert® MTB/RIF, smear microscopy and culture using BACTEC TM MGIT 960) were collected from all participants.4 Sputum samples were collected through the production of spontaneous self-expectorated phlegm (preferred method), sputum induction through nebulising with hypertonic saline or, if both the above failed, the participant received a sputum container to take home and attempt to produce an early morning sputum sample and bring it back to the health facility. Testing of sputum samples was done at the National Tuberculosis Reference Laboratory in Mbabane. Tuberculosis culture was the gold standard test and in situations where sputum samples were insufficient for the three tests, culture was prioritised ahead of Xpert® MTB/RIF and smear microscopy. A urine sample for the LF-LAM test and two 4 mL blood samples for IGRA testing and cluster-of-differentiation-4 (CD4) cell count testing were collected. Interferon-gamma release assays and LF-LAM were only done for HIV-positive women due to limited evidence on IGRA use28 and existing WHO recommendations on LF-LAM use in HIV-positive individuals.29 TST was also done and the induration was read after 48 hours - 72 hours. IGRA and TST procedures were explained to all participants and only HIV-positive participants were then asked which test they preferred between IGRA and TST.
Sample collection and storage followed national standard operating procedures for urine and blood collection and manufacturer's instructions for the DetermineTM Tuberculosis LF-LAM test (Abbott Laboratories, Lake Bluff, Illinois, United States) and IGRA testing.4 All sputum specimens were analysed by means of: (1) Xpert® MTB/RIF assay (Cepheid, Sunnyvale, California, United States), (2) concentrated Ziehl-Neelsen microscopy, (3) liquid-medium culture method (BACTECTM MGIT 960TM TB Diagnostic System; Becton, Dickinson & Company [BD], Crystal Lake, New Jersey, United States), and (4) MGIT 960TM DST (BD, Crystal Lake, New Jersey, United States). Positive cultures were identified as M. tuberculosis using the tuberculosis Ag MPT64 Rapid® assay (Standard Diagnostics, Inc., Yongin, South Korea).30 Interferon-gamma release assays and CD4 cell count testing were done at Lancet Laboratory in Johannesburg, South Africa. IGRA blood specimens were collected directly into IGRA tubes used for QuantiFERON-TB Gold in-Tube assay (Cellestis Ltd, Carnegie, Victoria, Australia).31,32 CD4 cell count tests were conducted by BD FACSCalibur™ flow cytometry (BD Biosciences, San Jose, California, United States) using venous blood collected in sterile four millilitre BD Vacutainer EDTA tubes by trained study nurses.
Data management and data analysis
Data collection
The data collection tools were matched to the tools used for routine data collection at health facilities. Demographic fields in the data collection forms were adapted from client cards. Data fields for tuberculosis symptom screening were adapted from the national tuberculosis screening tool. Patient information was anonymised.
Data analysis
Data were entered in Epi Info™ (Centers for Disease Control and Prevention, Atlanta, Georgia, United States) and Research Electronic Data Capture (REDCap; Vanderbilt University, Nashville, Tennessee, United States), and data extraction tools were cross-checked to validate conflicting fields. Laboratory results were compared with the electronic study results file generated from the laboratory, and participant identity numbers were used to relate the data. We evaluated both option one and option two of the WHO four symptom screening algorithms. TST numeric readings were recoded as positive, if the length of the induration was ≥ 5 mm for HIV-positive participants or ≥ 10 mm, if the participant was HIV-negative.32,33 All other lengths, including 0 mm, were recoded as negative according to existing literature and CDC guidance on interpretation of TST results.32,33 IGRA was done at a private laboratory according to manufacturer's recommendations and the differences in readings between QuantiFERON-tuberculosis Gold in-Tube tuberculosis antigen, tuberculosis nil and tuberculosis mitogen were used to interpret positive, negative and indeterminate results, respectively (Figure 1).34

Frequencies and proportions were used to describe participant characteristics and related clinical data. Diagnostic parameters of sensitivity, specificity and positive and negative predictive values analyses for tuberculosis symptoms, and tuberculosis diagnostic tests were calculated in STATA version 13 (© 1985-2013 StataCorp LLC, College Station, Texas, United States). Using logistic regression, associations between culture-positive tuberculosis and HIV status and pregnancy or postpartum status variables were determined. Other sociodemographic and clinical factors were considered for inclusion in the multivariate model if the p-value was ≤ 0.1 on bivariate analysis. Factors that perfectly predicted the outcome were excluded. Estimates were reported with 95% confidence intervals (CIs) and corresponding p-values.
Results
Description of study participants
Of the 990 women who were enrolled, 516 (52%) were pregnant: 101 (10%) in first trimester, 219 (22%) in second trimester and 196 (20%) in third trimester (Figure 2). The remaining 474 (48%) were all postpartum women. Among the participants, 470 (47%) were HIV-positive and, among them, 434 (92%) were on antiretroviral therapy.
Most women (790, 80%) had secondary or tertiary education, and 300 (30%) were in formal employment (Table 1). The median household density (number of people per room within household) was 1.5 (interquartile range: 1-2 people per room). The median age was 26 (interquartile range: 22-31) years.
Tuberculosis screening and sputum collection
Of the 990 participants screened, 48 (5%) screened positive for tuberculosis using the NTBSS tool. There were 181 (18%) with at least one tuberculosis symptom (Table 1). Participants who screened positive for specific tuberculosis symptoms included 103 (10%) with a cough of any duration, 38 (4%) with night sweats, 29 (3%) with fever and 48 (5%) with weight loss. Among 516 pregnant women, 433 (84%) were screened for tuberculosis at their last clinical encounter compared with 283 (60%) of the 474 postpartum women. In 531 (54%) patients, sputum collection was spontaneous, 158 (16%) by induction and 87 (9%) as early morning samples. However, 214 (22%) participants failed to produce sputum using any of the three methods. In total, 776 (78%) participants produced sputum samples and 758 (98%) had samples available for culture testing and 704 (93%) had valid culture results. However, only 361 (47%) had sputum samples available for Xpert® MTB/RIF testing and Xpert® MTB/RIF results were available for 361 (100%) participants, although 18 (5%) of those with Xpert® MTB/RIF results had no culture results for comparison.
Prevalence of tuberculosis
Tuberculosis status was either bacteriologically confirmed or ruled out by culture testing in 704 (93%) participants who had sputum samples available for culture. The overall prevalence of tuberculosis in this cohort of pregnant and postpartum women was 2% (95% CI: 1-3) (Table 2). M. tuberculosis was found in 15 (2%) participants and 12 (80%) were pregnant. The prevalence of tuberculosis among pregnant women was 3% (95% CI: 1-5) compared to 1% (95% CI: 0-2) in postpartum women. The prevalence of tuberculosis among those who were HIV-negative was 1% (95% CI: 0-2) compared to a prevalence of 3% (95% CI: 1-5) among those who were HIV-positive (Table 2).
Acceptability of tuberculosis skin test and interferon-gamma release assay
A total of 450 participants chose between TST and IGRA as their preferred test method. Of this number, 277 (62%) chose TST as the preferred method compared to 173 (38%) for IGRA (data not shown in tables). Among the 540 with no decision on preferred method, 512 (95%) were not sure, and 28 (5%) chose not to respond to the question. Tuberculin skin tests were done on 961 (97%) participants, of which 659 (69%) came back for reading within 48 h - 78 h, whereas 302 (31%) were lost to follow-up. Of the 659 participants who had TST results, 237 (36%) were TST-positive. IGRAs were done on 465 HIV-positive participants. Of the 465 IGRA results, 153 (33%) were positive, 273 (59%) negative, 23 (5%) indeterminate and 16 (3%) were missing.
Performance of tuberculosis screening and diagnostic tests
The standard NTBSS tool failed to identify women with tuberculosis disease with a sensitivity of 0% (95% CI: 0-29) among HIV-positive and 0% (90% CI: 0-60) among HIV-negative participants (Table 3). The enhanced screening tool, by including history of contact with a person with tuberculosis or presence of tuberculosis symptoms within the household of the participant, did not improve the sensitivity of the standard NTBSS tool. Only the inclusion of a tuberculosis contact history significantly improved the sensitivity of the algorithm to 18% among HIV-positive women, although specificity decreased from 94% to 62%.
M. tuberculosis was detected in two (1%) of the 361 Xpert MTB/RIF results, and no rifampicin resistance was detected in either one. No M. tuberculosis was detected in the remaining 359 (99%) samples. Sputum smear microscopy was done on 724 (73%) participants, and 4 (1%) had acid-alcohol-fast bacilli. LF-LAM was done on 411 (87%) participants and 327 (80%) had culture results. When compared to culture, the sensitivity of both the tuberculosis screening and the tuberculosis diagnostic tests were less than 50% in both HIV-positive and HIV-negative women (Table 3).
Association between socio-demographic and clinical covariates and tuberculosis culture diagnostic algorithm
Specific algorithms could not be analysed due to the missing data of tests used to construct the different algorithms, as well as low prevalence of tuberculosis symptoms among our study participants. The study showed that those who were HIV-positive had a threefold risk of culture-positive tuberculosis compared to HIV-negative individuals (odds ratio = 3.23; 95% CI: 1.00-10.40, p = 0.05) (Table 4). Those residing in the Central region (odds ratio = 0.08; 95% CI: 0.01-0.61, p = 0.015) and Southern region (odds radio = 0.19; 95% CI: 0.04-0.89, p = 0.035) were independently less likely to have culture-positive tuberculosis compared to the northern region (reference region) and (Table 4).

Discussion
Summary of key findings
According to our review, this is a unique study in this setting to determine the burden of tuberculosis among pregnant and postpartum women regardless of the presence of tuberculosis symptoms. We observed that higher proportions of pregnant women (84%) were previously screened for tuberculosis during their last clinic visit prior to enrolment compared to postpartum women (60%). However, these were lower than the universal screening (99%) reported among people living with HIV attending antiretroviral therapy clinics in Eswatini.35
Even though 80% of participants who were confirmed to have tuberculosis disease were pregnant, there were no statistical differences between the prevalence of tuberculosis in pregnant and postpartum women. The highest prevalence of tuberculosis was among HIV-positive pregnant women (5%), which is comparable to the 3.3% observed in neighbouring South Africa.11 Although 93% of participants who were found to have active tuberculosis reported no tuberculosis symptoms, there were no differences in tuberculosis prevalence between those reporting symptoms and those with no symptoms. A study conducted in South Africa found a higher tuberculosis prevalence among patients who did not report symptoms of tuberculosis.18 A study from Ethiopia did not find any person with active tuberculosis disease among pregnant women but did not test for tuberculosis among those who did not have tuberculosis symptoms.36 This has significant public health implications for tuberculosis control, considering previous reports that asymptomatic patients with culture-positive tuberculosis can transmit tuberculosis.18
The WHO four-symptom NTBSS screening tool failed to identify women with active tuberculosis disease, as the majority of women with confirmed tuberculosis disease did not have symptoms of tuberculosis. Almost a third of participants who had a TST done did not have results, because participants did not come back within the stipulated time for reading, despite the provision of transport imbursements for additional visits for TST reading.
Pregnancy is known to suppress the T1-helper pro-inflammatory response, resulting in masking of tuberculosis symptoms and increased susceptibility to M. tuberculosis reactivation8 and primary infection with M. tuberculosis.37 Women are unlikely to show typical symptoms like sweating at night and fever, and these are further masked by pregnancy.8,17 Weight loss can be masked by physiological changes during pregnancy.18 The low sensitivity of the tuberculosis screening tool has been reported in many other studies.18,19,38,39 Adapting the screening tool to include a history of tuberculosis contact as an independent indicator of positive tuberculosis screen improved sensitivity by 18% but only in HIV-positive women. This sensitivity (18%) is still too low for effective tuberculosis case finding and ruling out tuberculosis among pregnant and postpartum women. LaCourse et al.19 also showed poor performance of the four-symptom screening tool in HIV-positive pregnant women in Kenya. Tuberculosis diagnosis in pregnancy is often delayed due to atypical symptoms.11,39,40 Culture prevailed as the reliable gold standard to diagnose tuberculosis; some authors recommend that it should be mandatory for establishing tuberculosis diagnosis in this group.11,39
A false-negative symptom screening, which is the initial screening method for triaging for tuberculosis diagnostic testing, will often lead to a delay in diagnosis and treatment of active tuberculosis and consequently poor foetal and maternal outcomes.17 A false-positive screening result leads to inconvenient and costly laboratory procedures.17 However, the routine symptom screening tool had high negative predictive values (97% - 99%), which supports its utility in identifying people who are unlikely to have tuberculosis, especially people living with HIV. Therefore, those who screen negative with the standard NTBSS tool and are at high risk of progressing from latent tuberculosis to active tuberculosis can be given tuberculosis preventive therapy in this setting of high HIV-tuberculosis burden.39,41
We demonstrated that TST had poor performance when used as a screening method for exposure to tuberculosis and its feasibility is further challenged by a third of participants who were lost to follow-up for a reading of skin reaction. However, alternative follow-up methods, including home visits, should be included to complete the TST readings. IGRA was a less preferred screening method compared to TST, possibly due to the need for blood draw. In addition, IGRA demands laboratory infrastructure42 compared to TST and is currently available only in private laboratories in this setting.
Strengths and limitations
We considered it a strength that our methodology included participants who did not have the usual symptoms of tuberculosis, minimising the risk of under-reporting of true tuberculosis prevalence in this study population.39,43 We also induced sputum in women unable to produce sputum spontaneously, thus maximising the tuberculosis diagnostic yield.19 In addition to symptom screening, we attempted five tuberculosis tests for all participants.
We had planned to test 10 different algorithms using different testing combinations and ordering of individual diagnostic tests. However, given the low agreement, the low number of positives, and the poor performance of the WHO symptom screening tool (several of the algorithms began with the WHO symptom screening), the analysis was of no utility, and we did not include these results in this report. Although unintended by the study design, more than half of the participants did not have an Xpert® MTB/RIF assay done, which is a near point-of-care test that allows results to be quickly available (as early as 2 h) to clients and service providers, leading to a quick clinical management decision, unlike culture which may take several weeks.
Conclusion
The four-symptom screening tool appears likely to miss women with active tuberculosis. Without sensitive, symptom-based tuberculosis screening in this subpopulation, a high index of suspicion of tuberculosis is necessary and factors such as a history of tuberculosis contact should prompt clinicians to consider tuberculosis in their differential diagnosis, especially in a setting of high HIV- tuberculosis burden. Bold, deliberate decisions to invest in laboratory-based, quality-assured culture testing are required to maximise detection of people who have active tuberculosis disease in countries with a high HIV- tuberculosis burden in order to end tuberculosis by 2035 as envisaged by the WHO's End TB Strategy.44 However, the feasibility of increasing access to culture in this setting is confronted by costs related to culture testing, transportation, specimen storage and lengthy waiting periods for culture results by clinicians and patients. Therefore, low-income and middle-income countries should strike the right balance to ensure access to culture for those who could benefit from culture and availability of the newer, more sensitive Xpert® MTB/RIF Ultra platform for rapid tuberculosis diagnosis.
Prevalence of tuberculosis was particularly high (4.5%) among HIV-positive pregnant women and low (0.6%) among HIV-negative postpartum women. Although we were unable to test different tuberculosis screening algorithms, the poor performance of the standard NTBSS tool that serves as the entry to tuberculosis services highlights the challenge of diagnosing tuberculosis in pregnant and postpartum women.
Acknowledgements
The authors thank Ministry of Health staff from participating health facilities and colleagues from University Research Co. LLC Eswatini: Marianne Calnan, Sandile Ginindza and Rosanna Jeffries, and Lani Marquez from University Research Co. LLC - Center for Human Services. We also thank Munamato Mirira from USAID Eswatini, Sikhathele Mazibuko and Peter Preko from CDC Eswatini, and Surbhi Modi from CDC Atlanta for their support during the development of the protocol.
Competing interests
The authors have declared that no competing interests exist.
Authors' contributions
M.P. contributed to the conception of the study, implementation, analysis, interpretation of results, drafting and critical review of intellectual content, and final approval of the manuscript. E.B. contributed to the conception of the study, implementation and analysis, interpretation of results, drafting and critical review of intellectual content and final approval of the manuscript. M.M. contributed to the analysis, interpretation of results, drafting and critical review of intellectual content and final approval of the manuscript. G.M. contributed to the conception of the study, implementation, critical review of intellectual content and final approval of the manuscript. B.S.-V. contributed to the conception of the study, implementation, critical review of intellectual content and final approval of the manuscript. S.H. contributed to the conception of the study, implementation, analysis, interpretation of results, drafting and critical review of intellectual content, and final approval of the manuscript. All of the authors agreed to be accountable for all aspects of the work, including accuracy and integrity.
Sources of support
Support for this study was provided by the American people through the United States Agency for International Development (USAID) Applying Science to Strengthen and Improve Systems Project, managed by University Research Co., LLC under the terms of Cooperative Agreement Number AID-OAA-A-12-00101. Funding for this study of tuberculosis diagnosis in Eswatini was provided by the US President's Emergency Plan for AIDS Relief (PEPFAR) through USAID.
Data availability statement
Data sharing is not applicable to this article as no new data were created or analysed in this study.
Disclaimer
The views expressed in this article are views of the authors and not an official position of the authors' institutions or funder.
References
1.Carvajal-Aguirre L, Amouzou A, Mehra V, Ziqi M, Zaka N, Newby H. Gap between contact and content in maternal and newborn care: An analysis of data from 20 countries in sub-Saharan Africa. J Global Health. 2017;7(2):020501. https://doi.org/10.7189/jogh.07.020501 [ Links ]
2.Sugarman J, Colvin C, Moran AC, Oxlade O. Tuberculosis in pregnancy: An estimate of the global burden of disease. Lancet Global Health. 2014;2(12):e710-e716. https://doi.org/10.1016/S2214-109X(14)70330-4 [ Links ]
3.Albugami M, Tashkandi A, AlRashed A. Difficulties in diagnosing tuberculosis in pregnancy. Ann Saudi Med. 2009;29(2):154. https://doi.org/10.4103/0256-4947.51804 [ Links ]
4.Broughton E, Haumba S, Calnan M, et al. Screening in maternity to ascertain tuberculosis status (SMATS) study. BMC Infect Dis. 2017;17(1):191. https://doi.org/10.1186/s12879-017-2285-0 [ Links ]
5.Zumla A, Bates M, Mwaba P. The neglected global burden of tuberculosis in pregnancy. Lancet Global Health. 2014;2(12):e675-e676. https://doi.org/10.1016/S2214-109X(14)70338-9 [ Links ]
6.Loto OM, Awowole I. Tuberculosis in pregnancy: A review. J Pregnancy. 2012;2012:379271. https://doi.org/10.1155/2012/379271 [ Links ]
7.World Health Organization. Tuberculosis in women [homepage on the Internet]: WHO; 2015 [cited 2019 Apr 12]. Available from: http://www.who.int/tb/publications/tb_women_factsheet_251013.pdf [ Links ]
8.Mathad JS, Gupta A. Tuberculosis in pregnant and postpartum women: Epidemiology, management, and research gaps. Clin Infect Dis. 2012;55(11):1532-1549. https://doi.org/10.1093/cid/cis732 [ Links ]
9.Salazar-Austin N, Hoffmann J, Cohn S, et al. Poor obstetric and infant outcomes in human immunodeficiency virus-infected pregnant women with tuberculosis in South Africa: The Tshepiso study. Clin Infect Dis. 2017;66(6):921-929. https://doi.org/10.1093/cid/cix851 [ Links ]
10.World Health Organization: Department of Gender and Women's Health. Gender and tuberculosis [homepage on the Internet]. Geneva: WHO; 2002 [cited 2019 Apr 12]. Available from: http://apps.who.int/iris/bitstream/10665/68891/1/a85584.pdf [ Links ]
11.Nguyen HT, Pandolfini C, Chiodini P, Bonati M. Tuberculosis care for pregnant women: A systematic review. BMC Infect Dis. 2014;14(1):617. https://doi.org/10.1186/s12879-014-0617-x [ Links ]
12.Bergeron K, Bonebrake R, Allen C, Gray C. Latent tuberculosis in pregnancy: Screening and treatment. Curr Womens Health Rep. 2003;3(4):303-308. [ Links ]
13.Nhan-Chang C-L, Jones TB. Tuberculosis in pregnancy. Clin Obstet Gynecol. 2010;53(2):311-321. https://doi.org/10.1097/GRF.0b013e3181de8a13 [ Links ]
14.Figueroa-Damián R, Arredondo-Garcı́a JL. Neonatal outcome of children born to women with tuberculosis. Arch Med Res. 2001;32(1):66-69. https://doi.org/10.1016/S0188-4409(00)00266-6 [ Links ]
15.Gupta A, Nayak U, Ram M, et al. Postpartum tuberculosis incidence and mortality among HIV-infected women and their infants in Pune, India, 2002-2005. Clin Infect Dis. 2007;45(2):241-249. https://doi.org/10.1086/518974 [ Links ]
16.World Health Organization. Systematic screening for active tuberculosis: Principles and recommendations [homepage on the Internet]. Geneva: WHO; 2013 [cited 2019 Apr 12]. Available from: https://apps.who.int/iris/bitstream/handle/10665/84971/9789241548601 _eng.pdf;jsessionid=9CE4709469ABA85E12DA7CAED5B75DF5?sequence=1 [ Links ]
17.LaCourse SM, Cranmer LM, Bekker A, et al. Symptom screening for active tuberculosis in pregnant women living with HIV. Cochrane Database Syst Rev. 2018;2018(1):CD012934. https://doi.org/10.1002/14651858.CD012934 [ Links ]
18.Hoffmann CJ, Variava E, Rakgokong M, et al. High prevalence of pulmonary tuberculosis but low sensitivity of symptom screening among HIV-infected pregnant women in South Africa. PLoS One. 2013;8(4):e62211. https://doi.org/10.1371/journal.pone.0062211 [ Links ]
19.LaCourse SM, Cranmer LM, Matemo D, et al. Tuberculosis case finding in HIV-infected pregnant women in Kenya reveals poor performance of symptom screening and rapid diagnostic tests. J Acquir Immune Defic Syndr. 2016;71(2):219-227. https://doi.org/10.1097/QAI.0000000000000826 [ Links ]
20.Minion J, Leung E, Talbot E, Dheda K, Pai M, Menzies D. Diagnosing tuberculosis with urine lipoarabinomannan: Systematic review and meta-analysis. Eur Respir J. 2011;38(6):1398-1405. https://doi.org/10.1183/09031936.00025711 [ Links ]
21.Hasan M, Munshi SK, Momi MSB, Rahman F, Noor R. Evaluation of the effectiveness of BACTEC MGIT 960 for the detection of mycobacteria in Bangladesh. Int J Mycobacteriol. 2013;2(4):214-219. https://doi.org/10.1016/j.ijmyco.2013.09.001 [ Links ]
22.Borkowska DI, Napiorkowska AM, Brzezinska SA, Kozinska M, Zabost AT, Augustynowicz-Kopec E. From latent tuberculosis infection to tuberculosis. News in diagnostics (QuantiFERON-Plus). Pol J Microbiol. 2017;66:5-8. https://doi.org/10.5604/17331331.1234987 [ Links ]
23.Scrivo R, Sauzullo I, Mengoni F, et al. The role of interferon-gamma release assays in predicting the emergence of active tuberculosis in the setting of biological treatment: A case report and review of the literature. Clin Rheumatol. 2016;35(5):1383-1388. https://doi.org/10.1007/s10067-014-2669-0 [ Links ]
24.Winthrop KL, Weinblatt ME, Daley CL. You can't always get what you want, but if you try sometimes (with two tests - TST and IGRA - for tuberculosis) you get what you need. Ann Rheum Dis. 2012;71(11):1757-60. https://doi.org/10.1136/annrheumdis-2012-201979 [ Links ]
25.Jonnalagadda S, Payne BL, Brown E, et al. Latent tuberculosis detection by interferon γ release assay during pregnancy predicts active tuberculosis and mortality in human immunodeficiency virus type 1-infected women and their children. J Infect Dis. 2010;202(12):1826-1835. https://doi.org/10.1086/657411 [ Links ]
26.World Health Organization. Global tuberculosis report 2016 [homepage on the Internet]. Geneva: WHO; 2016 [cited 2019 Apr 12]. Available from: http://apps.who.int/medicinedocs/documents/s23098en/s23098en.pdf [ Links ]
27.World Health Organization. Swaziland tuberculosis profile [homepage on the Internet]: WHO; 2016 [cited 2019 Apr 12]. Available from: https://extranet.who.int/sree/Reports?op=Replet&name=%2FWHO_HQ_Reports%2FG2 %2FPROD%2FEXT%2FTBCountryProfile&ISO2=SZ&LAN=EN&outtype=html [ Links ]
28.World Health Organization. Use of tuberculosis interferon-gamma release assays (IGRAs) in low- and middle-income countries: Policy statement [homepage on the Internet]. Geneva: WHO; 2011 [cited 2020 Jan 31]. Available from: https://apps.who.int/iris/bitstream/handle/10665/44759/9789241502672_eng.pdf;jses sionid=AB70D995ACDE3C0C1B108048E5E2D16E?sequence=1 [ Links ]
29.World Health Organization. The use of lateral flow urine lipoarabinomannan assay (LF-LAM) for the diagnosis and screening of active tuberculosis in people living with HIV. Policy guidance [homepage on the Internet]. Geneva: WHO; 2015 [cited 2020 Jan 31]. Available from: https://www.who.int/tb/areas-of-work/laboratory/policy_statement_lam_web.pdf [ Links ]
30.Le Palud P, Cattoir V, Malbruny B, et al. Retrospective observational study of diagnostic accuracy of the Xpert® MTB/RIF assay on fiberoptic bronchoscopy sampling for early diagnosis of smear-negative or sputum-scarce patients with suspected tuberculosis. BMC Pulm Med. 2014;14(1):137. https://doi.org/10.1186/1471-2466-14-137 [ Links ]
31.Slater M, Parsonnet J, Banaei N. Investigation of false-positive results given by the QuantiFERON-TB gold in-tube assay. J Clin Microbiol. 2012;50(9):3105-3107. https://doi.org/10.1128/JCM.00730-12 [ Links ]
32.Nayak S, Acharjya B. Mantoux test and its interpretation. Indian Dermatol Online J. 2012;3(1):2. https://doi.org/10.4103/2229-5178.93479 [ Links ]
33.CDC. Mantoux tuberculin skin test [homepage on the Internet] [cited 2019 Apr 12]. Available from: https://www.cdc.gov/tb/publications/posters/images/Mantoux_wallchart.pdf [ Links ]
34.Qiagen. QuantiFERON®-TB gold (QFT®) ELISA package Insert [homepage on the Internet] [cited 2019 Aug 28]. Available from: http://www.quantiferon.com/wp-content/uploads/2017/04/English_QFT_ELISA_R04_082016.pdf [ Links ]
35.Ministry of Health - Swaziland. Monitoring and evaluation unit. HIV program annual report. Mbabane: Strategic Information Department; 2016. [ Links ]
36.Gebreegziabiher D, Adane K, Abebe M. A survey on undiagnosed active pulmonary tuberculosis among pregnant mothers in Mekelle and surrounding districts in Tigray, Ethiopia. Int J Mycobacteriol. 2017;6(1):43. https://doi.org/10.4103/2212-5531.201889 [ Links ]
37.Rai Y, Mahor A, Kaur R, Dhaka G, Shaweny A. Tuberculous peritonitis in pregnancy: Case report. Int J Curr Microbiol Appl Sci. 2017;6(3):1609-1611. https://doi.org/10.20546/ijcmas.2017.603.185 [ Links ]
38.Bekker A, Schaaf HS, Draper HR, Kriel M, Hesseling AC. Tuberculosis disease during pregnancy and treatment outcomes in HIV-infected and uninfected women at a referral hospital in Cape Town. PLoS One. 2016;11(11):e0164249. https://doi.org/10.1371/journal.pone.0164249 [ Links ]
39.Gupta A, Chandrasekhar A, Gupte N, et al. Symptom screening among HIV-infected pregnant women is acceptable and has high negative predictive value for active tuberculosis. Clin Infect Dis. 2011;53(10):1015-1018. https://doi.org/10.1093/cid/cir605 [ Links ]
40.Kothari A, Mahadevan N, Girling J. Tuberculosis and pregnancy - Results of a study in a high prevalence area in London. Eur J Obstet Gynecol Reprod Biol. 2006;126(1):48-55. https://doi.org/10.1016/j.ejogrb.2005.07.025 [ Links ]
41.Cain KP, McCarthy KD, Heilig CM, et al. An algorithm for tuberculosis screening and diagnosis in people with HIV. New Engl J Med. 2010;362(8):707-716. https://doi.org/10.1056/NEJMoa0907488 [ Links ]
42.Linas BP, Wong AY, Freedberg KA, Horsburgh Jr CR. Priorities for screening and treatment of latent tuberculosis infection in the United States. Am J Respir Crit Care Med. 2011;184(5):590-601. https://doi.org/10.1164/rccm.201101-0181OC [ Links ]
43.Gounder CR, Wada NI, Kensler C, et al. Active tuberculosis case-finding among pregnant women presenting to antenatal clinics in Soweto, South Africa. J Acquir Immune Defic Syndr. 2011;57(4):e77-e84. https://doi.org/10.1097/QAI.0b013e31821ac9c1 [ Links ]
44.World Health Organization. The end TB strategy [homepage on the Internet]. Geneva: WHO; 2015 [cited 2019 Apr 12]. Available from: http://www.who.int/tb/End-TB_brochure.pdf?ua=1 [ Links ]
Correspondence:
Munyaradzi Pasipamire
munyapassy@yahoo.com
Received: 19 May 2018
Accepted: 17 Apr. 2020
Published: 30 July 2020
ORIGINAL RESEARCH
Prevalence of urinary schistosomiasis amongst primary school children in Ikwo and Ohaukwu Communities of Ebonyi State, Nigeria
Nse O. UmohI; Chimezie F. NwaminiI; Nyoho J. InyangII; Anthony N. UmoIII; Victor U. UsangaI; Amos NworieI; Michael O. ElomI; Boniface N. UkwahI
IDepartment of Medical Laboratory Science, Faculty of Health Sciences and Technology, Ebonyi State University, Abakaliki, Nigeria
IIDepartment of Medical Laboratory Science, Faculty of Basic Medical Sciences, Ambrose Alli University, Ekpoma, Nigeria
IIIDepartment of Medical Microbiology and Parasitology, College of Health Sciences, University of Uyo, Uyo, Nigeria
ABSTRACT
BACKGROUND: Urinary schistosomiasis is a serious public health challenge in some communities of Ebonyi State, south-east Nigeria, partly resulting from a lack of adequate epidemiological data for the institution of effective control strategies.
OBJECTIVE: This study evaluated the prevalence and risk factors of urinary schistosomiasis in rural communities of Ebonyi State, south-east Nigeria.
METHODS: A total of 300 students, comprising 185 boys and 115 girls, were randomly selected for the study between July and December 2016. A questionnaire was administered to all participants to determine the risk factors for the disease in the area. Urine specimens collected from the participants were processed by sedimentation and examined microscopically for the eggs of Schistosoma haematobium.
RESULTS: The overall prevalence rate for urinary schistosomiasis was 8.0%. Students aged 6-10 years had the highest prevalence of infection (10.3%). The prevalence was significantly higher amongst male students (10.3%; p = 0.038) compared with female students (4.4%). Logistic regression analysis showed a significant association between schistosomiasis infection and freshwater contact activities (p = 0.007; odds ratio = 1.89; 95% confidence interval: 4.33-16.17). Contact with stream, pond, river and well water were associated with infection rates of 25%, 14%, 5.3%, and 4.4%, respectively.
CONCLUSION: A relatively low prevalence of urinary schistosomiasis was found in the area. Participants' socio-economic status and dependence on contaminated water sources were core modifiable risk factors. Health education and development of potable water infrastructure, amongst other interventions, would likely reduce the burden and transmission of urinary schistosomiasis in this locality.
Keywords: urinary schistosomiasis; transmission; prevalence; Ebonyi State; Nigeria.
Introduction
Urinary schistosomiasis is a parasitic disease of the tropics and sub-tropics caused by infection of humans with the trematode (parasitic flatworm) known as Schistosoma haematobium. Although highly preventable, the disease ranks second only to malaria in terms of prevalence and socio-economic importance of parasitic diseases in endemic tropical and subtropical countries.1,2,3 Schistosomiasis remains a challenging disease of public health importance, with approximately 779 million people estimated in 2008 to be at risk globally.4 Worldwide, Nigeria has the highest prevalence of urinary schistosomiasis, with about 29 million cases and about 101 million people at risk of infection in 2010.5,6,7 The high prevalence of urinary schistosomiasis in Nigeria has been ascribed mainly to the wide distribution of Bulinus spp., the snail host of S. haematobium, and the indiscriminate passage of urine harbouring S. haematobium eggs by infected individuals into water lodging the snail host.8,9 Several factors, including poor sanitation, poverty, ignorance, limited access and availability of health facilities and social amenities, also account for the high prevalence of urinary schistosomiasis in developing countries.10 Human infection results when man comes into contact with water harbouring the infective stage of the parasites, the free-swimming cercariae, which have the capability of directly penetrating the water-softened, intact skin of humans who are carrying out water-related activities, such as fishing, laundry, bathing and swimming.11,12 The presence of the intermediate snail hosts of the parasite and increased human contact with contaminated water bodies are the key determining factors that favour the transmission of the disease. People at maximum risk are those who live in, or travel to, endemic areas and make contact with water containing the intermediate host.8 Children are usually prone to acquiring urinary schistosomiasis, because of a strong tendency for playing in water, which predisposes them to infection.10
Early detection of the parasite in infected persons is key to the control and prevention of the disease, particularly with praziquantel therapy.13 Parasitological diagnosis involving microscopic examination of urine for the parasite eggs is the most practical and widely-used method for detecting infected individuals;14 however, immunoserological diagnosis involving detection of the parasite antigens and antibodies with techniques such as an enzyme-linked immunosorbent assay have been reported to be very efficient, especially in early infections.15
School-age children constitute an ideal target group for investigation of urinary schistosomiasis in endemic communities, because of their known habits of poor hygiene and playing in water, which enhance the chances of infection with the parasites. The data generated from this age group have proven valuable, not only for justifying their inclusion in mass treatment programmes, but also for determining the need for such interventions.10,16 Urinary schistosomiasis is a serious public health challenge in some communities of Ebonyi State, south-east Nigeria.17 In order to provide a contemporary roadmap for establishing suitable prevention and control strategies, this study evaluated the prevalence and risk factors of the disease in some rural communities of the area.
Methodology
Ethical considerations
Ethical approval for this study (FHST/EC/28) was obtained from the Ethical Committee, Faculty of Health Sciences and Technology, Ebonyi State University, Abakaliki (EBSU/2016/51032).
Study population
The participants of this cross-sectional study, conducted between July 2016 and December 2016, were selected by simple random sampling (with the aid of a Random Number Table) from amongst students of six primary schools in the Ikwo and Ohaukwu Local Government Areas (LGAs), following official authorisation by both Councils. Out of 348 pupils initially recruited from both LGAs (Ikwo, n = 186, Ohaukwu, n = 162), a total of 300 students, comprising 185 boys and 115 girls, aged between 5 and 15 years, participated in this study based on the inclusion requirements of written consent, completed questionnaire, and submission of urine specimens. A signed or thumb-printed written consent for voluntary participation of each student was obtained from a parent or guardian. Parents and guardians were informed that participants' information would be treated with utmost confidentiality and used for the purpose of the research only before giving consent. They were also informed of the potential health and social benefits of the study. To protect the participants' information, personal and quasi identifiers (such as occupation of the parents) were masked with numbers and letters, respectively. The sample size was determined using the formula described by Charan and Biswas18 for cross-sectional studies.
Study area
This study was carried out in Ohaukwu and Ikwo LGAs of Ebonyi State, south-east Nigeria. Ohaukwu LGA is located at latitude 6°31'58.3"N and longitude 8°1'22.9"E (central part) of Ebonyi State and has an area of about 517 km2, with an estimated population of about 195 337, whereas Ikwo LGA is located at latitude 6°4'59"N and longitude 8°5'59"E (northern part) of Ebonyi State and has an area of about 500 km2, with a population of about 214 969.19 The two LGAs are separated from each other by a distance of about 30 km.
This area has a typical tropical climate, comprising dry and wet seasons, with an annual average rainfall of 1300 mm and an atmospheric temperature of about 30 °C; the vegetation characteristics are predominantly guinea savannah. The area is made up of several rural communities traversed by streams and rivers, which constitute the inhabitants' major source of water for domestic use, recreation and economic activities, particularly in the absence of pipe-borne water and other social amenities. It is mostly inhabited by peasant and subsistence farmers, whose activities have an important bearing on the ecology of the area. Rice farming, mainly in swampy terrains, is the major occupation in the area.
Administration of questionnaire and collection of samples
A questionnaire titled 'Investigation of risk factors associated with the transmission of urinary schistiosomiasis in Ikwo and Ohaukwu Communities' was administered verbally to each participant, parent, or guardian by the research assistants with the generous support of school tutors, who helped in communicating effectively in the local dialect. Participants' information sought for in the questionnaire included age, residence, source(s) of water for domestic use, water contact activities, history of diseases with symptoms of haematuria, access to healthcare facilities, and the occupation and educational status of parents or guardian, amongst others.
Each participant was given a sterile dry plastic universal container with a screw lid, in which they were asked to take a terminal urine sample between 10:00 and 12:00, when the ova load is maximal.20 Each container was labeled with the sex, age and number of the participant as provided in the questionnaire form. Fresh urine samples collected were examined macroscopically for presence of blood (haematuria). The samples were then preserved by adding 5 mL of dilute (0.3%) carbol-fuchsin solution to each 10 mL of urine,21 and transported to the laboratory in an ice-pack.
Variables definition
Categorical variables were used to assess the risks factors and prevalence of urinary schistosomiasis in this study. There were six categories, namely: LGA, sex, age, occupation, water sources, and water contact activities.
Processing of samples
Microscopic examination of the urine samples for urinary schistosomiasis detection was based on detection of terminal-spine eggs of S. haematobium using a sedimentation concentration technique.18 Ten millilitres of each urine sample was collected from each sample container into a centrifuge tube and spun for 5 minutes at 3000 revolutions per minute to concentrate the eggs. Thereafter, the supernatant fluid was discarded into a Petri dish. A drop of the sediments was transferred to a clean and grease-free glass slide, covered with a coverslip and examined microscopically using x100 and x400 magnification for eggs of S. haematobium, recorded as eggs/10 mL of urine.
Statistical analysis
Cronbach's alpha was used to verify the reliability of the data obtained in this study. The prevalence values were calculated by finding the percentage of the factors. Associations between demographic characteristics (age, sex, and occupation) and the prevalence of infection were analysed using Pearson's chi-square test. Multivariate logistic regression analysis was used to evaluate the geographical and behavioural risks associated with S. haematobium infection. The geographical variables used in the analysis model included borehole, well, pond, stream and river water sources, whilst the behavioural variables comprised swimming, fishing, washing and other domestic uses. P-values of less than 0.05 were considered significant, and 95% confidence intervals were used to locate outliers.
Results
Prevalence of urinary schistosomiasis in Ohaukwu and Ikwo
Schistosoma haematobium infection was detected in 24 (8.0%) of the 300 students examined. The prevalence of infection was 10.0% (n = 150) in Ikwo LGA and 6.0% (n = 150) in Ohaukwu LGA. The difference between the prevalence of infection in Ohaukwu and Ikwo LGAs was not statistically significant (p = 0.24; Table 1).
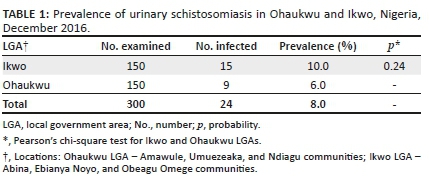
Demographic distribution of students with Schistosoma haematobium infection
The highest prevalence of infection by age was 9.4% (n = 160) amongst students aged 6-10 years. Students aged 11-15 years had a lower prevalence rate of 7.0% (n = 72), followed by those aged 1-5 years (n = 50; 6.0%), whereas students aged more than 15 years had the lowest (n = 18; 5.5%). The association between prevalence of infection and age of the participants was not statistically significant (p = 0.84; Table 2).

Of the 185 male students, 19 (10.3%) were infected with S. haematobium compared with 5 (4.3%) of the 115 female students. The impact of sex on the prevalence of infection was statistically significant (p = 0.038; Table 2).
The highest prevalence of infection by occupation (n = 128; 11.7%) was found amongst students whose parents or guardians were farmers, whilst children of public servants had the least (n = 61; 3.2%) (Table 2). A prevalence of 7.0% (n = 85) was found amongst children whose parents or guardians were traders, and 3.8% (n = 26) where the parents or guardians were fishermen. The relationship between the prevalence of infection and the occupation of parents was not statistically significant (p = 0.23; Table 2).
Association between sources of water/contact and Schistosoma haematobium infection
The highest rate of infection (n = 48; 25%) was found amongst students who utilised stream water mainly for domestic purposes. Infection rates of 14.0% (n = 50) were found amongst those that used pond water, 5.3% (n = 57) for river water, and 4.4% (n = 45) for well water. There was no case of infection amongst students who utilised water from borehole facilities; the odds of infection were about three times higher with participants who utilised freshwater sources within the locality compared with those who used borehole water, but this association was not statistically significant (p = 0.55; odds ratio = 2.77; 95% confidence interval: 7.23-22.77; Table 3).

A high infection rate of 10.5% (n = 95) was found amongst participants who engaged in swimming, compared with other activities that involved contact with freshwater sources (Table 4). Multivariate analysis showed a statistically significant association between participants' water contact activities and the prevalence of infection (p = 0.007; odds ratio = 1.89; 95% confidence interval: 4.33-16.17).

Discussion
Urinary schistosomiasis is reported to be endemic in virtually all rural regions of Nigeria, because of a widespread occurrence of ecological and socio-economic factors associated with the disease.8,9,22,23 This study confirmed the existence of urinary schistosomiasis in Ebonyi State, south-east Nigeria with a prevalence of 8.0% in the study area. This prevalence rate was low compared with previous studies in the area, which reported higher rates, 49.7% for Ohaukwu LGA and 11.0% for Onicha LGA.17 The low prevalence rate of the disease found in the present study could, firstly, be attributed to the impact of a preventive praziquantel-treatment programme, initiated by the World Health Organization in 2014, for school-aged children and special risk groups in the area.24 Secondly, development of private borehole water facilities often for commercial purposes is trending in some communities of this locality. Although not accessible or affordable to a large segment of this rural population for patronage, access to this source of water by some residents, mainly for domestic uses, may have drastically reduced the risk of contact with parasite-infested water sources. This study found a higher prevalence of infection in communities without such facilities. Based on such a finding, it would be rather surprising that the disease prevalence was lower in Ohaukwu than Ikwo LGA, which has a few communities in close proximity to infrastructural and healthcare facilities in the State capital city, Abakaliki. Access to such amenities by the inhabitants of these communities should essentially impact positively on their living conditions, with a likelihood of reducing the prevalence level of the disease. This was, however, not the case, perhaps because of a combination of factors, including poor perception of the disease transmission dynamics, and a high probability of occupation-related infections in these agrarian communities, where parents often go to rice farms in the company of their children. Nevertheless, the association between parents' occupation and the prevalence of urinary schistosomiasis in this study was not statistically significant (p = 0.235). Previous studies in some parts of Nigeria had reported high prevalence rates of 48.8% (Bauchi State), 44% (Adamawa State), 55.7% (Cross River State), and 21.5% (Ebonyi State), which were associated mainly with the predominant occupation of the indigenes, such as fishing and farming.25,26,27,28,29
In concordance with reports from many parts of Nigeria,28,30,31 this study found the influence of sex to be an important epidemiological factor in the transmission of urinary schistosomiasis, with a significantly higher prevalence of infection amongst male students compared with female students (p = 0.038). This agrees with the finding of Okoli and Odaibo32 in a previous study that attributed higher infection rates of urinary schistosomasis amongst school boys in Ibadanto to a greater involvement in outdoor activities, such as swimming, washing, paddling of canoes, and irrigation. However, persons who have greater contact with the snail breeding loci are more likely to acquire the infection, regardless of their sex.28 Most students in primary school classes are in the 6-10-year age bracket, and therefore it was not surprising that this age group had the highest prevalence of infection, perhaps on account of greater involvement in water-related activities compared with other groups, and not necessarily due to increased vulnerability. Children are generally known to be vulnerable to urinary schistosomiasis, because of their strong tendency to play in water, which predisposes them to the infection.10
Limitations
Regardless of the age or sex of students, contact with freshwater sources was a crucial factor for disease transmission, based on the pattern of infection found in this study. The prevalence of the disease was particularly high amongst children who utilised stream water for domestic and other uses, compared with other sources of water, including ponds and river. No case of infection was found amongst students who had unlimited access to borehole water. This finding is consistent with the fact that S. haematobium infection occurs only where there is contact between the population and freshwater sources harbouring the snail vector as well as the infective stage of the parasite.30 Thus, this study may have been considerably limited by an inability to examine the water sources for the snail host, and quantify the participants' water contact activities. Nonetheless, a significant association was found between infection and students' water contact activities. The zero-prevalence rate of the disease found amongst students who utilised borehole water facilities in this locality may underscore the development of infrastructure in rural communities as an important control approach for urinary schistosomiasis.
Conclusion
This study reports a low prevalence of 8.0% for urinary schistosomiasis amongst children in the study area, with a likelihood of further expansion in the disease rate and foci, if appropriate control measures are not initiated urgently by the local health authorities. Transmission of the disease in these communities is enhanced mainly by residents' dependence on unsafe sources of water for domestic use, as well as behavioural and socio-economic tendencies that promote risky contacts with potentially parasite-infested water bodies. Continued disease surveillance and selective praziquantel chemotherapy for infected persons, health education of the residents for improved perception of the behavioural and socio-economic activities associated with the disease, and development of water sources would likely improve the living conditions of this rural population with a consequent reduction in the burden and transmission of the disease. Future studies on urinary schistosomiasis in these communities should include specific analysis of the water bodies, including malacological evaluation, as well as quantification of the water contact activities of the participants.
Acknowledgements
We are grateful to the school teachers and parents of participants who helped generously in filling communication gaps during administration of our questionnaire and specimen collection.
Competing interests
The authors have declared that no competing interest exists.
Authors' contributions
N.O.U. designed the study, wrote the protocol and part of the manuscript, managed the analysis, and vetted the manuscript. C.F.N. wrote the first draft of the manuscript, managed specimen collection and carried out the laboratory analysis. M.O.E. and B.N.U. co-designed the study and supervised the laboratory analysis. N.J.I. and A.N.U. managed the statistical analyses. V.U.U. and A.N. managed the literature search and administration of the questionnaire. All authors read and approved the final manuscript.
Sources of Support
This research received no specific grant from any funding agency in the public, commercial or not-for-profit sectors.
Data availability statement
Data sharing is not applicable to this article as no new data were created or analysed in this study.
Disclaimer
The views and opinions expressed in this article are those of the authors and do not necessarily reflect the official policy or position of any affiliated agency of the authors.
References
1.Centers for Disease Control and Prevention (CDC). The burden of schistosomiasis. Atlanta, GA: CDC, Global Health Division of Parasitic Diseases and Malaria; 2011. [ Links ]
2.World Health Organization. Schistosomiasis: Progress report 2001-2011 and strategic plan 2012-2020. Geneva: World Health Organization; 2013. [ Links ]
3.Kazibwe F, Makanga B, Rubarie-Akiiki C, et al. Ecology of Biomphalaria (Gastropodapalandsidae), in Lake Albert, western Uganda. Hydrobiol. 2006;568:433-444. https://doi.org/10.1007/s10750-006-0224-y [ Links ]
4.Hotez PJ. Mass drug administration and integrated control for the world's high-prevalence neglected tropical diseases. Clin Pharm Therap. 2009;85(6):659-664. https://doi.org/10.1038/clpt.2009.16 [ Links ]
5.Hotez PJ, Kamath A. Neglected tropical diseases in sub-saharan African: Review of their prevalence, distribution and disease burden. PLoS Negl Trop Dis. 2009;3(8):412. https://doi.org/10.1371/journal.pntd.0000412 [ Links ]
6.World Health Organization. Schistosomiasis: Number of people treated in 2011. Wkly Epidemiol Rec. 2013;88:81-88. [ Links ]
7.Hotez PJ, Asojo OA, Adesina AM. Nigeria: 'Ground Zero' for the high prevalence neglected tropical diseases. PLoS Negl Trop Dis. 2012;6(7):e1600. https://doi.org/10.1371/journal.pntd.0001600 [ Links ]
8.Ejezie GC. The epidemiology and control of schistosomiasis in Africa. Niger J Med. 1991;1:29-30. [ Links ]
9.Okolie NJC. Prevalence and intensity of urinary schistosomiasis among the Abriba people of Abia State, south eastern Nigeria. IJSR. 2008;2:156-159. [ Links ]
10.World Health Organization. Schistosomiasis fact sheet [homepage on the Internet]. 2016 [cited 2017 Jul 21]. Available from: www.who.int/mediacentre/factsheets/fs115/en/ [ Links ]
11.Dalton PR, Pole D. Water contact pattern in relation to Schistosoma haematobium infection. Bull. WHO. 1978;56:417-426. [ Links ]
12.Wright CA. A note on the ecology of some molluscan intermediate hosts of Africa schistosomiasis. Ann Trop Med Parasitol. 1988;40(4):149-155. [ Links ]
13.World Health Organization. Key issues and challenges arising out of the Sixty-fifth World Health Assembly and the 130th and 131st sessions of the WHO Executive Board. Elimination of schistosomiasis (WHA65.21), Sixty-fifth Session SEA/RC65/17. Yogyakarta: World Health Organization; 2012. [ Links ]
14.Hassan SI, Talaat M, Attar GM. Evaluation of urinalysis reagent strips versus microscopical Examination of urine for Schistosoma haematobium. J Egypt Soc Parasitol. 1994;24(3):603-669. [ Links ]
15.Rabello A. Diagnosing schistosomiasis. Mem Inst Oswaldo Cruz. 1997;92(5):669-676. https://doi.org/10.1590/S0074-02761997000500021 [ Links ]
16.World Health Organization. Prevention and control of schistosomiasis and soil-transmitted Helminthiasis, report of a WHO expert committee. Technical report series Geneva: No. 912. Geneva: World Health Organization; 2002. [ Links ]
17.Uneke CJ, Oyibo PG, Ugwuoru CD, Nwanokwai AP, Iloegbunam RO. Urinary schistosomiasis among school age children in Ebonyi State, Nigeria. Internet J Lab Med. 2006;2(1):32-33. https://doi.org/10.5580/fd0 [ Links ]
18.Charan J, Biswas T. How to calculate sample size for different study designs in medical research? Indian J Psychol Med. 2013;35(2):121-126. https://doi.org/10.4103/0253-7176.116232 [ Links ]
19.Nigeria Data Portal. State population census [homepage on the Internet]. 2006 [cited 2017 Jul 21]. Available from: https://nigeria.opendataforafrica.org/ifpbxbd/state-population-2006 [ Links ]
20.World Health Organization Basic laboratory techniques in medical parasitology. WHO, 1991; p. 33-36. [ Links ]
21.Safaa E. Evaluation of the performance of preservation methods in the detection of Schistosoma haematobium ova in urine samples. Pyrex J Bio Res. 2017;3(3):21-24. [ Links ]
22.Ugbomoiko US. The prevalence, incidence and distribution of human urinary schistosomiasis in Edo State Nigeria. Nigeria J Parasitol. 2000;21:3-14. https://doi.org/10.1111/j.1467-842X.2000.tb00537.x [ Links ]
23.Agi PI, Okafor EJ. The epidemiology of Schistosoma haematobium in Odau community in the Niger Delta Area of Nigeria. J Appl Sci Environ Mgt. 2005;9(3):37-43. https://doi.org/10.4314/jasem.v9i3.17350 [ Links ]
24.Nwozaku IP. Assessment of millennium development goals in Ebonyi State: A study of some selected local government areas [homepage on the Internet]. Doctoral dissertation. Ebonyi State University, Ebonyi State; 2017 [cited 2018 Apr 24]. Available from: http://hdl.handle.net/123456789/694/html [ Links ]
25.Anosike JC, Okafor FC, Onwuliri COE. Urinary schistosomiasis in Toro Local Government Area of Bauchi State, Nigeria. Helminthologia. 1992;29(4):177-179. [ Links ]
26.Akogun OB, Sambo EA, Pahiru B. Schistosomiasis among school children in an agro industrial estate of Adamawa State, Nigeria. Nig. Soc. Parasit 18th Conference Abstract No 6; 1994. [ Links ]
27.Ekanem EE, Ejezie GC, Asindi AA, Antia-Obong OE. Urinary symptoms and blood pressure of children with Schistosoma haematobium infection in South Eastern Nigeria. East Afr Med J. 1995;72(8):486-489. [ Links ]
28.Anosike JC, Njoku AJ, Nwoke BEB, et al. Epidemiology of urinary schistosomiasis in Ebonyi State, Nigeria. lJEHHD. 2002;3(1):59-63. [ Links ]
29.Nworie O, Nya O, Anyim C, Okoli CS, Okonkwo EC. Prevalence of urinary schistosomiasis among primary school children in Afikpo North Local Government Area of Ebonyi State. Ann Bio Res. 2012;3(8):3894-3897. [ Links ]
30.Udonsi JK. Human community ecology of urinary schistosomiasis in relation to snail vector bionomics in the Igwun River Basin of Nigeria. Trop Med Parasitol. 1990;41(2):131-135. [ Links ]
31.Bello YM, Adamu T, Abubakar R, Muhammed AA. Urinary schistosomiasis in some villages around the Goronyo Dam, Sokoto State Nigeria. Nigerian J Parasitol. 2003;24(1):109-114. https://doi.org/10.4314/njpar.v24i1.37813 [ Links ]
32.Okoli EI, Odaibo AB. Urinary schistosomasis among school children in Ibadan, an urban community in South-Western Nigeria. Trop Med Int Health 1999;4(4):308-315. https://doi.org/10.1046/j.1365-3156.1999.00388.x [ Links ]
Correspondence:
Nse Umoh
nsirumoh1611@gmail.com
Received: 09 Apr. 2018
Accepted: 12 May 2020
Published: 24 Aug. 2020
ORIGINAL RESEARCH
Prevalence and aetiology of moderate and severe thrombocytopenia in a tertiary and quaternary centre in KwaZulu-Natal
Ayanda G.P. JaliI, II; Bongani B. NkambuleIII
IDepartment of Haematology, Health King Edward VIII Hospital, University of Kwa-Zulu Natal, Durban, South Africa
IIDepartment of Haematology, National Health Laboratory service, Inkosi Albert Luthuli Academic Hospital, Durban, South Africa
IIIDepartment of Human Physiology, School of Laboratory Medicine and Medical Sciences, University of KwaZulu-Natal, Durban, South Africa
ABSTRACT
BACKGROUND: Thrombocytopenia is a common haematological disorder, characterised by platelet counts below 150 × 109/L. The aetiology of thrombocytopenia is multifactorial; notably, in a misdiagnosis this condition may be due to pre-analytical laboratory artefacts. Knowledge about the common aetiology of thrombocytopenia will assist clinicians in decision-making and interpretation of laboratory tests and this may lead to prompt, adequate patient management and cost-saving measures.
OBJECTIVE: This study determined the prevalence and aetiology of moderate and severe thrombocytopenia in a tertiary or quaternary laboratory in Durban, KwaZulu-Natal, South Africa.
METHODS: We conducted a retrospective study at the Inkosi Albert Luthuli Central Hospital haematology laboratory between October 2015 and April 2016. A total of 2076 full blood count results with a platelet count of less than 100 × 109/L were retrieved from the Inkosi Albert Luthuli Academic Hospital database. Laboratory data were extracted and matched with clinical data and used to identify the potential aetiology of thrombocytopenia.
RESULTS: The prevalence of thrombocytopenia was 14.9% within the selected study period. The haematology or oncology wards and clinic accounted for 55.2% of thrombocytopenia cases, whereas the adult and paediatric intensive care units accounted for 29.3%. Notably, 15.5% of thrombocytopenia cases were reported in non-haematology wards and clinics. The most common cause of thrombocytopenia was chemotherapy which accounted for 38.5% of all causes.
CONCLUSION: In our tertiary and quaternary setting, thrombocytopenia in adults was most common in patients admitted to haematology and oncology wards. Moreover, chemotherapy-induced thrombocytopenia accounted for more than a third of all these cases.
Keywords: thrombocytopenia; prevalence; aetiology; South Africa; haematology.
Introduction
Thrombocytopenia is a common clinical condition that is associated with multiple systemic diseases. Thrombocytopenia is characterised by platelet counts below 150 × 109/L. However, only platelet counts of less than 100 × 109/L are considered clinically significant.1 Moderate thrombocytopenia is defined as a platelet count range of 50-100 × 109/L, while severe thrombocytopenia is classified by a platelet count of less than 50 × 109/L.2 The aetiology of thrombocytopenia varies and may be caused by mild to life-threatening clinical conditions. However misdiagnosis of thrombocytopenia also occurs, and could be the result of artefactual laboratory errors.3,4 A full blood count and peripheral blood smear are mandatory as an initial test in patients with thrombocytopenia.1,5 Although there have been advances in the automation of haematology analysers, the peripheral blood smear still remains an important diagnostic tool.1 It provides an informed interpretation of the full blood count results, as there are morphological abnormalities that an automated analyser cannot detect.3,6 In particular, it helps to distinguish between thrombocytopenia due to laboratory errors and true thrombocytopenia.3 Thrombocytopenia can be caused by decreased thrombopoiesis in the bone marrow and increased sequestration of platelets by the spleen as a result of malignancy, aplastic anaemia, myelodysplastic syndrome and opportunistic infections.1,7 Another aetiology of thrombocytopenia is increased peripheral destruction of platelets that may occur following disseminated intravascular coagulation, thrombotic microangiopathy and increased platelet sequestration due to hypersplenism.4,8
For prompt and adequate management of patients with thrombocytopenia, a comprehensive review of the patients' medical records should be performed by the treating clinician, and appropriate physical examination and investigations need to be performed.1 Previous studies have shown an increased prevalence of thrombocytopenia in hospitalised patients in developing and developed countries.4,9,10 In patients with haematological malignancies receiving chemotherapy, thrombocytopenia as a consequence of drug toxicity levels has been reported.12 Understanding the aetiology of thrombocytopenia in hospitalised patients is pivotal, as thrombocytopenia may lead to complications in patients with a variety of conditions.9,10,11 In a previous study conducted in Johannesburg, South Africa in 2012, the authors reported on chemotherapy and sepsis as the common causes of thrombocytopenia, irrespective of HIV status.4 However, the prevalence and aetiology of thrombocytopenia in a tertiary or quaternary hospital setting remains unknown as data describing this remain scarce. The aim of this study was to determine the prevalence and clinical diagnosis associated with thrombocytopenia in patients presenting at Inkosi Albert Luthuli Central Hospital in KwaZulu-Natal between October 2015 and April 2016.
Methods
Ethical considerations
The study received ethical approval from the University of KwaZulu-Natal Biomedical Research and Ethics Committee (Approval number: BE 297/16).
Sample selection and data extraction
This retrospective study was conducted at the Department of Haematology at Inkosi Albert Luthuli Central Hospital (IALCH), Durban, KwaZulu-Natal, South Africa. The department offers diagnostic haematology services to the entire province of KwaZulu-Natal. The IALCH is an 846-bed referral hospital that provides tertiary level services to the entire KwaZulu-Natal province and parts of the Eastern Cape.
Data collection
Patients' diagnostic test results and clinical notes were retrieved from the IALCH TRAK laboratory data management system, version 6.10.56 (Intersystems Corporation, Cambridge, Massachusetts, United States). The extracted laboratory data items included the peripheral blood film report, diagnosis, platelet count, ward number and hospitalisation status. Clinical data items were retrieved from Meditech version 615 (Meditech, Westwood, Massachusetts, United States). The extracted patient information included age, sex, type of ward, hospitalisation status and the cause of thrombocytopenia in these patients.
A total of 2076 full blood count results were extracted from the TRAK database. These results were from samples received at IALCH haematology laboratory on non-consecutive weekdays from October 2015 to April 2016. This was in an effort to minimise the inclusion of repeat samples in our analysis. All samples were analysed using the same Sysmex XE5000 analyser (Sysmex Corporation, Chuo-ku, Kobe, Japan). The study included patient reports that fulfilled the study inclusion criteria of a platelet count of < 100 × 109/L and had a corresponding peripheral blood smear report (Figure 1).
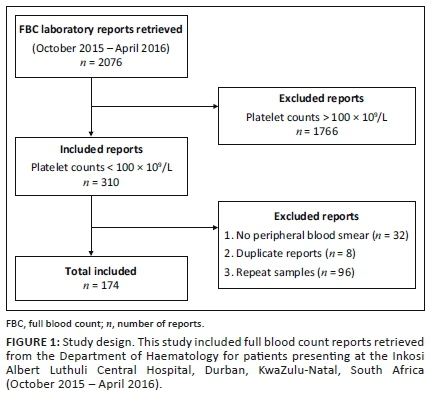
Sample size determination
In order to determine the prevalence of thrombocytopenia, we computed a minimum required sample size (n) of 304 based on the thrombocytopenia prevalence of 20% and an appropriate precision (d) of 0.05 and a 95% confidence interval width of 15.5% - 24.5%.13 Furthermore, a sub-sample size of 170 was required to estimate the aetiology of thrombocytopenia with a 5% probability of error and assuming that 50% of cases are due to acquired factors.
Statistical analysis
The Kolmogorov-Smirnov and Lilliefors tests for normality were used to assess data distribution. Parametric data such as platelet count and cluster of differentiation 4 T-cell counts were reported as mean and standard deviations. Platelet counts were ordered into two categories (i.e. < 50 and 51-100). The Fisher's exact test was used for comparisons between ordinal data (age, platelet count, diagnosis and race). The prevalence of thrombocytopenia was reported as a proportion of patients with the disease. Furthermore, associations between patient characteristics (age, sex and hospital ward) and aetiology of thrombocytopenia were assessed. A p-value of < 0.05 was regarded as statistically significant. All data analyses were performed using the Stata version 13.1 statistical software (StataCorp LP, College Station, Texas, United States).
Results
A total of 2076 full blood count reports were retrieved from the IALCH database. Among these, 174 reports that met the inclusion criteria were included in the study (Figure 1). The extracted participant data included age, gender, peripheral blood film report, diagnosis, platelet count, ward number and hospitalisation status.
Patient characteristics
The study comprised 174 thrombocytopenia patients with a mean age of 24.4 ± 2.9 years. This consisted of patients receiving both inpatient and outpatient care (Table 1). The HIV status of the thrombocytopenia patients was reported in 146 (83.9%) of the included cases, while it was not determined in 28 (16.1%) (Table 1). Thirty-one (21.2%) of the thrombocytopenia patients were HIV-positive with a mean cluster of differentiation 4 T-cell count of 261.3 ± 199.3 cells/µL.
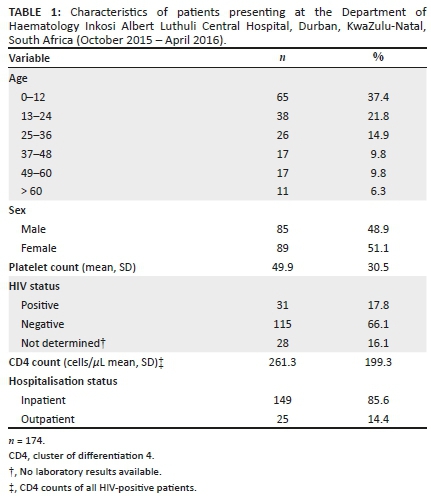
Prevalence and aetiology of moderate to severe thrombocytopenia
The overall prevalence of thrombocytopenia was 14.9%. The paediatric population (0-12 years) had the highest prevalence of thrombocytopenia (37.4%) compared with those aged 13-24 years (21.8%), 25-36 years (14.9%), 37-48 years (9.8%), 49-60 years (9.8%) and > 60 years (6.3%) (Table 1). In the overall cohort, the prevalence of thrombocytopenia was higher in female patients (51.1%) compared to male patients (48.9%), p < 0.001. Thrombocytopenia was most common in inpatients (85.6%) compared to outpatients (14.4%), p < 0.001. The adult and paediatric haematology and oncology wards and clinic had the highest prevalence of thrombocytopenia (55%), whereas the adult and paediatric intensive care units (29.3%) and the non-haematology wards and clinic (15.5%) had a lower prevalence, p < 0.001. Overall, severe thrombocytopenia (platelet count ≤ 50 × 109/L) was twofold higher (64.9%) than moderate thrombocytopenia (35.1%), p = 0.004 (Table 2).
Chemotherapy-induced thrombocytopenia (38.5%) and sepsis (27.6%) accounted for the majority of thrombocytopenia cases (Table 2). Malignancies accounted for 11.5%, immune thrombocytopenic purpura 4.6% and aplastic anaemia 4.6%. Aetiologies with a prevalence less than 4% were grouped into one category and these comprised trauma as well as pre-eclampsia, storage disorders, autoimmune disorders, hereditary thrombocytopenia and human leukocyte antigen antibodies to platelets, which accounted for between 0.6 and 1.7%.
Discussion
In this study, we report a thrombocytopenia prevalence of 14.9%, which is higher than the 8.6% prevalence reported in a similar study conducted at an academic state hospital in Johannesburg, South Africa.4 This higher prevalence may be due to the fact that the current study was conducted at a tertiary and quaternary hospital, to which only specific cases are referred and this could result in an overestimation of the prevalence of thrombocytopenia. In addition, other studies have reported on seasonal and genetic variations in platelet counts.14 Taken together these factors may account for the differences in the prevalence of thrombocytopenia. In fact, seasonal variations in platelet counts have been reported with lower platelet counts observed in spring and summer, while slightly elevated platelet counts have been observed in autumn and winter.14,15 Notably our study period fell within a low thrombocytopenia season (summer and autumn); this may suggest that the reported platelet counts in patients with severe thrombocytopenia were not influenced by seasonal variations but may have led to an underestimation of thrombocytopenia in our setting. Notably, only 17.8% of the patients included in our study were HIV-positive compared to 36% reported in the previous retrospective study by Vaughan et al. reporting on patient full blood count reports authorised in 2012, at the Chris Hani Baragwanath Academic Hospital, South Africa.4 We further report on a higher frequency of thrombocytopenia in hospitalised patients compared to outpatients, which is similar to that previously described.4 This may be due to the differences in diagnosis and disease severity between admitted patients and outpatients. Moreover, in our study thrombocytopenia was particularly common among patients admitted to haematology and oncology wards, intensive care units, neonatal intensive care units and medical wards, while a minority of thrombocytopenia cases (1.7%) were from non-haematology clinics. These findings are consistent with those previously reported. Interestingly, in our study thrombocytopenia was common particularly among children below the age of 12 years and the majority of the cases were due to sepsis.
More than a third of cases referred to the haematology department with thrombocytopenia were classified as chemotherapy-induced. The mechanism of thrombocytopenia in chemotherapy-induced thrombocytopenia involves reduced platelet production, an increased rate of platelet destruction and enhanced platelet clearance by immune mechanisms.7 Bone marrow infiltration by malignancy can cause suppression of megakaryopoiesis, resulting in thrombocytopenia.1,7 In our study, malignancies accounted for more thrombocytopenia cases when compared to bone marrow failure. Contrary to our findings, a study conducted in Johannesburg, South Africa in 2012 showed that bone marrow failure accounted for 9.6% of cases while malignancies accounted for 7.4% of thrombocytopenia cases.4
Thrombocytopenia due to sepsis accounted for 27.6% of the cases, a majority of which were in the intensive care unit. The majority of cases presenting with sepsis had severe thrombocytopenia; these findings were similar to those previously described.16 Studies have shown that the prevalence of thrombocytopenia in sepsis ranges from 33.8% to 60%.5,6,17 Immune thrombocytopenic purpura, an isolated thrombocytopenia with no associated clinical conditions,18 was seen in 4.6% of the participants and most participants were between 13 and 24 years; the majority were in the obstetrics and labour ward (87.5%). In adults, immune thrombocytopenic purpura is a chronic disease resulting from an autoimmune disorder mediated by platelet antibodies, increased platelet destruction and impaired platelet production.18,19
Contrary to literature, immune thrombocytopenic purpura was not common among the paediatric group (12.5%).19 Neonatal thrombocytopenia commonly occurs as a result of increased platelet destruction or sequestration resulting from infections, respiratory distress syndrome or infants whose mothers had pre-eclampsia.20 Thrombocytopenia can also be the result of decreased platelet production in congenital abnormalities of the newborn such as thrombocytopenia absent radii.20 Thrombocytopenia can also be seen in children who are well and commonly as an isolated thrombocytopenia resulting from immune causes such as in infants born to mothers with immune thrombocytopenic purpura and in those with neonatal alloimmune thrombocytopenia.
In our study, the prevalence of pregnancy-associated thrombocytopenia was 5.2%, which is lower in comparison to other studies.8,9,21 Pregnancy-associated thrombocytopenia occurs in 6% - 10% of pregnant patients; however, its prevalence depends on its association with other medical conditions.22 The diagnosis of gestational thrombocytopenia is a diagnosis of exclusion and accounts for the majority of all cases of thrombocytopenia during pregnancy.23,24
Limitations
Care should be taken in generalising the findings of the study because of the small numbers included in the study. The patient characteristics of those included may also differ from those seen at other levels of the healthcare system. Other limitations encountered were a lack of family history and other medications patients were taking, as this would have allowed for the classification and consideration of familial and drug-induced thrombocytopenia.
Conclusion
In our study, thrombocytopenia was common in hospitalised patients compared to outpatients. Chemotherapy, sepsis and malignancies were the most common causes of thrombocytopenia. Focused investigations are warranted for prompt patient management. Knowledge of the prevalence and common aetiology of thrombocytopenia in a healthcare facility will assist clinicians in decision-making and interpretation of laboratory test results, leading to prompt and adequate patient management and potentially offsetting patient costs that may be incurred due to unwarranted laboratory investigations. Further research in this field is required at different levels of healthcare as differences in the reported prevalence of thrombocytopenia may be the result of differences in patient demographics and clinical presentation of patients, which may differ between these facilities.
Acknowledgements
The authors would like to thank the Department of Haematology, National Health Laboratory Service laboratory, Inkosi Albert Luthuli Central Hospital and Inkosi Albert Luthuli Central Hospital for granting access to the patient database.
Competing interests
The authors declare that there are no financial, personal or professional competing interests that may interfere with this work.
Authors' contributions
A.G.P.J. performed the experiments, designed the study and wrote the paper; B.B.N. contributed to the revision of the intellectual content. All authors gave their approval of the final version to be submitted for publication.
Sources of support
B.B.N. is a University of KwaZulu-Natal Developing Research Innovation, Localisation and Leadership in South Africa fellow. Developing Research Innovation, Localisation and Leadership in South Africa is a United States National Institutes of Health D43 grant (D43TW010131) awarded to the University of KwaZulu-Natal in 2015 to support a research training and induction programme for early-career academics.
Data availability statement
Data sharing is not applicable to this article as no new data were created or analysed in this study.
Disclaimer
The views and opinions expressed in this article are those of the authors and do not necessarily reflect the official policy or position of any affiliated agency of the authors.
References
1.Stasi R. How to approach thrombocytopenia. Hematology Am Soc Hematol Educ Program. 2012;2012(1):191-197. https://doi.org/10.1182/asheducation-2012.1.191 [ Links ]
2.Gernsheimer T, James AH, Stasi R. How I treat thrombocytopenia in pregnancy. Blood. 2013;121(1):38-47. https://doi.org/10.1182/blood-2012-08-448944 [ Links ]
3.Zhang L, Xu J, Gao L, Pan S. Spurious thrombocytopenia in automated platelet count. Lab Med. 2018;49(2):130-133. https://doi.org/10.1093/labmed/lmx081 [ Links ]
4.Vaughan JL, Fourie J, Naidoo S, Subramony N, Wiggill T, Alli N. Prevalence and causes of thrombocytopenia in an academic state sector laboratory in Soweto, Johannesburg, South Africa. S Afr Med J. 2015;105(3):215-219. https://doi.org/10.7196/samj.8791 [ Links ]
5.Provan D, Stasi R, Newland AC, et al. International consensus report on the investigation and management of primary immune thrombocytopenia. Blood. 2010;115(2):168-186. https://doi.org/10.1182/blood-2009-06-225565 [ Links ]
6.Bain BJ. Diagnosis from the blood smear. N Engl J Med. 2005;353(5):498-507. https://doi.org/10.1056/NEJMra043442 [ Links ]
7.Zeuner A, Signore M, Martinetti D, Bartucci M, Peschle C, De Maria R. Chemotherapy-induced thrombocytopenia derives from the selective death of megakaryocyte progenitors and can be rescued by stem cell factor. Cancer Res. 2007;67(10):4767-4773. https://doi.org/10.1158/0008-5472.CAN-06-4303 [ Links ]
8.Williamson DR, Albert M, Heels-Ansdell D, et al. Thrombocytopenia in critically ill patients receiving thromboprophylaxis: Frequency, risk factors, and outcomes. Chest. 2013;144(4):1207-1215. https://doi.org/10.1378/chest.13-0121 [ Links ]
9.Teo CP, Kueh YK. Incidence of thrombocytopenia in an acute care hospital. Ann Acad Med Singapore. 1989;18(4):379-381. [ Links ]
10.Fountain EM, Arepally GM. Etiology and complications of thrombocytopenia in hospitalized medical patients. J Thromb Thrombolysis. 2017;43(4):429-436. https://doi.org/10.1007/s11239-016-1467-8 [ Links ]
11.Chaturvedi S, Kohli R, McCrae K. Over-testing for heparin induced thrombocytopenia in hospitalized patients. J Thromb Thrombolysis. 2015;40(1):12-16. https://doi.org/10.1007/s11239-014-1123-0 [ Links ]
12.Soff GA, Shaw J, Kilpatrick K, Marongiu A, Park J. Burden of thrombocytopenia in adult cancer patients receiving chemotherapy. J Clin Oncol. 2019;37(15):1555-1555. https://ascopubs.org/doi/abs/10.1200/JCO.2019.37.15_suppl.1555 [ Links ]
13.Louie KS, Micallef JM, Pimenta JM, Forssen UM. Prevalence of thrombocytopenia among patients with chronic hepatitis C: A systematic review. J Viral Hepat. 2011;18(1):1-7. https://doi.org/10.1111/j.1365-2893.2010.01366.x [ Links ]
14.Buckley MF, James JW, Brown DE, et al. A novel approach to the assessment of variations in the human platelet count. Thromb Haemost. 2000;83(03):480-484. https://doi.org/10.1055/s-0037-1613840 [ Links ]
15.Liu B, Taioli E. Seasonal variations of complete blood count and inflammatory biomarkers in the US population-analysis of NHANES data. PLoS One. 2015;10(11):e0142382. https://doi.org/10.1371/journal.pone.0142382 [ Links ]
16.Venkata C, Kashyap R, Farmer JC, Afessa B. Thrombocytopenia in adult patients with sepsis: Incidence, risk factors, and its association with clinical outcome. J Intensive Care. 2013;1(1):9. https://doi.org/10.1186/2052-0492-1-9 [ Links ]
17.Boechat Tde O, Silveira MF, Faviere W, Macedo GL. Thrombocitopenia in sepsis: An important prognosis factor. Rev Bras Ter intensiva. 2012;24(1):35-42. [ Links ]
18.Thota S, Kistangari G, Daw H, Spiro T. Immune thrombocytopenia in adults: An update. Cleve Clin J Med. 2012;79(9):641-650. https://doi.org/10.3949/ccjm.79a.11027 [ Links ]
19.Grimaldi-Bensouda L, Nordon C, Michel M, et al. Immune thrombocytopenia in adults: A prospective cohort study of clinical features and predictors of outcome. Haematologica. 2016;101(9):1039-1045. https://doi.org/10.3324/haematol.2016.146373 [ Links ]
20.Arora M, Goyal L, Khutan H. Prevalence of thrombocytopenia during pregnancy and its effect on pregnancy and neonatal outcome. Ann Int Med Dent Res. 2019;3(2):4. https://doi.org/10.4103/ijh.ijh_17_18 [ Links ]
21.Sebitloane HM. Thrombocytopenia during pregnancy in women with HIV infection receiving no treatment. S Afr Med J. 2016;106(2):210-213. https://doi.org/10.7196/SAMJ.2016.v106i2.9903 [ Links ]
22.Dwivedi P, Puri M, Nigam A, Agarwal K. Fetomaternal outcome in pregnancy with severe thrombocytopenia. Eur Rev Med Pharmacol Sci. 2012;16(11):1563-1566. [ Links ]
23. McCrae KR. Thrombocytopenia in pregnancy: Differential diagnosis, pathogenesis, and management. Blood Rev. 2003;17(1):7-14. https://doi.org/10.1016/s0268-960x(02)00056-5 [ Links ]
24 . Ciobanu AM, Colibaba S, Cimpoca B, Peltecu G, Panaitescu AM. Thrombocytopenia in pregnancy. Maedica (Buchar). 2016;11(1):55. [ Links ]
Correspondence:
Ayanda Jali
juhjali@gmail.com
Received: 12 Mar. 2018
Accepted: 02 June 2020
Published: 24 Aug. 2020
ORIGINAL RESEARCH
Kaposi's sarcoma-associated herpesvirus protein ORF75 among HIV-1 patients in Kenya
Rodgers N. DembaI, II; Sylviah M. AradiIII; Matilu MwauIV; Walter O. MwandaII
ISchool of Health Sciences, Kisii University, Kisii, Kenya
IIInstitute of Tropical and Infectious Diseases, University of Nairobi, Nairobi, Kenya
IIIDepartment of Internal Medicine, University of Nairobi, Nairobi, Kenya
IVCenter for Infectious and Parasitic Diseases Control Research, Kenya Medical Research Institute, Busia, Kenya
ABSTRACT
BACKGROUND: Histology is used to identify Kaposi's sarcoma (KS) in countries with low resources to fund healthcare costs. Approximately 95% of KS cases can be detected using a polymerase chain reaction.
OBJECTIVE: To determine the presence of the open reading frame 75 (ORF75) gene associated with Kaposi's sarcoma herpes virus among HIV-1/AIDS patients and to describe morphological presentations of KS.
METHODS: This was a retrospective, descriptive study of archived tissue blocks collected from 2013 to 2016. Haematoxylin and eosin staining was used to identify KS. Deoxyribonucleic acid from archived tissue blocks was extracted and a nested polymerase chain reaction was used to detect the ORF75 gene.
RESULTS: All 81 cases in this study had been diagnosed as HIV-1 positive, of which 68 had hallmark features of KS in the histology report and 13 had features suggestive of KS ('KS-like'). Microscopic identification of KS by haematoxylin and eosin staining was considered a significant indicator of KS herpes virus ORF75 gene positivity (p = 0.002). The ORF75 gene was detected in 60.5% (49/81) of tissue blocks; 27.2% were men (22/81) and 33.3% were women (27/81). The ORF75 gene was observed to be present in up to 15.4% (2/13) of the cases reported to have KS-like features.
CONCLUSION: Following the initial diagnosis of KS by histology, the ORF75 gene was fur-ther detected from both cases that had hallmark features of KS as well as among cases with KS-like features.
Keywords: Human herpes virus 8; Kaposi's sarcoma; histology; nested PCR; ORF75 gene.
Introduction
Kaposi sarcoma (KS) is a tumor formed from blood vessels; it later shows lesions on the skin or organs of HIV-positive people.1 All forms of KS are caused by Kaposi's sarcoma herpesvirus (KSHV), also known as human herpesvirus 8 (HHV-8).2,3 The genome of HHV-8 contains a minimum of 100 open reading frames (ORF), of which 4 to 75 are known to be unique to herpesvirus.4 The KSHV genome encodes more than 84 proteins that play a role in viral replication and host-virus interaction.5 The replication cycle of KSHV entails latent and lytic phases. During the lytic cycle, the ORF75 genes are expressed resulting in the manifestation of KS.6,7 The ORF75 gene product has been proven to aid in lytic replication and enhancement of virus pathogenesis in host cells.8
Kaposi's sarcoma is listed among the defining malignancies of HIV/AIDS.9,10,11 The dis-tinct feature of HIV-associated KS is that it might affect the lymph nodes, gastrointestinal tract, lungs or liv-er.12,13 Despite the fact that saliva is the main route by which KSHV is transmitted,14 HHV-8 has been isolated from other body fluids.14,15,16 The main route of HHV-8 transmission to the opposite sex is through sexual relations.17 The pathogenesis of KS presents as an abnormal neoangiogenesis, proliferation of cancer cells and inflammation of endothelial cells.18 A classic KS lesion manifests various features ranging from maculopapular to nodular or plaque-like and, in most cases, is pain-less.12,19,20,21
In sub-Saharan Africa, KSHV is endemic and approximately 84% of worldwide cases of KS occur in this region.22 Since KS is common among HIV/AIDS pa-tients,13 early detection of KSHV is essential in disease monitoring.22 The sensitivity of diagnostic tests for detection of KSHV depends on the sample selected for analysis.23 For example, biopsies obtained from patients with HIV/AIDS-KS were found to yield better results compared to using peripheral blood mononuclear cells from the same patient.23 Identification of KS in tissue biopsies by use of histological staining techniques should not be underestimated.24 In tissue biopsies, microscopic examination involves identification of proliferated spindle cells and oedema.25 Clinical diagnoses of KS have been shown to have limited predictive value.26 The use of molecular techniques such as polymerase chain reaction (PCR) permits the detection of the HHV-8 gene even for patients who present with early vascular lesions that histological techniques might miss.27 The use of PCR in the diagnosis of KS can detect approximately 95% of cases.28 The HHV-8 DNA has been successfully amplified using nested PCR previously.29,30 This study was aimed at determining the presence of the ORF75 gene linked to KSHV among HIV-1/AIDS patients. In addition, the objective of this current study was to describe the morphological presentations of KS among the studied cases.
Methods
The present study only included patients aged 18 years and older. Data on clinical information that was useful for this study were extracted from the registry records with the help of the data clerk. The following data were obtained from the registry records: sex, age, HIV-1 status, if patient was on antiretroviral or Highly Active Antiretroviral Therapy treatment, anatomic location of KS lesions, number of KS lesions, distribution of KS lesions, cluster of differentiation 4 cell count and histology diagnosis.
Ethical considerations
Study approval number P682/11/2014 was assigned by Kenyatta National Hospital/University of Nairobi Ethics and Research Committee.
Study design
A cross-sectional, descriptive, hospital-based study was used. Formalin-fixed, paraffin-embedded tissue blocks were retrieved from archives following histological reports of the patients who were diagnosed with KS or KS-like disease between 2013 and 2016. A consecutive sampling technique was used to select the archived tissue blocks from Thematic Unit of Anatomic Pathology, Department of Human Pathology, College of Health Sciences, University of Nairobi, and Department of Laboratory Medicine, Cytology Section, Kenyatta National Hospital.
For this study, a total of 81 tissue blocks were selected and analysed. A rotary microtome was used to section the formalin-fixed, paraffin-embedded blocks. A different blade was used for every formalin-fixed, paraffin-embedded block so as to avoid carry-over of genetic material. Once a block was cut, the microtomes surface was decontaminated using DNAZapTM PCR DNA degradation solution (catalog number: AM9890; Thermo Fisher Scientific, Waltham, Massachusetts, United States). Each tissue section was cut to 10 µm thick. The tissue sections were processed for haematoxylin and eosin staining and a qualified pathologist reported on the results.
Deoxyribonucleic acid extraction and polymerase chain reaction
Isolation of DNA from tissue sections was done using a GeneRead DNA FFPE kit (Qiagen, Hilden, Germany). The extraction kit removes paraffin and reverses formalin cross-links from tissue before DNA is bound to the QIAampMinElute column (Qiagen, Hilden, Germany). The eluted DNA is then ready to be used for nested PCR to detect the ORF75 gene in HHV-8. A Taq PCR Core Kit (catalog number: 201223; Qiagen, Hilden, Germany) was used to detect the ORF75 gene. The set of primers used were; ORF75 product size 895 bp Forward KS 1000 5′CGGTTCGGTGGCATACAGGC3′; Reverse KS 1034 5′CTGACTACAGAGGGTGTCCCCG3′.31 ORF75 product size 804 bp Forward KS 2000 5′GGAAACAGGGTGCTGTG3′; Reverse KS 2034 5′CATGGCCTACGACGTCAC3′.32 The cycling conditions of the PCR for the targeted KS regions were similar and consisted of 30 cycles of: initial denaturation at 94 °C for 3 minutes, denaturation at 94 °C for 1 min, annealing at 63 °C for 1 min, extension at 72 °C for 1 min and final extension at 72 °C for 10 min. Amplified PCR products were analysed by electrophoresis on a 1% agarose gel containing ethidium bromide (1 µL/mL of agarose solution) and were visualised under ultraviolet light alongside a 1 Kilobase (Kb) deoxyribonucleic acid (DNA) ladder. For a positive control, a known case of KS was used. The ribonuclease-free water was used as a negative control.
Statistical analysis
The data were analysed using Statistical Package for Social Sciences version 21 (SPSS Inc Binghamton, New York, United States); the relationship between the ORF75 gene and clinical characteristics were tested by using chi-square and t-tests. A p-value of less than 0.05 was considered to be statistically significant. Odds ratios in a cross-sectional study are known as prevalence odds ratios and were used as a measure of association.33
Results
Of the 81 tissue samples included in the study, 43.2% (35/81) were from women and 56.8% (46/81) were from men (Table 1). All of the 81 cases studied had been diagnosed with HIV-1 implying that they were living with the virus. In addition, it was observed that none of the cases had a cluster of differentiation 4 cell count above 350 cells/mm3. Among the 81 cases, the ORF75 gene was detected in 49 cases (60.5%); 27.2% (22/81) were women and 33.3% (27/81) were men. Among cases positive for the ORF75 gene, 4.1% (2/49) were never on any form of antiretroviral therapy and 95.9% (47/49) were on antiretroviral therapy. No statistically significant association was found between the presence of the ORF75 gene and sex, antiretroviral treatment status, number of KS lesions or distribution of the KS lesions (all p-values > 0.05).
Age
The mean age of patients with tissue blocks positive for the ORF75 gene was 41 years (standard deviation = 9.2; maximum age, 66 years; minimum age, 19 years). Detection of the ORF75 gene was most common in the 30-39 years age group (n = 21; 42.9%). Age had a statistically significant association with ORF75 gene positivity (prevalence odds ratio: 1.05; 95% confidence interval: 1.00-1.11, P = 0.047).
Kaposi sarcoma morphology and distribution of lesions
In the histology report, 68 cases had hallmark features of KS, whereas 13 cases had features suggestive of KS (KS-like). The types of KS morphology identified included patchy, nodular, plaque and KS-like (Figure 1). The morphological distribution of KS was as follows: 61.7% (50/81) was nodular, 16% (13/81) was patchy, and 22% (18/81) were plaques. Among the cases that were positive for the ORF75 gene, 75.51% (37/49) was nodular, 4.08% (2/49) patchy, and 20.41% (10/49) were plaques.
The total number of KS cases diagnosed by histology was 68 (84%) and 13 cases (16%) had KS-like features (Table 1). Among the 49 cases with the ORF75 gene, 47 (95.9%) showed hallmark features of KS and 2 (4.1%) had KS-like features with microscopic examination. There was an association between microscopic identification of KS by histology and the presence of the ORF75 gene (prevalence odds ratio = 12.3; 95% confidence interval = 12.51 - 60.49; P = 0.002) (Table 1).
The amplified ORF75 genes of HHV-8 were identified by 1% agarose gel electrophoresis (Figure 2).

Discussion
Retrieved clinical data revealed that all of the tissue blocks retrieved in the present study were collected from patients who had been diagnosed with HIV-1. These patients might have developed KS lesions due to immunosup-pression or because they were immunocomprised due to increased viral load that impaired their immune system. Other studies have also associated KS as an HIV/AIDS-defining illness.9,13,24,34,35,36
The findings of this study revealed that men were more prone to development of KS: 56.8% (46/81) compared with women 43.2% (35/81). This observation is concordant with others who also noted more frequent development of KS among men.37,38,39,40 There is a lack of consensus as to why all forms of KS are more common among men than women.41,42 We hypothesise that gender-related factors such as hormones might influence the development of KS lesions. The results of this study showing KS pre-ponderance among men was consistent with the country's published data on the distribution of malignancy cases as captured in the National Cancer Control strategy, 2017.43
Kaposi's sarcoma immune reconstitution occurs when a portion of AIDS-KS cases responds to the introduction of combined antiretroviral therapy with disease advancement.44,45,46 In this study, KS lesions manifested among patients despite the fact that 77 (95.1%) were on antiretroviral treat-ment. Contrary to other findings that antiretroviral therapy alone can result in the resolution of KS,47,48 in our study, being on antiretroviral treatment did not have a statistically significant association with the presence of KS (P = 0.66). This finding is in agreement with another study that stated that there has been continued diagnosis of KS in HIV-positive patients, despite the availability of highly active antiretroviral therapy.49 Other studies have stated that patients infected with AIDS-associated KS respond to combined antiretroviral therapy by 50% depending on geographical location and severity of the presentation, thereby resulting in immune reconstitution and HIV suppression.50,51,52 In the current study, these manifestations of KS could be attributed to the weakening of the immune system by HIV-1.
This study found patchy, plaque and nodular morphological presentations of KS. The morphological appearance of KS shows progression from plaques to nodular form and fungiform.1 Kaposi sarcoma lesions are known to progress from asymptomatic to macule, papule, plaque and nodule forms.53 The findings of this study revealed that the KS lesions were disseminated in different body regions, including the lower limbs, upper limbs, genitalia, eyelids, palate, oral cavity and trunk (chest and back). In another study, fatality was witnessed in HIV-positive patients who had KS lesions manifested in the gastrointestinal tract, lungs and lymph nodes.54
The decision in this study to use tissue biopsy for detection of the ORF75 gene of HHV-8 is in agreement with another study that supported the use of tumor biopsies as suitable for viral DNA identification due to high viral load as opposed to the use of blood.30 Further to that, nested PCR has been used successfully to assess the prevalence of HHV-8 among HIV-positive patients in Brazil.27 A tissue biopsy excised from a KS lesion has been shown to have high viral load; hence, biopsies are the ideal sample for the detection of KSHV DNA.55 The detection of the ORF75 gene implies that this gene was present in 49 (60.5%) of the studied cases.
Strength and limitations
Our study used the haematoxylin and eosin staining technique and the nested PCR method for detection of the ORF75 genes of the KSHV. However, HHV-8 immunohistochemical biopsy has been demonstrated to be the 'gold standard' for KS diagnosis.56 Cases in the present study had a dark skin pigmentation. In another study of dark-skinned patients, KS had been confirmed to mimic a number of non-KS-like dermatological conditions.56 In another study, it was observed that it is difficult to identify KS in dark-skinned individuals, who presented with violaceous skin lesions.56
The use of the PCR technique in the detection of KSHV has been shown to give the utmost specificity compared to the use of tests that determine exposure to infection.28 In addition, the PCR technique can detect approximately 95% of all KS cases.28 However, the cost associated with the use of PCR is quite high, which would limit the clinical application of HHV-8 DNA detection in resource-limited facili-ties.28
Implications and recommendations
The present study considered microscopic detection of KS by haematoxylin and eosin as a significant indicator of KSHV ORF75 gene positivity. It therefore recommends the use of both clinical diagnosis and routine microscopy in the diagnosis of KS in resource-limited facilities. However, among individuals with dark skin pigmentation, there is the need to employ the use of a robust diagnostic technique to ascertain the true causative agent.
Conclusion
The presence of the ORF75 gene of KSHV among immunosuppressed patients due to HIV-1 was successfully detected. Following the initial diagnosis of KS by histology, the ORF75 gene was further detected from both cases that had the hallmark features KS and those that had KS-like features. Microscopic detection of KS by haematoxylin and eosin should be considered a significant indicator of KSHV ORF75 gene positivity.
Acknowledgements
The authors of this manuscript would like to extend their gratitude to Kenyatta National Hospital and University of Nairobi for allowing them to use their archived tissue blocks.
Competing interests
The authors declare no conflict of interest.
Authors' contributions
R.N.D., S.M.A., M.M. and W.O.M. critically revised the manuscript for important intellectual content. R.N.D., S.M.A. and W.O.M. drafted the manuscript. R.N.D. and W.O.M. conceptualised and designed the study and ana-lysed and interpreted the data. R.N.D. and S.M.A. acquired the data.
Sources of support
This study was funded by the principal investigator (R.N.D.) as a fulfilment for the award of a postgraduate de-gree.
Data availability statement
Data sharing is not applicable to this article as no new data were created or analysed in this study.
Disclaimer
The views and opinions expressed in this article are those of the authors and do not necessarily reflect the offi-cial policy or position of any affiliated agency of the authors.
References
1.Warpe BM, Kaposi sarcoma as initial presentation of HIV infection. N Am J Med Sci. 2014;6(12):650. https://doi.org/10.4103/1947-2714.147984 [ Links ]
2.Betsem E, Cassar O, Afonso PV, et al. Epidemiology and genetic variability of HHV-8/KSHV in Pygmy and Bantu populations in Cameroon. PLoS Negl Trop Dis. 2014;15;8(5):e2851. https://doi.org/10.1371/journal.pntd.0002851 [ Links ]
3.Coen N, Duraffour S, Snoeck R, et al. KSHV targeted therapy: An update on inhibitors of viral lytic replication. Viruses. 2014;6(11):4731-459. https://doi.org/10.3390/v6114731 [ Links ]
4.Raab-Traub N. Novel mechanisms of EBV-induced oncogenesis. Curr Opin Virol. 2012;2(4):453-458. https://doi.org/10.1016/j.coviro.2012.07.001 [ Links ]
5.Dittmer DP, Damania B. Kaposi sarcoma associated herpesvirus pathogenesis (KSHV) - An update. Curr Opin Virol. 2013;1;3(3):238-244. https://doi.org/10.1016/j.coviro.2013.05.012 [ Links ]
6.Thomas S, Sindhu CB, Sreekumar S, et al. AIDS associated Kaposi's sarcoma. J Assoc Phys India [serial online]. 2011;59:387-389. Available from: https://europepmc.org/abstract/med/21751599 [ Links ]
7.Ye F, Lei X, Gao SJ. Mechanisms of Kaposi's sarcoma-associated herpesvirus latency and reactiva-tion. Adv Virol. 2011;2011. https://doi.org/10.1155/2011/193860 [ Links ]
8.Van Skike ND, Minkah NK, Hogan CH, et al. Viral FGARAT ORF75A promotes early events in lytic infection and gammaherpesvirus pathogenesis in mice. PLoS Pathog. 2018;14(2):e1006843. https://doi.org/10.1371/journal.ppat.1006843 [ Links ]
9.Stolka K, Ndom P, Hemingway-Foday J, et al. Risk factors for Kaposi's sarcoma among HIV-positive individuals in a case control study in Cameroon. Cancer Epidemiol. 2014;38(2):137-143. https://doi.org/10.1016/j.canep.2014.02.006 [ Links ]
10.Rohner E, Wyss N, Heg Z, et al HIV and human herpesvirus 8 co-infection across the globe: Systematic review and meta-analysis. Int J Cancer. 2016;138(1):45-54. https://doi.org/10.1002/ijc.29687 [ Links ]
11.Fang Q, Liu Z, Zhang Z, Zeng Y, Zhang T. Prevalence of Kaposi's sarcoma-associated herpesvirus among intravenous drug users: A systematic review and meta-analysis. Virol Sin. 2017;32(5):415-422. https://doi.org/10.1007/s12250-017-4051-2 [ Links ]
12.La Ferla L, Pinzone MR, Nunnari G, et al. Kaposi's sarcoma in HIV-positive patients: The state of art in the HAART-era. Eur Rev Med Pharmacol Sci [serial online]. 2013;17(17):2354-2365. Available from: https://www.researchgate.net//links/02e7e53537273f30c7000000.pdf [ Links ]
13.Hoffmann C, Sabranski M, Esser S. HIV-associated Kaposi's sarcoma. Oncol Res Treat. 2017;40(3):94-98. https://doi.org/10.1159/issn.2296-5270 [ Links ]
14.Minhas V, Wood C. Epidemiology and transmission of Kaposi's sarcoma-associated herpesvirus. Viruses. 2014;6(11):4178-4194. https://doi.org/10.3390/v6114178 [ Links ]
15.Ganem D. KSHV and the pathogenesis of Kaposi sarcoma: Listening to human biology and medicine. J Clin Invest. 2010;120(4):939-949. https://doi.org/10.1172/JCI40567 [ Links ]
16.Sathish N, Yuan Y. Evasion and subversion of interferon-mediated antiviral immunity by Kaposi's sarcoma-associated herpesvirus: An overview. J Virol. 2011;85(21):10934-10944. https://doi.org/10.1128/JVI.00687-11 [ Links ]
17.Shebl FM, Dollard SC, Pfeiffer RM, et al. Human herpesvirus 8 seropositivity among sexually active adults in Uganda. PLoS One. 2011;6(6):e21286. https://doi.org/10.1371/journal.pone.0021286 [ Links ]
18.Cancian L, Hansen A, Boshoff C. Cellular origin of Kaposi's sarcoma and Kaposi's sar-coma-associated herpesvirus-induced cell reprogramming. Trends Cell Biol. 2013;23(9):421-432. https://doi.org/10.1016/j.tcb.2013.04.001 [ Links ]
19.Curtiss P, Strazzulla LC, Friedman-Kien AE. An update on Kaposi's sarcoma: Epidemiology, patho-genesis and treatment. Dermatol Ther. 2016;6(4):465-470. https://doi.org/10.1007/s13555-016-0152-3 [ Links ]
20.El-Mallawany NK, Kamiyango W, Slone JS, et al. Clinical factors associated with long-term complete remis-sion versus poor response to chemotherapy in HIV-infected children and adolescents with Kaposi sarcoma receiving bleomycin and vincristine: A retrospective observational study. PLoS One. 2016;11(4):e0153335. https://doi.org/10.1371/journal.pone.0153335 [ Links ]
21.Stefan DC. Patterns of distribution of childhood cancer in Africa. J Trop Pediatr. 2015;61(3):165-173. https://doi.org/10.1093/tropej/fmv005 [ Links ]
22.Olp LN, Shea DM, White MK, Gondwe C, Kankasa C, Wood C. Early childhood infection of Kaposi's sarcoma-associated herpesvirus in Zambian households: A molecular analysis. Int J Cancer. 2013;1;132(5):1182-1190. https://doi.org/10.1002/ijc.27729 [ Links ]
23.Oetvoes R, Juhasz A, Szalai E, et al. Molecular typing of human herpesvirus 8 isolates from patients with Kaposi's sarcoma in Hungary. Anticancer Res [serial online]. 2014;34(2):893-898. Available from: http://ar.iiarjournals.org/content/34/2/893.short [ Links ]
24.Johann WS, Dirk PD. Diagnosis and treatment of Kaposi Sarcoma. Am J Clin Dermatol. 2017;18(4):529-539. https://doi.org/10.1007/s40257-017-0270-4 [ Links ]
25.Kumar P, Kuwa NY, Minhas V, et al. Higher levels of neutralizing antibodies against KSHV in KS patients compared to asymptomatic individuals from Zambia. PLoS One. 2013;14;8(8):e71254. https://doi.org/10.1371/journal.pone.0071254 [ Links ]
26.Amerson E, Woodruff CM, Forrestel A, et al. Accuracy of clinical suspicion and pathologic diagnosis of Kaposi sarcoma in East Africa. J Acquir Immune Defic Syndr. 2016;71(3):295-301. https://doi.org/10.1097/QAI.0000000000000862 [ Links ]
27.Machado PR, Farias KJ, Pereira MG, Freitas PP, Fonseca BA. Human herpesvirus 8 (HHV-8) detected by nested polymerase chain reaction (PCR) in HIV patients with or without Kaposi's sarcoma. An analytic cross-sectional study. Sao Paulo Med J. 2016;134(3):187-192. https://doi.org/10.1590/1516-3180.2014.8973010 [ Links ]
28.Crabtree KL. The epidemiology of Human Herpesvirus-8: Transmission of infection to children in Zambian households [homepage on the Internet]. 2013 [cited 2013 Dec 7];(12) Available from: https://digitalcommons.unl.edu/bioscidiss/53/ [ Links ]
29.Jalilvand S, Tornesello ML, Buonaguro FM, et al. Molecular epidemiology of human herpesvirus 8 variants in Kaposi's sarcoma from Iranian patients. Virus Res. 2012;163(2):644-649. https://doi.org/10.1016/j.virusres.2011.09.027 [ Links ]
30.Kourí V, Martínez PA, Capo V, et al. Kaposi's Sarcoma and Human Herpesvirus 8 in Cuba: Evidence of subtype B expansion. Virology. 2012;432(2):361-369. https://doi.org/10.1016/j.virol.2012.06.014 [ Links ]
31.Kakoola DN, Sheldon J, Byabazaire N, et al. Recombination in human herpesvirus-8 strains from Uganda and evolution of the K15 gene. J Gen Virol. 2001;82(10):2393-2404. https://doi.org/10.1099/0022-1317-82-10-2393 [ Links ]
32.Poole LJ, Zong JC, Ciufo DM, et al. Comparison of genetic variability at multiple loci across the genomes of the major subtypes of Kaposi's sarcoma-associated herpesvirus reveals evidence for recombination and for two distinct types of open reading frame K15 alleles at the right-hand end. J Virol. 1999;73(8):6646-6660. https://doi.org/10.1128/JVI.73.8.6646-6660.1999 [ Links ]
33.Ashutosh RT, Andrew OW, Greer AB, Gary RC. Prevalence odds ratio versus prevalence ratio: Choice comes with consequences. Stat Med. 2016;35(30):5730-5735. https://doi.org/10.1002/sim.7059 [ Links ]
34.Robbins HA, Pfeiffer RM, Shiels MS, Li J, Hall HI, Engels EA. Excess cancers among HIV-infected people in the United States. J Natl Cancer Inst. 2015;107(4), article #dju503. https://doi.org/10.1093/jnci/dju503 [ Links ]
35.Dryden-Peterson S, Medhin H, Kebabonye-Pusoentsi M, et al. Cancer incidence following expansion of HIV treatment in Botswana. PLoS One. 2015;10(8):e0135602. https://doi.org/10.1371/journal.pone.0135602 [ Links ]
36.Mehta S, Garg A, Gupta LK, et al. Kaposi's sarcoma as a presenting manifestation of HIV. Indian J Sex Transm Dis. 2011;32(2):108. https://doi.org/10.4103/0253-7184.85415 [ Links ]
37.Ahmed A, Muktar HM, Bugaje MA. Epidemiological and clinical features of AIDS-associated Kaposi's sarcoma in Northern Nigeria. Archiv Int Surg. 2013;3(1):29. https://doi.org/10.4103/2278-9596.117132 [ Links ]
38.Chalya PL, Mbunda F, Rambau PF, et al. Kaposi's sarcoma: A 10-year experience with 248 patients at a single tertiary care hospital in Tanzania. BMC Res Notes. 2015;8(1):440. https://doi.org/10.1186/s13104-015-1348-9 [ Links ]
39.Biryahwaho B, Dollard SC, Pfeiffer RM, et al. Sex and geographic patterns of human herpesvirus 8 infection in a nationally representative population-based sample in Uganda. J Infect Dis. 2010;202(9):1347-1353. https://doi.org/10.1086/656525 [ Links ]
40.Ngalamika O, Minhas V, Wood C. Kaposi's sarcoma at the University Teaching Hospital, Lusaka, Zambia in the antiretroviral therapy era. Int J Cancer. 2015;136(5):1241. https://doi.org/10.1002/ijc.29184 [ Links ]
41.Tukei VJ, Kekitiinwa A, Beasley RP. Prevalence and outcome of HIV-associated malignancies among children. AIDS. 2011;25(14):1789-1793. https://doi.org/10.1097/QAD.0b013e3283498115 [ Links ]
42.Begré L, Rohner E, Mbulaiteye SM, Egger M, Bohlius J. Is human herpesvirus 8 infection more common in men than in women? Systematic review and meta-analysis. Int J Cancer. 2016;139(4):776-783. https://doi.org/10.1002/ijc.30129 [ Links ]
43.National Cancer Control Strategy. Ministry of Health, Kenya. Strategy 2017 - 2022 Nairobi. 2017. [ Links ]
44.Achenbach CJ, Harrington RD, Dhanireddy S, Crane HM, Casper C, Kitahata MM. Paradoxical immune reconstitution inflammatory syndrome in HIV-infected patients treated with combination antiretroviral therapy after AIDS-defining opportunistic infection. Clin Infect Dis. 2011;54(3):424-433. https://doi.org/10.1093/cid/cir802 [ Links ]
45.Letang E, Lewis JJ, Bower M, et al. Immune reconstitution inflammatory syndrome associated with Kaposi sarcoma: Higher incidence and mortality in Africa than in the UK. AIDS. 2013;27(10):1603-1613. https://doi.org/10.1097/QAD.0b013e328360a5a1 [ Links ]
46.Kowalkowski MA, Kramer JR, Richardson PR, Suteria I, Chiao EY. Use of boosted protease inhibitors reduces Kaposi sarcoma incidence among male veterans with HIV infection. Clin Infect Dis. 2015;60(9):1405-1414. https://doi.org/10.1093/cid/civ012 [ Links ]
47.Borok M, Fiorillo S, Gudza I, et al. Evaluation of plasma human herpesvirus 8 DNA as a marker of clinical outcomes during antiretroviral therapy for AIDS-related Kaposi sarcoma in Zimbabwe. Clin Infect Dis. 2010;51(3):342-349. https://doi.org/10.1086/654800 [ Links ]
48.Mosam A, Shaik F, Uldrick TS, et al. A randomized controlled trial of highly active antiretroviral therapy ver-sus highly active antiretroviral therapy and chemotherapy in therapy-naive patients with HIV-associated Kaposi sarcoma in South Africa. J Acquir Immune Defic Syndr. 2012;60(2):150-157. https://doi.org/10.1097/QAI.0b013e318251aedd [ Links ]
49.Gbabe OF, Okwundu CI, Dedicoat M, Freeman EE. Treatment of severe or progressive Kaposi's sarcoma in HIV-infected adults. Cochrane Database Syst Rev. 2014;(9);CD003256. https://doi.org/10.1002/14651858.CD003256.pub2 [ Links ]
50.Krown SE, Roy D, Lee JY, et al. Rapamycin with antiretroviral therapy in AIDS-associated Kaposi sarcoma: An AIDS Malignancy Consortium study. J Acquir Immune Defic Syndr. 2012;59(5):447. https://doi.org/10.1097/QAI.0b013e31823e7884 [ Links ]
51.Krell J, Stebbing J. Broader implications of a stage-guided stratified therapeutic approach for AIDS-related Kaposi's sarcoma. J Clin Oncol. 2014;32(5):373. https://doi.org/10.1200/JCO.2013.53.7126 [ Links ]
52.Chinula L, Moses A, Gopal S. HIV-associated malignancies in sub-Saharan Africa: Progress, challenges, op-portunities. Curr Opin HIV AIDS. 2017;12(1):89. https://doi.org/10.1097/COH.0000000000000329 [ Links ]
53.Vaishnani JB, Bosamiya SS, Momin AM. Kaposi's sarcoma: A presenting sign of HIV. Indian J Der-matol Venereol Leprol. 2010;76(2):215. https://doi.org/10.4103/0378-6323.60542 [ Links ]
54.Fulciniti F, De Chiara A, Apice G, et al. Fine-needle cytology of Kaposi's sarcoma in an intramammarylymphnode: Report of one case. Diagn Cytopathol. 2012;40(S2):E149-E152. https://doi.org/10.1002/dc.21783 [ Links ]
55.Ouyang X, Zeng Y, Fu B, et al. Genotypic analysis of Kaposi's sarcoma-associated herpesvirus from patients with Kaposi's sarcoma in Xinjiang, China. Viruses. 2014;6(12):4800-4810. https://doi.org/10.3390/v6124800 [ Links ]
56.Van Bogaert LJ. Clinicopathological proficiency in the diagnosis of Kaposi's sarcoma. ISRN AIDS. 2012(5); Article #565463, 7 pages doi:10.5402/2012/565463 [ Links ]
Correspondence:
Rodgers Demba
dembanorman@gmail.com
Received: 01 Dec. 2018
Accepted: 15 May 2020
Published: 25 Aug. 2020
ORIGINAL RESEARCH
Prevalence and risk factors for red blood cell alloimmunisation among sickle cell patients in Mwanza City, Tanzania
Erius TebukaI, II; Mwesige CharlesIII; Jeffer O. BhukoI, II, IV
IDepartment of Pathology, Weill Bugando School of Medicine, Mwanza, United Republic of Tanzania
IIBugando Medical Centre, Mwanza, United Republic of Tanzania
IIICentral Pathology Laboratory, Bugando Medical Centre, Department of Hematology, Mwanza, United Republic of Tanzania
IVMwanza Region Health Center, Mwanza, United Republic of Tanzania
ABSTRACT
BACKGROUND: Erythrocyte alloimmunisation can lead to complications such as delayed haemolytic transfusion reaction
OBJECTIVE: This study investigated the prevalence of and risk factors for red blood cell alloimmunisation among multiply transfused sickle cell disease (SCD) patients in Mwanza City, Tanzania
METHODS: From May 2017 to July 2017, this descriptive, cross-sectional, hospital-based study enrolled 200 participants with SCD who had received at least two units of blood in the previous year. Blood count was performed using a Sysmex haematology analyser. Antibody screening was done by the tube method using a panel of three screening cells with known antigenicity
RESULTS: Of the 200 patients enrolled, 108 (54%) were female. The median age was 4.5 years (interquartile range [IQR] = 6), the median number of transfusions was 3 (IQR = 1), and the median pre-transfusion haemoglobin level was 6.6 g/dl (IQR = 2.7). Prevalence of alloimmunisation was 8.5% (17/200) with immunoglobulin G, and one patient developed cold immunoglobulin M antibodies. Blood groups reported were Rhesus C and E, Kell, Kidd and Duffy. There was no statistically significant association between the number of transfusions and the risk of alloimmunisation
CONCLUSION: The rate of alloimmunisation in multiply transfused SCD patients was 8.5% and higher than other studies in East Africa. Thus, there is a need for extensive red blood cell screening and matching to minimize alloimmunisation and risk of delayed haemolytic transfusion reaction, particularly in SCD and chronically transfused patients
Keywords: sickle cell disease; alloimmunisation; alloantibody; screening cells; Bugando Medical Centre; Catholic University of Health and Allied Sciences; red blood cells.
Introduction
Sickle cell disease (SCD) is an inherited haemoglobin disorder; it is a genetic disease with high prevalence in the equatorial regions of Africa, Arabia, Europe, and India. Globally, approximately 300 000 people are born with SCD annually.1
Blood transfusions are necessary for the care and treatment of patients with SCD.2,3 In Africa, including Tanzania, and the Middle East, the ABO and Rhesus D blood grouping system are as the test parameters for blood transfusion, neglecting other red blood cell surface antigens, which are considered minority blood groups. However, this can cause serious complications, including alloimmunisation in SCD patients, once a transfusion is done, without a thorough and complete screening of the antigenicity of both the donor and the recipient.4
Alloimmunisation is the body's response to foreign antigens after being subjected to cells or tissues with different antigenicity.5 Complications of alloimmunisation include life-threatening conditions such as delayed hemolytic transfusion reactions, immediate agglutination, hyper hemolysis2 and autoimmune responses in individuals having blood transfusions, especially SCD patients.
Studies have shown that antigenicity matching, for SCD and chronically transfused patients, is important for decreasing the frequency of alloimmunisation and its associated complications6. The presence of alloantibodies is a major complication in SCD, presenting challenges for medical management. Antigen matching beyond the standard ABO blood grouping system and Rhesus typing has reduced complication rates.6 According to Bashawri et al., race and ethnicity could be a risk factor for alloimmunisation in sickle cell anaemia patients.7 Additionally, failure to screen for minor antigens such as Kidd, Duffy, and MNS blood groups, might cause a mismatch and subsequent alloimmunisation in blood recipients.8.
Current practice in Tanzania is forward grouping, which screens for blood groups ABO and Rhesus D. However, there are currently no guidelines for blood group screening at the National Blood Transfusion Services. Thus, patients are typically transfused without an extensive matching for compatibility. For example, no screening for Kell antigens is conducted. Additionally, little is known about the extent to which alloantibodies affect sickle cell patients locally.
This study aimed to examine the prevalence of developing red blood cell alloimmunisation among multiply transfused SCD patients and identify its associated risk factors, especially in Mwanza (Lake Zone). This will, in turn, be valuable for the setting up of guidelines for extensive donor and recipient typing, especially for transfusion-dependent patients at Bugando Medical Centre (BMC)/Lake Zone National Blood Transfusion Services laboratories.
Methods
Ethical considerations
Ethical clearance was received from the Catholic University of Health and Allied Sciences and BMC joint research committee (ethical clearance number: 323/2017). Permission to work in the BMC Central Pathology Laboratory was also sought from the Laboratory Director and Manager. Written informed consent was sought from both inpatient and outpatient SCD with multiple transfusions before including them in the study.
Study design
This was a cross-sectional study conducted from May 2017 to July 2017 at the BMC, Mwanza City (Lake Zone), Tanzania. Participants were inpatients and outpatients with SCD who attended the BMC during the study period and consented to participate. Patients were recruited until the estimated minimum sample size of 200 SCD patients was reached; the sample size was estimated using the Kishi Lisle Formula. The study included all SCD patients attending BMC inpatient and outpatient departments for transfusion therapy purposes who had received at least two units of blood during the previous year The study excluded patients with no blood transfusion history and patients who did not consent to participate. A structured questionnaire was completed by the parent or guardian of the child and laboratory records confirmed SCD, number of transfusions and interval of blood transfusion. The questionnaire was used to gather the demographic and medical history information of selected participants.
Sample collection
One 4-ml blood sample was collected from each patient by phlebotomists at the Central Pathology Laboratory at BMC into ethyldiammine tetraacetate tubes to avoid agglutination and preserve red blood cell (RBC) antigenicity. Samples were stored at 2 °C - 6 °C refrigeration for not more than 3 days.
Laboratory analysis
Alloantiboy detection - Indirect Coombs test
The presence of alloantibodies was determined by assessing antigen-antibody agglutination in patient serum where agglutination indicates incompatibility of patient's serum antibodies with commercially purchased red cells. Three commercially purchased red cell-antibody screening cell panels were used for screening the parted blood cells (screen cell 1, product code R1WR1; screen cell 2, product code R2R2; and screen cell 3, product code rr) (Lorne Laboratories, Reading, Berkshire, United Kingdom). Screening for the different RBCs antigens was done as described by the manufacturer. Screen cell 1 had C, D, e, Cw, M, N, s, P1, K, k, Leb, Fya, Jka, and Jkb red cells. Screen cell 2 had D, E, c, M, S, P1, k, Leb, Fyb, and Jkb red cells, and screen cell 3 had c, e, N, s, P1, k, Kpa, Lea, Fyb, and Jka red cells (Table 1). A mixture of patient serum and the commercial red cell-antibody screening cells was centrifuged for 10 minutes at room temperature (25 °C). Tubes were checked for agglutination confirming cold alloantibodies (immunoglobulin M). Then Low ionic strength solution was added to enhance antigen-antibody reaction, followed by incubation at 37 °C for 15 min to detect warm antibodies. After incubation, a cell wash was done by using a washing buffer to remove unbounded antibodies. Finally, anti-human globulin (Coombs reagent) was added to the tubes to detect the presence of alloantibodies. The tubes were then centrifuged at 1500 revolutions per minute for 3 min. The centrifuged mixture of patient serum, commercial red cells and anti-human globulin was read microscopically to assess the presence of agglutination. Tubes with agglutination were considered 'positive', whereas tubes with no agglutination were considered 'negative'. Agglutination was classified as 'strong' when agglutination could be seen macroscopically or as 'mild' when agglutination could only be confirmed microscopically. Alloantibodies were then classified as 'warm' alloantibodies (antibodies that react at or near 37 °C) or as 'cold' alloantibodies (antibodies that react below 37 °C).
Autoantibody detection - direct antiglobulin test
To rule out autoantibodies, which were not part of the study but can affect test results, a direct antiglobulin test was done. Briefly, the patient's red blood cells were washed three times with normal saline. Two drops of anti-human globulin (Coombs reagent) was added to the washed cells, mixed and centrifuged at 1500 revolutions per minute for 3 min. The centrifuged mixture of patient RBC and anti-human globulin was read microscopically for agglutination. Tubes with agglutination were considered 'positive' for autoantibodies, whereas tubes with no agglutination were considered 'negative' for autoantibodies. To rule out anti-human globulin non-reactivity and validate negative results (tubes without agglutination), pre-sensitised commercial RBCs (Lorne Laboratories; Reading, Berkshire, United Kingdom) coated with short-armed antibodies were added. If agglutination was observed, which was expected, then anti-human globulin was reactive and the patient's result was considered valid.
Data management and statistical analysis
After cross-checking, data were transferred directly to Statistical Package for Social Sciences software (International Business Machines Corporation, Chicago, Illinois, United States) version 20 and analysed. Continuous data were presented using medians and interquartile range, and the Chi-square was used to test associations for categories available. P < 0.05 was considered statistically significant.
Results
The median age of the study participants was 4.5 years (range: 0-26 years) (Table 2). Of the 200 patients enrolled, 17 patients were positive for alloantibodies. No autoantibodies were detected in any patient; all direct antiglobulin tests were negative. One patient developed immunoglobulin M cold antibodies and was excluded from downstream analysis, but did not experience the consequent nuisance hemolysis.
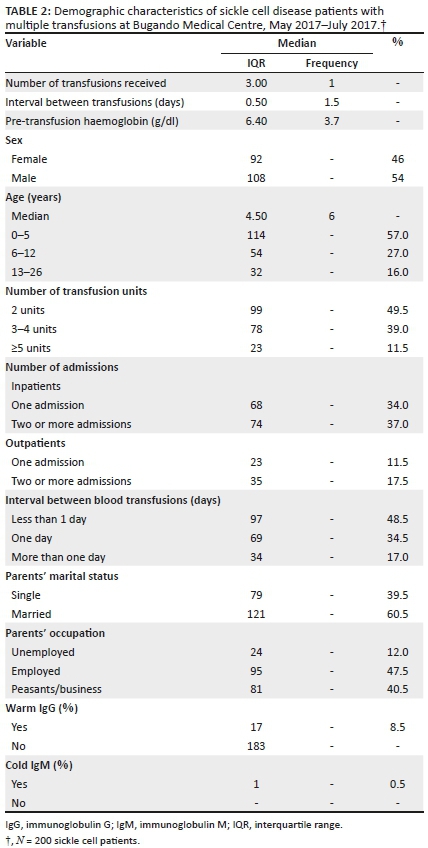
A total of 17 (8.5%) patients developed 23 warm alloantibodies and 183 (91.5%) tested negative for warm alloantibodies (Table 3). Of the 17 patients that developed warm alloantibodies, 11 had single alloantibodies and six had double alloantibodies. Of the 23 identified alloantibodies, 87% (20/23) showed mild agglutination, and 13% (3/20) showed strong agglutination. Among the alloimmunised patients, the number of transfusions ranged from 3 units to 6 units within the previous year. There was no significant statistical association between the number of transfusions and the risk of alloimmunisation [p = 0.07]. The median number of transfusions for patients without alloantibodies was 2 (median: 1.0) units of blood. All 183 patients who were negative for warm alloantibodies received ≤ 2 transfusions.
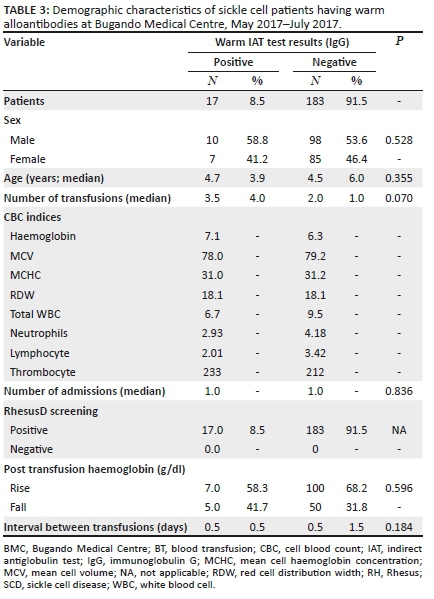
Of the 23 identified alloantibodies, 12 were of the Rhesus group (anti-E [2], anti-C [6], anti-c [3], anti-e [1]), 6 were of the Kell group (anti-K), 2 were of the MNS group (anti-M), 1 was of the Kidd group (Jka), 1 was of the Duffy group (Fya) and 1 was of the Lewis group (Lea) (Table 4).
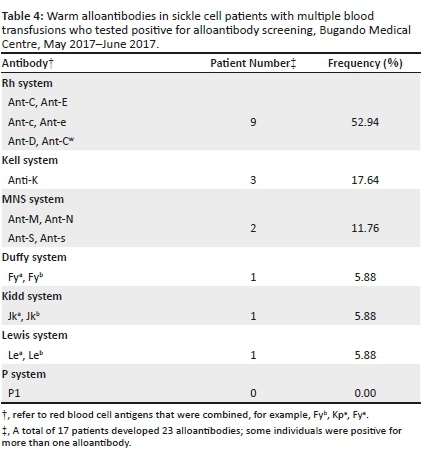
Discussion
The alloimmunisation rate in the current study is higher than the 6.1% alloimmunisation rate reported by Natukunda et al. in Mulago Kampala Uganda and the 4.1% rate reported by Meda et al. in Muhimbili Dar es salaam, Tanzania.9,10 The differences in these rates could be attributed to differences in the median number of blood transfusions, which was lower (mean, 2(0) units) in the other two studies, whereas the mean number of transfusions at BMC was 3(1) units. The alloimmunisation rate of the current study was comparable to that reported by Ugwe et al.3 of 9.3%. The study included 145 SCD patients in Nigeria; blood transfusion was found to be significantly associated with alloimmunisation (p = 0.027 where p < 0.05). As with our study, sex was not statistically significantly associated with the risk of alloimmunisation in all three studies.
As of 2018, Tanzania was the third leading country in Africa for sickle cell anaemia after the Democratic Republic of the Congo and Nigeria.11 The detection of alloantibodies of the Kell, MNS, Kidd, Duffy and Lewis blood groups is common12 and is corroborated by our study as Anti-C, anti-c, Anti-E, anti-e, Anti-K were the most common alloantibodies detected. Thus, these RBC antigens should be included in extended blood typing to detect alloantibodies to these groups. Warm alloantibodies (often IgG) are of clinical importance because they haemolyse red blood cells at body temperature whereas cold antibodies (IgM) also known as nuisance antibodies rarely haemolyse red blood cells in vivo due to temperature inactivation.13
In Tanzania, the Lake Zone area is leading with SCD patients (BMC, Mwanza) hence the numerous transfusions as part of their clinical management14. Thus, the prevalence and risk factors for red blood cell alloimmunisation in this locale needs to be identified. This study found an alloimmunisation rate of 8.5% among SCD patients at BMC in Mwanza, Tanzania, but found no significant association between alloimmunisation and the increased number of transfusions.
Limitations
Multiple transfusion is a risk factor for alloimmunisation, especially in sickle cell disease patients. However, in our study, multiply transfusion was not significantly associated with alloantibody development. This could be, in part, due to the small sample size, under-reporting and maybe because all participants had received blood transfusion at least once. More than half of the participants' guardians or parents could not remember the actual number of blood transfusions a child had taken before attending BMC, thus influencing our final results. Availability of commercial red cells is a problem because there are few Haematological laboratories worldwide that can manufacture these red cells to cover the demands.
Our antibody screening/identification approach might be prohibitive for extensive antibody screening in institutions with larger samples requiring shorter turnaround time because it is labour intensive and time-consuming. Other methods like Gel, SPRCA, or even automated methods can be used as these are faster, thus reducing laboratory turnaround time.
Recommendations
Due to the common occurrence of alloantibodies and its detection within multiply transfused SCD patients in BMC, the BMC blood bank and Zonal National Blood Transfusion Centre should obtain facilities and expertise that will allow for extensive phenotypic blood typing and matching to minimise the development of alloantibodies and effectively minimize risks of delayed haemolytic transfusion reaction in SCD and chronically transfused patients.
Conclusion
The rate of alloimmunisation in multiply transfused SCD patients was 8.5% and higher than other studies from East and West Africa. Thus, there is the need for extensive red blood cell screening and matching to minimize alloimmunisation and risk of delayed haemolytic transfusion reaction, particularly in SCD and chronically transfused patients.
Acknowledgements
The authors send a special thanks to their families and Sarah Bhuko for their endurance and unyielding support during our research work. The authors acknowledge the support of Lorne Laboratories in the United Kingdom for supplying reagents for this experimental paper and the technical support from Bugando Referral Hospital-CPL department. The authors also offer their appreciation to the Higher Education Students Loans Board for funding this research work. Last but not least, the authors would like to extend their sincere gratitude and appreciation to all classmates who helped in one way or another during this research work.
Competing interests
The authors declare that they have no financial or personal relationships that may have inappropriately influenced them in writing this paper.
Authors' contributions
J.O.B. and E.T. conceived and designed the study. J.O.B, E.T. and M.C. contributed reagents/materials. J.O.B. and M.C. collected the data, and the data analysis was done by J.O.B. and E.T. J.O.B. wrote the manuscript. All authors read and approved the final manuscript.
Sources of support
This study was funded by Higher Education Students Loans Board, as a part of the degree awarded to Jeffer Bhuko by Catholic University of Health and Allied Sciences, Mwanza, Tanzania. Reagents are commercial red cells which were purchased from Lorne Laboratories UK, and these were purchased with a fund from the Higher Education Students Loans Board.
Data availability
Data sharing does not apply to this article as no new data were created or analysed in this study.
Disclaimer
The views and opinions expressed in this article are those of the authors and do not necessarily reflect the official policy or position of any affiliated agency of the authors.
References
1.Kangiwa U, Ibegbulam O, Ocheni S, Madu A, Mohammed N. Pattern and prevelence of alloimmunization in multiply transfused patients with sickle cell disease in Nigeria. Biomarker Res. 2015;3(1):26. https://doi.org/10.1186/s40364-015-0050-3 [ Links ]
2.Yazdanbakhsh K, Ware RE, Noizat-Pirenne F. Red blood cell alloimmunization in sickle cell disease: Pathophysiology, risk factors, and transfusion management. Blood. 2012;120(3):528-537. https://doi.org/10.1182/blood-2011-11-327361 [ Links ]
3.Ugwu N, Awodu O, Bazuaye G, Okoye A. Red cell alloimmunization in multitransfused patients with sickle cell anemia in Benin City, Nigeria. Nigerian J Clin Pract. 2015;18(4):522-526. https://doi.org/10.4103/1119-3077.154204 [ Links ]
4.Heddle NM, Soutar RL, O'hoski PL, et al. A prospective study to determine the frequency and clinical significance of alloimmunisation post-transfusion. Br J Haematol. 1995;91(4):1000-1005. https://doi.org/10.1111/j.1365-2141.1995.tb05425.x [ Links ]
5.Goding JW. Monoclonal antibodies: Principles and practice. London: Academic Press; 1996. https://books.google.co.tz/books?hl=en&lr=&id=jPk4ZY4CnQQC&oi=fnd&pg=PP1&dq=Goding+JW .+Monoclonal+antibodies:+Principles+and+practice.+Academic+Press&ots=4eztgTMgFr&sig=pWmoLtkhU-aF2qAnX7PmTox3oy4&redir_esc=y#v=onepage&q=Goding%20JW.%20Monoclonal%20antibodies %3A%20Principles%20and%20practice.%20Academic%20Press&f=false [ Links ]
6.Miller ST, Kimr D, Styles LA, Dampier CD, Roseff SD. Red blood cell alloimmunization in sickle cell disease: Prevalence in 2010. Transfusion. 2013;53(4):704-709. https://doi.org/10.1111/j.1537-2995.2012.03796.x [ Links ]
7.Bashawri L. Red cell alloimmunization in sickle-cell anaemia patients. Eastern Mediterranean Health J. 2007;13(5):1181-1189. https://doi.org/10.26719/2007.13.5.1181 [ Links ]
8.Chou ST, Jackson T, Vege S, Smith-Whitley K, Friedman DF, Westhoff CM. High prevalence of red blood cell alloimmunization in sickle cell disease despite transfusion from Rh-matched minority donors. Blood. Am Soc Hematol. 2013;122:1062-1071. https://doi.org/10.1182/blood-2013-03-490623 [ Links ]
9.Natukunda B, Schonewille H, Ndugwa C, Brand A. Red blood cell alloimmunization in sickle cell disease patients in Uganda. Transfusion. 2010;50(1):20-25. https://doi.org/10.1111/j.1537-2995.2009.02435 [ Links ]
10.Meda E, Magesa P, Marlow T, Reid C, Roberts D, Makani J. Red blood cell alloimmunization in sickle cell disease patients in Tanzania. East Afr J Public Health. 2014;11(2):775-780. https://doi.org/10.1016/j.ijans.2015.08.002 [ Links ]
11.Ambrose EE, Makani J, Chami N, et al. High birth prevalence of sickle cell disease in Northwestern Tanzania. Pediatr Blood Cancer. 2018;65(1):e26735. https://doi.org/10.1002/pbc.26735 [ Links ]
12.Sihler KC, Napolitano LM. Complications of massive transfusion. Vol. 137, Chest. American College of Chest Physicians; 2010. p. 209-220. https://doi.org/10.1378/chest.09-0252 [ Links ]
13.Sokol RJ, Hewitt S, Stamps BK. Autoimmune Haemolysis: Mixed Warm and Cold Antibody Type. Acta Haematol [Internet]. 1983;69(4):266-274. https://doi.org/10.1159/000206903 [ Links ]
14.Thakral B, Saluja K, Sharma RR, Marwaha N. Phenotype frequencies of blood group systems (Rh, Kell, Kidd, Duffy, MNS, P, Lewis, and Lutheran) in north Indian blood donors. Transfus Apher Sci. 2010 Aug 1;43(1):17-22. https://doi.org/10.1016/j.transci.2010.05.006 [ Links ]
Correspondence:
Jeffer Bhuko
jefferson.othman1994@gmail.com
Received: 01 May 2018
Accepted: 05 Mar. 2019
Published: 10 Sept. 2020
REVIEW ARTICLE
The network approach to laboratory procurement and supply chain management: Addressing the system issues to enhance HIV viral load scale-up
Jason WilliamsI; Dianna EdgilI; Matthew WattleworthII; Clement NdongmoII; Joel KuritskyI
ISupply Chain Division, United States Agency for International Development (USAID), Crystal City, Virginia, United States
IIGlobal Health Supply Chain Program, Procurement and Supply Management (GHSC-PSM), Arlington, Virginia, United States
ABSTRACT
Investment in viral load scale-up in order to control the HIV epidemic and meet the Joint United Nations Programme on HIV and AIDS (UNAIDS) '90-90-90' goals has prompted the President's Emergency Plan for AIDS Relief and countries to increase their investment in viral load and infant virological testing. This has resulted in the increased procurement of molecular-based instruments, with many countries having challenges to effectively procure and place these products. In response to these challenges, the global laboratory stakeholder community has developed an informed 'network approach' to guide placement strategies. This article defines and describes the 'network approach' for laboratory procurement and supply chain management to assist countries in developing a strategic instrument procurement and placement strategy. The four key pillars of the approach should be performed in a stepwise fashion, with regular reviews. The approach is comprised of (1) laboratory network optimisation, (2) forecasting and supply planning, (3) the development of effective procurement and strategic sourcing to develop 'all-inclusive' contracts that provide transparent pricing, and the establishment of clear service and maintenance expectations and key performance indicators and (4) performance management to increase communication and planning, and promote issue resolution. Investments in the network approach will enable countries to strengthen laboratory systems and ready them for future laboratory needs. These disease-agnostic networks will be poised to improve overall national disease surveillance and assist countries in responding to disease outbreaks and other chronic diseases.
Keywords: laboratory networks; molecular scale-up; optimisation; supply chain; laboratory.
Background
Of the 36.9 million people living with HIV, approximately half (21.7 million) are on antiretroviral therapy, and of those, four out of five are virally suppressed.1 Ensuring patients are on the most effective treatments relies on the availability and use of viral load (VL) testing. For this to be successful, clinicians must order the test, samples must be transported to the laboratory and results must be returned. The achievement of the third '90' of the '90-90-90' strategy of the Joint United Nations Programme on HIV and AIDS (UNAIDS), to ensure that 90% of patients that are on HIV treatment are virally suppressed, depends on the scale-up of laboratory capacity with an effective sample transport network and an efficient laboratory-clinic interface that facilitates responses to patient management issues related to adherence and treatment failure.
In 2013, the World Health Organization included VL monitoring in its treatment guidelines, with subsequent guidance and a recommendation for its use in 2014 and 2015.2,3,4 The addition of VL testing as the cornerstone of the UNAIDS, '90-90-90' strategy has resulted in an investment in VL testing globally.5 Investments have been made to assist ministries of health in revising treatment policies, building laboratory capacity, and training and sensitising clinicians and patients on testing. To facilitate scale-up, there has been an effort to increase efficiencies by promoting procurement coordination between donors, to improve transparent pricing for reagents, and to implement procurement principles to address service and maintenance. The goal for coordination is to create a network of diagnostic capability that is nested within a broader public health response towards laboratory development.
As countries have attempted to take VL testing to scale, reoccurring challenges continue to surface, which include difficulty with procurement and sample transport, delays in the return of results and the need to increase clinical demand.6,7,8 These challenges have an impact on the ability to increase testing and ensure quality services. In order to address this, we promote a 'network approach'. By this we mean the use of a systematic strategy that aligns capacity with utilisation, promotes efficiency in the procurement and placement of machines, enables collaboration between donors and countries, and focuses on the development of efficient sample transport and result return. The purpose of this article is to identify the key aspects of this approach and provide critical considerations for countries to improve performance and create network efficiencies in order to reach their diagnostic goals.
Excess laboratory capacity
In most countries, instrument capacity is higher than needed, requiring significant growth in testing in order for these products to be optimally used. Even with a phased approach to the scale-up of VL testing, as recommended by the World Health Organization,3 only a portion of coverage goals have been achieved. In Zimbabwe, for example, the national VL testing coverage target was established at 21% in 2015, but only 5.6% coverage was achieved by year's end, largely due to challenges with resource mobilisation and coordination, equipment procurement and specimen transport.9 By June 2016, of seven countries surveyed, four (Tanzania, Côte d'Ivoire, Malawi and Uganda) were performing less than 25% of the necessary VL tests needed for patients on antiretroviral therapy.10 In 2016, Médecins Sans Frontières (MSF) estimated the coverage of VL monitoring across seven sub-Saharan African countries to be variable, ranging between 32% and 91%.6 Data on infant virological testing (IVT) show less than 50% coverage within the first six weeks of life in many sub-Saharan African countries.7
The World Health Organization's survey of data on diagnostic instruments from 2013, which assessed the scale-up of VL testing in 127 countries, showed that VL testing capacity was available to conduct 1.2 tests per person on antiretroviral therapy, but only 0.5 tests per person were conducted. This results in a capacity utilisation rate of only 36.5%.11 More recently, reports from major molecular instrument manufacturers demonstrate that countries continue to increase the number of instruments. Between May 2016 and May 2018, testing capacity in 21 African countries increased from over 15 million to 20.5 million tests, with an increase of 164 large molecular instruments (manufacturer reported, see Figure 1 and Figure 2). In most countries, existing instrument numbers and capacity are not limiting factors associated with the scale-up of VL testing.
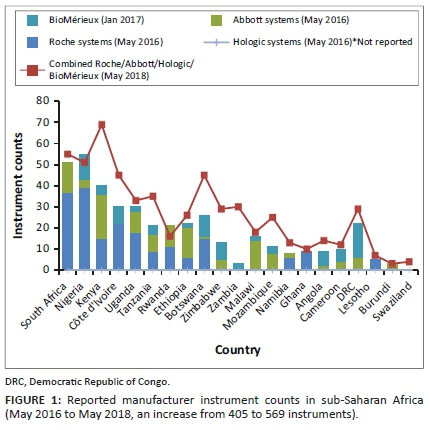

Past scale-up efforts for CD4 testing resulted in uncoordinated procurement and underutilisation of instruments, suboptimal network expansion and a lack of service maintenance coverage across laboratory networks.11,12 As VL testing replaces CD4 in most sub-Saharan countries to monitor antiretroviral therapy, many of these issues are again resurfacing, including uncoordinated instrument management strategies.6,13 Lessons learned from the implementation of CD4 testing indicate the need for a more efficient model of procurement and service provision for VL and IVT programmes.
Challenges with the scale-up of viral load testing in sub-Saharan Africa
We have identified four challenges that programmes must address in order to take VL testing to scale: (1) donor and stakeholder coordination and transparent pricing, (2) inconsistency of reagent availability (forecasting and supply planning), (3) ensuring functional instrumentation and (4) suboptimal laboratory network planning and sample transport strategies.
Challenge 1 - Donor and stakeholder coordination and transparent pricing
Coordination between partners and governments to ensure the distribution of resources according to programme needs has been challenging, frequently resulting in the over-procurement or under-procurement of instruments and reagents that do not meet the testing needs of programmes.14,15
One core aspect of the alignment of effective global procurement is to create transparency in pricing, leveraging volumes and donor investments as part of negotiating influence. Pricing variability across countries has been described as a limiting factor to scale-up,16 creating challenges with budgeting. Many countries with budget limitations have historically paid more per test due to lower testing volumes, with more difficult infrastructural challenges to overcome as part of service delivery. Without coordination, donors can inadvertently undermine the ability to negotiate cost-effective testing strategies, with an end result of diminishing testing pools across instrument types, limiting negotiating influence and undermining volume pricing for tests performed nationally.
To clearly understand pricing, it is important to unpack costs for fair comparisons. For example, per test costs could be calculated based on the primary reagent only, or may include reagents, consumables, shipping and distribution. Pricing depends on volumes, instrument type, sample type, local versus international procurement, mode of import, inclusive service, maintenance costs, logistics costs, vendor management of reagent inventories and reagent rental or leasing arrangements. All of these components influence pricing for comparative purposes.
The Global Fund (GF) has negotiated global access pricing for low and middle-income countries. The two most commonly used molecular brands for VL testing and IVT are Roche Molecular Diagnostics and Abbott Molecular Inc. Commodity-related prices are set at a rate of $9.40 per test for Roche, which includes reagents and consumables, with ex-works terms (goods are available at the seller's or manufacturer's site and must be transported by the buyer), whereas Abbott's pricing is based on volumes and duration commitments.17 The Abbott's approach has resulted in pricing variability across countries of between $10.50 and $22.50 per test for core reagents, with an additional $2.50 for the necessary calibrators, controls and added consumables. This brings Abbott's pricing to between $13.50 and $23.60 per test. Yet, based on volumes and multi-year commitments as well as national negotiating influence, some countries have further reduced these prices.
It should be noted that pricing schemes offered by Roche can also have country-specific variability due to 'free carrier' pricing (where the seller arranges and pays for shipping to the country of export) included in the reagent pricing, with shipping details not separately itemised. This creates challenges during budgetary planning sessions, since it becomes difficult to predict shipping costs and ensure that the global ex-works $9.40 reagent and consumable pricing is adhered to. Transparency in total cost breakdown is needed, as there is a perception that the pricing offered is different from the GF-published $9.40 per test pricing.
Challenge 2 - Inconsistent reagent availability (forecasting and supply planning)
Reagent availability has been highlighted as one core obstacle to the scale-up of VL testing.6,7,16 Although reagent availability is a critical aspect of ensuring VL testing, stock-outs are a symptom of broader supply chain system issues and data flow challenges that have a negative impact on scale-up.
Challenge 3 - Instrument functionality due to inadequate or absent service and maintenance
Ensuring adequate service and maintenance, warranty and preventive maintenance coverage for equipment is a significant challenge. To date, instrument and vendor oversight has been managed on an instrument-by-instrument basis, with limited coordination of management strategies, sometimes independently by stakeholders in the same country. This has resulted in multiple, separate contracts for individual instruments, often negotiated on different timelines, using non-standardised terms and with limited consistency in contract oversight and management.
Key performance indicators and reporting requirements that can be used to monitor vendor performance have not historically been included in contracts. This makes adhering to existing service contracts and the monitoring of vendor performance difficult, limiting both vendor accountability and the development of appropriate maintenance strategies.
Challenge 4 - Weak laboratory and sample referral networks
Given the ever-changing laboratory network environment, sample transport and referral networks have grown organically, and do not necessarily reflect an efficient network approach. These networks quickly become outdated and require adjustments to not only reflect national needs (e.g. the addition of other diagnostics demands, point-of-care, the integration of new specimens, backup sample transport in the event of equipment breakdown), but also to look for efficiencies, and possible integration. Ultimately, the effects of a fragmented sample referral network can be far-reaching, ranging from increased operational costs across the entire network to improperly placed instruments and limited instrument utilisation.
Solutions: Procurement and supply chain management
To effectively address these existing challenges, a holistic approach or network approach is needed, which spans four major building blocks or elements that are described below and summarised in Figure 3.
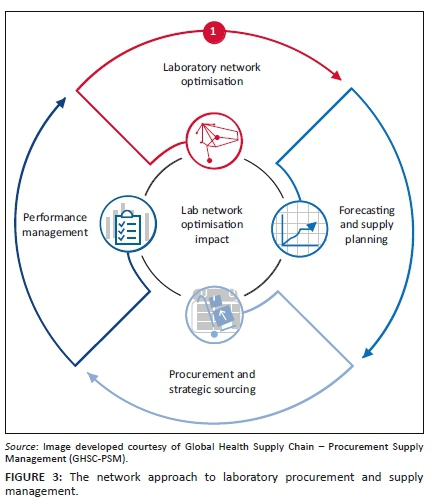
Diagnostic network optimisation
The concept behind a network approach is to shift to an all-inclusive reagent rental scheme (RRS) or reagent service scheme (RSS) that serves all existing and new instruments. This approach would be national, and not specific to a stakeholder, donor or disease. A vendor-specific instrument contract would contain terms and conditions that are informed collectively by all stakeholders. This approach would require all stakeholders to take stock of existing instruments, service contracts and procurement pricing schemes, and establish jointly renegotiated terms that take all stakeholder investments and contributions to the overall network into consideration. Revised pricing schemes could potentially include:
•A national cost and contract structure that allows for volume growth and instrument expansion within a complete network, irrespective of the disease type or programme area, and that can be accessed by all stakeholders.
•A cost structure translated into an 'all-inclusive per test cost' spread across all instruments of the same brands within the network to include:
■ Cost options as part of network expansion that would account for existing legacy instruments and the development of new contract models (e.g. leasing and rentals) that facilitate the introduction of new instruments under standardised pricing schemes
■ Inclusive service and maintenance
■ Data solutions that would include patient result transmission, as well as instrument and user performance
■ Network staff training and consistency
■ Additional technology support that could assist in site-level efficiencies (barcode use, sample processing and workflow evaluations)
■ Enhanced commodity management strategies to ensure reagent availability (to include vendor-managed inventory)
The goal of a network approach is to improve instrument utilisation by aligning capacity with demand:
•Introducing standardised national pricing schemes, irrespective of the procurement mechanism, thereby enabling continuous service contract coverage
•Providing opportunities to amortise instrument costs into reagent costs, in order to lower startup costs associated with scale-up
•Sharing and assigning the longer-term management and mitigation of risks associated with instrumentation onto manufacturers and local vendors
•Providing a no-cost option for instrument replacements due to high failure rates, capacity issues (upgrading) or even outdated technology.
A network approach focuses on developing a baseline understanding of the current national VL testing network, including capacity and equipment utilisation, then exploring more efficient network options. Once a refined network is adopted, planning and procurement must be coordinated among all stakeholders to avert the addition of more instrumentation that may not be included in the planned diagnostic network, and ensuring the constant supply of reagents and consumables. In support of coordinated planning, it is important to develop criteria for the placement of additional machines, including point-of-care or near to point-of-care platforms and higher throughput platforms which all stakeholders would be required to adhere to. Negotiated agreements should look to the bundling of services (including connectivity). Contractual requirements for data sharing (downtime, testing protocols, specimen types, etc.) will facilitate management of the network in real time and improve vendor accountability.
To advance a network approach, it is important to look beyond a lowest price per test and focus on the total cost of ownership; initial per test costs will likely be higher, but the longer-term strategy will benefit the network.
Evidence-based optimisation of laboratory network
Factors determining the success of VL and IVT testing programmes include laboratory infrastructure and instrumentation, logistics, specimen transport, clinical implementation, and monitoring and evaluation. While it is helpful to coordinate procurement and service maintenance under a network approach, a limited understanding of reagent consumption, testing demand, laboratory performance and human resource capacity can undermine the functionality of a network. In cases of network expansion or revision, it may be necessary to carry out an analysis toward the goal of optimising the network. An approach to laboratory network optimisation would focus on the use of geographical information systems mapping tools (e.g. Laboratory Efficiency and Quality Improvement Planning [LabEQIP] software and Supply Chain Guru™ - LLamasoft18,19), to map laboratory network parameters, including instrument locations and utilisation, testing demands, quality assurance, human resources, sample transport lanes, specimen types, demographic needs, costing components and partner performance data. LabEQIP is a software tool developed by United States Agency for International Development (USAID) and LLamasoft, which is managed by the Global Health Supply Chain - Procurement and Supply Management (GHSC-PSM). It is a geographical information, systems-based solution that can improve laboratory network efficiency and advance quality service delivery through data-driven optimisation and modelling. Virtual modelling, prior to instrument placement, or as part of formalising an overall shift in testing strategies, is a critical component in informing the approaches to laboratory network optimisation. LabEQIP has most often been used to strategically plan the design of laboratory networks, the placement of equipment, the planning of sample referrals and the improvement of instrument utilisation. LabEQIP and Supply Chain Guru™ have been used in Nigeria, Cameroon, Rwanda, Eswatini, Zimbabwe and Zambia with support from the President's Emergency Plan for AIDS Relief (PEPFAR), GF, the Clinton Health Access Initiative (CHAI) and GHSC-PSM, to develop virtual strategies to integrate HIV-tuberculosis sample transport, reduce instrument footprints to improve operational costs, and virtually place instruments to determine the impact on laboratory testing demands and instrument capacity requirements. LabEQIP can also be used to inform the integration of point-of-care technologies, and to assist in prioritisation and instrument rebalancing due to overburdened or underburdened testing demands.
Demand forecasting and supply planning
In the initial phase of scale-up, programmes often use demographic or target-based forecasts. A demographic forecast takes the number of patients who are on antiretroviral treatment and multiplies that number by the number of VL tests per patient; a target-based forecast does the same, but uses the national or programme annual treatment numbers. Both types of forecast invariably overestimate commodity demand, as they do not account for unreliable laboratory or logistics information systems and poor reporting, poor site-level stock management practices, uncoordinated instruments and instrument failure.6 Further, during a period of rapid scale-up, historical consumption and procurement are not reliable indicators of future consumption.
USAID and PEPFAR, through its supply chain implementing partner, GHSC-PSM, has increased procurement of VL testing reagents from just over $7 million in 2014 to nearly $90 million in 2018. A linear projection of VL testing demand based on historical procurement in 2016 would have forecast approximately $37 million of VL testing-related procurement by 2017, increasing to $47 million in 2018. Actual 2017 VL testing procurement data reflected almost $6 million in GHSC-PSM expenditures, with over $90 million in procurement moving into 2018, an underestimation of about 44% and 48% if linear projections were used (Figure 4).
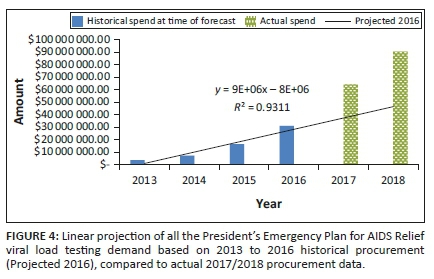
To address forecasting challenges, USAID promotes ForLab (forlabplus.com), which was developed by USAID and CHAI and is managed by GHSC-PSM, for national laboratory forecasting. ForLab has been used in more than 21 countries since its launch in 2013. ForLab includes forecasting commodity needs using a mixed methodology approach to improve accuracy and to provide consistent and greater transparency in national forecasting exercises. ForLab includes demographic and morbidity data, service statistics and logistics data on commodity consumption in an effort to triangulate multiple forecasting methods to derive a best-fit procurement plan that can be used by stakeholders to establish realistic budgets and supply planning activities.19,20,21,22,23,24 ForLab is a data-driven tool and works well when data are available and, when data are of a high quality, it can precisely predict need. However, poor site-level reporting can reduce its forecasting accuracy.
When highlighting stock-outs as a limiting factor associated with the scale-up of VL testing, it is important to acknowledge that there are many factors outside the supply chain that can impede improvements in reagent availability, which must be addressed concurrently. As programmes scale up, site-level storage space can become a challenge, causing the dispersal of reagents across various locations within a particular laboratory. Product dispersion can make routine stock management tasks more laborious and reduce reporting frequency and accuracy. As programmes scale up, it may be necessary to increase reagent distribution frequency to sites, if commodity storage is limited, for example from quarterly to monthly. For this to be successful, there is a need to ensure consistent and reliable stock status visibility. An additional factor not related to supply chains that has an impact on reagent availability includes early visibility into new instrument introductions, as without coordination additional reagents may not be available to support extra instrumentation.
In order to prevent stock-outs, programmes need effective data flow from testing sites to the central warehouse to guide inventory management practices and product distribution mechanisms. Effective supply chains are data-driven and require constant input on service delivery performance. Accurate and consistent commodity stock levels and consumption reporting improves supply chain systems, allowing for accurate forecasting, timely procurements and improved visibility for manufacturers to assist with manufacturing lead times for large order quantities. Without these consistent and reliable inputs through logistic management information systems or laboratory information management systems, it becomes increasingly difficult to prescribe effective procurement and supply chain interventions to reduce stock-out situations.
Strategic procurement and sourcing
To address pricing variability within countries, it is critical to negotiate national pricing schemes. National testing volumes should be aggregated to negotiate a consistent price that all stakeholders can achieve. Donors, host-country counterparts and manufacturers can work collaboratively with aggregated volumes to derive transparent pricing schemes and mutually agreed upon prices that include additional service offerings outside of just reagents and consumables.
Recent coordination with the GF has resulted in price transparency in Haiti, the Democratic Republic of Congo and Cameroon, with initial price reductions of approximately $21.00 to $16.50, and then further to $13.50 for reagent costs. Efforts are still in process to promote further reductions as scale-up continues in these countries, as well as to include more comprehensive service packages. This includes service, maintenance and data management, as well as standardised reporting requirements informed by agreed upon key performance indicators as part of a price-per-test scheme.
The PEPFAR has currently renegotiated all of its existing VL/EID procurement contracts to significantly lower all-inclusive pricing schemes. A formal press-release will be announced shortly after the publication of this paper. The PEPFAR has engaged GF to push further transparent pricing reductions, with additional itemised system costing options, including all-inclusive reagent rental, service and maintenance, data management systems, as well as possible vendor-managed inventory.
All future instrument investments and reagent procurement strategies should use RRS for new instruments, as well as inclusive RSS for existing instrumentation. The PEPFAR's current country operational planning technical guidance emphasises the use of RRS for instrument expansion, driving countries towards a more systems-focused approach. Currently, South Africa, Kenya, Uganda21,23 and, more recently, Mozambique, Haiti and Nigeria are taking advantage of RRS or a combination of RRS and RSS. Currently, USAID is working with GHSC-PSM to introduce more dynamic RRS agreements in Nigeria, Mozambique, Haiti and Zambia. By moving to a RRS or a RSS approach, countries can amortise their initial capital investment for the scale-up and servicing of VL-testing instruments within their reagent pricing scheme, offsetting initial scale-up costs and expanding instrument coverage, as well as ensuring complete service contract availability. In order to assist countries in this approach, USAID developed a '12 question' approach designed to help countries think through the use, placement and servicing of laboratory instruments prior to initiating procurement or RRS or RSS arrangements (Box 1, Figure 5).18
Monitoring instrument and vendor performance
When considering RRS or RSS contracts, it is critical to establish defined expectations. Contracts should be negotiated collaboratively with all stakeholders and donors. A harmonised set of key performance indicators (Table 1) should be developed and should include: minimum response times for instrument repairs, training, logistics, and instrument and end-user performance. Clear thresholds should be established for instrument failure frequencies, and service providers should be held accountable for responding to site-level failures that go beyond these established thresholds. Contracts should dictate a standardised monthly and quarterly reporting format to assist in addressing site or instrument-specific challenges, as well as vendor service delivery issues. The contract should also define at least quarterly meetings with the supplier to review performance and work collaboratively to solve problems and address any performance issues. Contracts should also clearly delineate lists of parts to be made available in-country for high-failure parts, minimum service technician requirements, possible data solutions for patient result transmission, and monitoring instrument and end-user performance.
Conclusion
The current effort to scale up VL testing and IVT has been significant. Gains have been achieved within national laboratory networks to scale up VL testing and IVT, but there is still a need to ensure sound investments in laboratory infrastructure and instrumentation, without overlooking the supportive structures of logistics, clinical components, and monitoring and evaluation protocols. There are lessons learned from past scale-up efforts for CD4 testing, with the current global strategy to ensure procurement coordination across donors, standardising and ensuring transparent pricing for reagents, and implementing general procurement principles that aim to address some of the main supply chain and service challenges. However, these global strategies must be translated into operational plans at a country level. To be successful, all stakeholders will need to embrace the full cycle of the network approach for laboratory procurement and supply chain management; take stock of existing instruments, service contracts and procurement pricing schemes; and establish jointly renegotiated terms that leverage all stakeholder investments. Countries that have successfully scaled up VL testing and IVT have focused on making these commitments and have thereby reduced the risk of equipment failure and commodity stock-outs - two critical challenges to the success of VL testing and IVT programmes.
While each of the four pillars of the network approach for procurement and supply management can support elements of the supply chain, true transformation of the laboratory network is only possible through embracing all four of the strategic pillars in a stepwise approach, with each phase in the cycle continuing to inform the next step.
In the longer term, these investments and the broader network approach will not only address some of the more immediate challenges, but will also enable countries to strengthen laboratory systems and ready themselves for implementing future laboratory needs. These disease-agnostic molecular networks will be poised to improve overall national disease surveillance and assist countries in responding to disease outbreak responses and other chronic diseases. In addition, such networks will position countries to address sustainable strategies for laboratories in future health agendas.
Acknowledgements
Competing interests
We declare that we have no financial or personal relationships that may have inappropriately influenced us in writing this article.
Authors' contributions
J.W. was the Nigeria and Zimbabwe laboratory network optimisation lead, D.E. was the Eswatini laboratory network optimisation lead, M.W. was the Zimbabwe procurement and supply management technical lead in network optimisation, and C.N. was the Eswatini procurement and supply management technical lead in network optimisation. All leads contributed to the development and implementation of the laboratory network approach strategy. All authors, including J.K., were involved in technical content review and narrative development.
Ethical considerations
This article followed all ethical standards for research without direct contact with human or animal subjects.
Sources of support
This research received no specific grant from any funding agency in the public, commercial or not-for-profit sectors.
Data availability statement
Data sharing is not applicable to this article as no new data were created or analysed in this study.
Disclaimer
The content in this manuscript is that of the authors and does not necessarily reflect the view of the United States President's Emergency Plan for AIDS Relief, the United States Agency for International Development or the United States Government.
References
1.Joint United Nations Programme on HIV and AIDS (UNAIDS). Global HIV & AIDS statistics - 2020 fact sheet [homepage on the Internet]. [cited 2018 Aug 03]. Available from: https://www.unaids.org/en/resources/fact-sheet [ Links ]
2.World Health Organization (WHO). 2013 treatment guidelines [homepage on the Internet]. [cited 2019 Feb 11]. Available from: https://apps.who.int/iris/bitstream/handle/10665/85326/9789241505734_ eng.pdf;jsessionid=371608D14CD62D7D49780E6E9FA85AD8?sequence=1 [ Links ]
3.World Health Organization (WHO). 2014 considerations for viral load implementation [homepage on the Internet]. [cited 2019 Jan 17]. Available from: https://www.who.int/hiv/pub/arv/viral-load-testing-technical-update/en/ [ Links ]
4.World Health Organization (WHO). 2015 guideline on when to start antiretroviral therapy and on pre-exposure prophylaxis for HIV [homepage on the Internet]. [cited 2019 Jan 17]. Available from: https://www.who.int/hiv/pub/guidelines/earlyrelease-arv/en/ [ Links ]
5.Joint United Nations Programme on HIV and AIDS (UNAIDS). 90/90/90 strategy [homepage on the Internet]. [cited 2019 Mar 21]. Available from: https://www.unaids.org/sites/default/files/media_asset/90-90-90_en.pdf [ Links ]
6.Médecins Sans Frontières (MSF). Report: Making viral load routine, successes and challenges in the implementation of routine HIV viral load monitoring, part I [homepage on the Internet]. The Viral Load Laboratory. 2016 [cited 2019 Jan 17]. Available from: https://www.msf.org/sites/msf.org/files/making_viral_load_routine_part_1_programmatic_strategies.pdf [ Links ]
7.Médecins Sans Frontières (MSF). Report: Making viral load routine, successes and challenges in the implementation of routine HIV viral load monitoring, part II [homepage on the Internet]. The Viral Load Laboratory. [cited 2019 Jan 17]. Available from: https://www.msf.org/sites/msf.org/files/making_viral_load_routine_part_2_the_viral_load_laboratory.pdf [ Links ]
8.Stevens W, Marshall TM. Challenges in implementing HIV load testing in South Africa. J Infect Dis. 2010;201(Suppl 1):S78-S84. https://doi.org/10.1086/650383 [ Links ]
9.Kilmarx PH, Simbi R. Progress and challenges in scaling up laboratory monitoring of HIV treatment. PLoS Med. 2016;13(8):e1002089. https://doi.org/10.1371/journal.pmed.1002089 [ Links ]
10.Lecher S, Williams J, Fonjungo PN, et al. Progress with scale-up of HIV viral load monitoring - Seven sub-Saharan African countries, January 2015-June 2016. MMWR Morb Mortal Wkly Rep. 2016;65(47):1332-1335. https://doi.org/10.15585/mmwr.mm6547a2 [ Links ]
11.Habiyambere V, Ford N, Low-Beer D, et al. Availability and use of HIV monitoring and early infant diagnosis technologies in WHO member states in 2011-2013: Analysis of annual surveys at the facility level. PLoS Med. 2016;13(8):e1002088. https://doi.org/10.1371/journal.pmed.1002088 [ Links ]
12.Edgil D, Williams J, Smith P, Kuritsky J. Optimising the laboratory supply chain: The key to effective laboratory services. Afr J Lab Med. 2014;3(1):Art. #101:1-7. https://doi.org/10.4102/ajlm.v3i1.101 [ Links ]
13.Williams J, Umaru F, Edgil D, Kuritsky J. Progress in harmonizing tiered HIV laboratory systems: Challenges and opportunities in 8 African countries. Glob Health Sci Pract. 2016;4(3):467-480. https://doi.org/10.9745/GHSP-D-16-00004 [ Links ]
14.Mwisongo A, Nabyonga-Orem J. Global health initiatives in Africa - Governance, priorities, harmonisation and alignment. BMC Health Serv Res. 2016;16(Suppl 4):212. https://doi.org/10.1186/s12913-016-1448-9 [ Links ]
15.Alemnji G, Onyebujoh P, Nkengasong JN. Improving laboratory efficiencies to scale-up HIV viral load testing. Curr Opin HIV & AIDS. 2017;12(2):165-170. https://doi.org/10.1097/COH.0000000000000346 [ Links ]
16.World Health Organization. The availability and use of diagnostics for HIV: A 2012/2013 WHO survey of low- and middle-income countries [homepage on the Internet]. 2014 [cited 2019 Feb 11]. Available from: https://apps.who.int/iris/bitstream/handle/10665/147213/9789241507905_eng.pdf?sequence=1 [ Links ]
17.HIV viral load and early infant diagnosis selection and procurement, information tool [homepage on the Internet]. Version 2. 2017 [cited 2019 Mar 21]. Available from: https://www.theglobalfund.org/media/5765/psm_viralloadearlyinfantdiagnosis _content_en.pdf?u=636679306940000000 [ Links ]
18.World Health Organization. Guidance for procurement of in vitro diagnostics and related laboratory items and equipment [homepage on the Internet]. 2nd ed. 2017 [cited 2019 Mar 21]. Available from: https://apps.who.int/iris/bitstream/10665/255577/1/9789241512558-eng.pdf [ Links ]
19.Joint United Nations Programme on HIV and AIDS (USAIDS). ForLab laboratory quantification tool and LabEQIP software tool [homepage on the Internet]. [cited 2018 Jul 30]. Available from: https://www.ghsupplychain.org/resources/other-resources [ Links ]
20.Joint United Nations Programme on HIV and AIDS (USAIDS). Deliver Project, Task Order 4. Quantification of health commodities: A guide to forecasting and supply planning for procurement. Arlington, VA: USAID; 2014 [ Links ]
21.Peter T, Zeh C, Katz Z, et al. Scaling up HIV viral load - Lessons from the large-scale implementation of HIV early infant diagnosis and CD4 testing. J Int AIDS Soc. 2017;20(Suppl 7):e25008. https://doi.org/10.1002/jia2.25008 [ Links ]
22.Global Laboratory Initiative. GLI guide to TB specimen referral systems and integrated networks [homepage on the Internet]. [cited 2019 Jul 30]. Available from: http://www.stoptb.org/wg/gli/assets/documents/GLI_Guide_specimens_web_ready.pdf [ Links ]
23.Roberts T, Cohn J, Bonner K, Hargreaves S. Scale-up of routine viral load testing in resource-poor settings: Current and future implementation challenges. Clin Infect Dis. 2016;62(8):1043-1048. https://doi.org/10.1093/cid/ciw001 [ Links ]
24.Marinucci F, Medina-Moreno S, Paterniti AD, Wattleworth M, Redfield R. Decentralization of CD4 testing in resource-limited settings: 7 years of experience in six African countries. Cytometry. Part A: J Int Soc Anal Cytol. 2011;79(5):368-374. https://doi.org/10.1002/cyto.a.21064 [ Links ]
Correspondence:
Jason Williams
jwilliams@usaid.gov
Received: 01 Apr. 2019
Accepted: 15 May 2020
Published: 13 Aug. 2020
OPINION PAPER
Establishing diagnostic training programs in resource-poor settings: The case of Sierra Leone
Lance D. Presser
Global Engagement Program, MRIGlobal, Gaithersburg, Maryland, United States
Introduction
Outbreak and initial response
The West Africa Ebola virus disease (EVD) epidemic in 2014-2016 resulted in at least 28 652 total cases (15 261 laboratory confirmed), of which at least 11 325 were fatal (case fatality rate ~40%).1 During the epidemic, most of the cases were concentrated in Liberia, Guinea, and Sierra Leone, with some cases exported to the United States, Nigeria, Mali, and other countries around the world.2
Cases of EVD began appearing in Sierra Leone in May 2014. MRIGlobal first deployed to Sierra Leone in January 2015 and has maintained a presence in the country ever since, resulting in numerous deployments for diagnostics, engineering and, now, training teams (Figure 1). MRIGlobal provided assistance to the government of Sierra Leone and international partners to implement diagnostic testing, training courses, and other outbreak-related activities (Table 1). MRIGlobal supported the national and district EVD surveillance databases and provided data for EVD surveillance, contact tracing, case investigation, et cetera. It trained staff and offered support to members of the National Rapid Response Team at the Sierra Leone Central Public Health Reference Laboratory (CPHRL). It established, managed, and staffed EVD testing laboratories in both Sierra Leone and Guinea (Figure 1). Initially, the mobile laboratory was in Moyamba, Sierra Leone, but in April 2015 it moved to Lakka in Freetown, Sierra Leone, on the same grounds as the CPHRL.

International partner training programmes in Sierra Leone
Numerous international partners developed programmes in Sierra Leone during and after the West Africa EVD outbreak. The United States Centers for Disease Control and Prevention (CDC), China CDC (CCDC), Association of Public Health Laboratories (APHL), World Health Organization, Public Health England (PHE) and a number of other organisations developed and conducted a variety of training events. The following is a brief summary of the training activities hosted by international partners in Sierra Leone.
The APHL works to build laboratory systems in the United States and globally. Its international work focuses on building national laboratory systems and expanding access to quality diagnostic testing systems. During the outbreak, APHL, in partnership with MRIGlobal, trained 26 National Rapid Response Team laboratory scientists and provided consultation regarding the National Strategic Plan of Sierra Leone's Ministry of Health and Sanitation (MoHS). The APHL training ranged broadly and included basic bacteriology courses, influenza diagnostics, etc. Each of these trainings had its own challenges. Influenza diagnostics, for example, relied upon using ABI 7500 quantitative reverse-transcriptase polymerase chain reaction machines that were not well maintained, and it was extremely challenging to get reagents shipped in a timely fashion that maintained a cold chain. The APHL closed their offices in Sierra Leone on 26 February 2019.
The United States CDC began working in Sierra Leone during the 1970s, establishing a long-running research programme on Lassa fever.3 As part of the 2014-2016 EVD outbreak response, more than 700 CDC staff served on over 1000 deployments and, in 2015, a permanent CDC country office was established to focus on the Global Health Security Agenda.4 The CDC has established and supported training programmes ranging from field epidemiology training programme to an ecology and molecular diagnostics training programme with a university in Sierra Leone whose goal is to identify the animal reservoir of the Ebola virus.5 The CDC office in Sierra Leone has not published much information on their projects in Sierra Leone; however, their office remains open and runs surveillance, capacity building and epidemiology programmes. Programmes like the 'Creation of a national infection control programme in Sierra Leone' and the continuing field epidemiology training programme are indicative of the type of successful, ongoing engagements between CDC and Sierra Leone.6
China has a presence in Sierra Leone and the CCDC was a major international partner during the outbreak. The CCDC built a Biological Safety Level 3-capable laboratory space in combination with a hospital in Jui, a suburban neighbourhood to the east of Freetown and has been operating both since the early stages of the outbreak. Multiple teams of Chinese researchers and clinicians have rotated through the facilities and have maintained a consistent presence following the end of the EVD outbreak. In a recent press release, the director of the CCDC noted that more than 60 Chinese experts have been sent to Sierra Leone, and 30 Sierra Leoneans have studied and trained in China. CCDC supports ongoing national surveillance for Ebola, dengue fever, yellow fever, Zika and Lassa fever.7
Public Health England set out to renovate multiple Sierra Leone government laboratories in Sierra Leone, including the Connaught Hospital laboratory, the largest in Freetown. The PHE training programme focused on training national laboratory staff to international safety and quality standards, while teaching principles of molecular testing for Ebola virus and other high-consequence pathogens. The training was broken down into theory training and practical training. Theory training consisted of three sections: general information, a molecular theory course lasting two and half weeks and a molecular virology short course. Theory training occurred on multiple occasions, and the usual number of trainees at each session was approximately 15. Practical training lasted six weeks and was performed at three different government laboratories across Sierra Leone. At each site,8,9 trainees were trained and had supervised work experience and competence assessments performed by the PHE trainers. Additional support and training were given on alternative assays and platforms as well as maintenance support. Unfortunately, PHE has not published any reports on their training programmes, but it is the author's opinion that the PHE trainers were of good quality and had developed a quality training programme. Public Health England is still supporting the renovated hospital laboratories. It is the author's opinion that renovating hospital laboratories provides better return on investment than the construction or renovation of central or national public health laboratories in many circumstances, including in Sierra Leone.
Challenges and future directions
Overall, there was little standardisation of programmes, materials or contact time with trainees between partner training programmes. Training materials and schedules occurred with very minimal input from the MoHS. Also, although two trainees may have similar certificates, the lack of standardisation of training programmes makes it difficult to compare skills between trainees. To this end, the author thinks it would be valuable for both the host country and partners to work together to standardise all training programmes and materials for training purposes as much as possible. The adage 'practice makes perfect' rings true in all molecular diagnostics training events and continued refreshers are extremely valuable if possible. When possible, the MoHS should require partners to use standardised procedures and assays. During the EVD outbreak, numerous organisations brought in their own proprietary assays, many of which were not commercially available. Trainees were trained on numerous assay platforms, and while this was necessary during the outbreak, it has been problematic during the post-outbreak capacity building phase. Staffing, purchasing, logistics and refresher training would all be easier to achieve with standard assays in place, used by all partners, as dictated by the MoHS.
Ideally, the MoHS should be in charge of: developing and providing training materials and standard operating procedures that are easily adaptable to all laboratories; providing individualised training assessments to guide personalised future training as well as laboratory operations refresher training on a regular basis. MoHS should also verify that implemented procedures are routinely performed. A comprehensive external quality assessment programme for all government laboratories would be an incredible accomplishment. This will more than likely happen very slowly, and there is always a risk that it may not happen at all. Therefore, it is recommended that partners organise with the MoHS to standardise and make the post-outbreak capacity building phase more efficient.
MRIGlobal training history
As the EVD outbreak resolved and EVD cases decreased, the rapid diagnostic response also evolved. The MRIGlobal mobile diagnostic laboratory was one of the laboratories that was moved (from Moyamba to Lakka). Toward the end of the outbreak, there were far fewer blood samples being tested, and as the need for urgent response diminished, the focus turned to permanent transitioning of laboratories to the MoHS and training of the MoHS National Rapid Response Team.
MRIGlobal is an independent, not-for-profit organisation that performs aspects of laboratory design, operations, biosafety and security, research and diagnostics for government, academia and industry in the United States and internationally. MRIGlobal conducted training at the mobile diagnostic laboratory at CPHRL in Lakka during the outbreak. The duration of the training was six weeks and training components included didactic and kinesthetic training, laboratory simulations and continual refresher training based on molecular diagnostics testing for EVD. A total of eight graduates were trained using a wide variety of materials. Trainees also received quality assurance, quality control and biosafety training, which were rarely included in other partner training.
MRIGlobal training programme
Disease surveillance systems in West Africa grapple with the problem of how to function, train and persist in resource-poor settings. It is vital for surveillance systems, especially surveillance systems in resource-poor settings, to increase capacity efficiently by building or repurposing infrastructure. However, often funding for infrastructure is limited and can be difficult to sustain; therefore, comprehensive training of professional staff is more likely to give a better return on investment.
With support from the United States Defense Threat Reduction Agency, and MRIGlobal, the Sierra Leone MoHS has developed a training programme to assist in disease surveillance in West Africa. The MRIGlobal molecular diagnostics training curriculum includes: PowerPoint lectures, hardcopy handouts and notes, textbooks, quizzes and exams, as well as all the physical training materials (pipettes, appropriate personal protective equipment, molecular laboratory equipment, biosafety cabinets, etc.) to fulfil an immersive molecular diagnostics (specifically EVD) training experience. The training programme utilises team mentoring (usually a team of two or three trainers) and supervision of trainees by subject matter experts, in which Sierra Leone MoHS staff are trained by MRIGlobal staff. Participants were given exit surveys throughout the training in 2015 and 2016 which showed a high degree of satisfaction with most aspects of the programme, including the length of the programme and the content (unpublished results). A key strength of the training programme is a true partnership approach, which utilises the use of onsite laboratory equipment to offer assorted training to Sierra Leone MoHS staff, and a team model for mentorship and supervision. The author believes the molecular diagnostics and disease surveillance training partnership established at the Sierra Leone CPHRL can be used as a model for sustainable capacity building and training in low-income and middle-income countries. Molecular diagnostics training included, but was not limited to, the following topics:
•Equipment overview, use, and maintenance
•Laboratory workflow process
•Pipetting
•Decontamination
•Personal protective equipment
•Biological waste disposal
•Introduction to RNA/DNA
•Introduction to virology
•Introduction to immunology
•Introduction to epidemiology
•Laboratory-acquired infections
•Quality management systems
•Specimen management
Designing a locally sustainable programme
The MRIGlobal mobile diagnostic laboratory that served as an EVD diagnostic testing laboratory during the epidemic includes a sample extraction laboratory with multiple biosafety cabinets for sample inactivation and nucleic acid extraction, a reagent preparation space, and a quantitative real-time reverse-transcriptase polymerase chain reaction space. The purpose of the diagnostic training being held at the mobile diagnostic laboratory is to support the development of laboratory personnel and regional staff associated with the mobile diagnostic laboratory and to help integrate it into the existing CPHRL workflow.
Molecular diagnosis and surveillance require partnerships between laboratorians, public health experts and government officials. In order to adequately train personnel, numerous partnerships were established. Developing these partnerships served as the base for the programme at the Sierra Leone CPHRL.
MRIGlobal subject matter experts were very mindful to consider feasibility, sustainability and local relevance during the design of the training programme. This required aligning with national priorities and resources. The major topics of the diagnostics training programme developed are: safety protocols; laboratory orientation; reagent preparation; sample receipt and inactivation; nucleic acid extraction; quantitative real-time reverse-transcriptase polymerase chain reaction; data review, analysis and reporting; proficiency testing and targeting mentoring.
Ethical considerations
This study followed all ethical guidelines for research involving no human participants.
Discussion
Effective, operational laboratories are the pillar of effective clinical and public health systems, and are critical to the detection and diagnosis of infectious disease. In a recent publication, another international partner stated:
The absence of staff, stuff, space, and systems needed to detect outbreaks of infectious disease such as the recent Ebola epidemic in West Africa, and diagnose other medical conditions has underscored the need to not only set up diagnostic equipment in places where it is scarce, but also invest resources into training laboratory personnel. (p. 102)10
Laboratories worldwide suffer from scarcities of skilled or qualified staff. Payment for laboratory technicians and other categories of laboratory workers is lower than other specialties, and periodically delayed. Numerous times from 2014 to 2017 in Sierra Leone, government laboratory staff went unpaid for months due to the inability of the government to pay its workers. College-level and formal training opportunities are very limited or non-existent. A large proportion of laboratory staff are chosen without having the proper certificates, degrees or technical expertise necessary to carry out their responsibilities, resulting in systemic failures. Training students in diagnostic techniques is not an easy task. Expecting trainees to learn molecular diagnostic skills in short courses of two to six weeks is unreasonable and not sustainable. Even the best trainees require more than six weeks of training to become truly proficient, which is why refresher training or continued oversight is necessary for success. In order to truly make a sustainable difference regarding staff training and performance, organisations interested in training should be very conscious of whom they select for training, be prepared to provide as much refresher training as necessary and be able to provide some financial incentive or balance the training with the daily work tasks of laboratory staff.
Additionally, laboratory staff often lack access to adequate tools and supplies. Resource-poor laboratories often use obsolete technologies, expired reagents and improperly or uncalibrated equipment. The lack of equipment maintenance further erodes laboratory capabilities. Electricity instability in many low-income countries results in power surges or outages that damage equipment. Proper personal protective equipment is often lacking or compromised, resulting in hazardous work conditions for the staff. Funding organisations need to have equipment maintenance and replacement plans, as well as personal protective gear and consumable requirements, in place before a training programme begins.
In many low-income countries, adequate space is difficult to find. Many laboratories are located in small, cluttered spaces in hospitals. Often, laboratories consist of a single room, and operations meant to be done in separate spaces are done near one another. Many laboratories do not have a good water or electrical supply. Fuel for generators is expensive and, while useful to keep vital equipment running, is not sustainable.
Laboratories lacking trained staff, stuff and appropriate space often find it very difficult to develop robust systems. Quality, biosafety, accurate recording and reporting and a culture of maintenance are all critical laboratory functions; however, they are often not clearly understood or are under-prioritised. National guidelines and policies are often inadequate by international standards. Communication between Ministries of Health and international partners is often lacking. With Sierra Leone, as discussed above, numerous international organisations were training laboratory staff using a variety of different techniques and materials. Communication was very important to limit training overlap, trainee poaching and a variety of other potential misunderstandings.
Maintenance is difficult to instil, and without service technicians, eventually equipment reaches obsolescence. Rust and dirt are constant enemies of laboratory equipment, especially in non-climate-controlled environments. Performance skills of laboratory staff can also decline without consistent use or refresher training. Without active training, mentorship and quality management systems in the laboratory, performance can diminish. Both equipment and staff performance decline, due to lack of maintenance or skills usage, and are important considerations when establishing a training programme.
Summary
Following the West Africa EVD outbreak, a high priority was placed on the training of staff and building or repurposing of infrastructure. MRIGlobal worked closely with the Sierra Leone MoHS to develop a sustainable, replicable training programme for diagnostics. With the proper prioritisation by the Sierra Leone MoHS and international partners, sustainable gains can be made in the area of clinical diagnostics, which will help mitigate future outbreaks. As stated previously, the author believes the molecular diagnostics and disease surveillance training partnership established at the Sierra Leone CPHRL can be used as a model for sustainable capacity building and training in low-income and middle-income countries. It is also the author's opinion that long-term (10-20 year) sustainable engagement plans will be ultimately the most successful in Sierra Leone.
Acknowledgements
The author expresses his deep gratitude to many partners, including the Sierra Leone health authorities, various donors, and local and international organisations whose contributions have helped support efforts to build quality clinical laboratory systems. The author wants to thank the support staff at MRIGlobal, as well as staff at the United States Embassy in Sierra Leone. The author also thanks Scott Poynter for his photographs used in this manuscript.
Competing interests
The author declares that he has no financial or personal relationships that may have inappropriately influenced him in writing this article.
Authors' contributions
I declare that I am the sole author of this research article.
Sources of support
This work was funded under Defense Threat Reduction Agency Cooperative Biological Engagement Program contracts HDTRA1-08-D-0008 and HDTRA1-15-C-0007.
Data availability statement
Data sharing is not applicable to this article as no new data were created or analysed in this study.
Disclaimer
The views expressed in the submitted article are the author's own and not an official position of MRIGlobal or the funding agency responsible and no official endorsement should be inferred.
References
1.World Health Organizations. WHO Ebola situation report [homepage on the Internet]. 2016 [cited 2018 Mar 05]. Available from: http://apps.who.int/ebola/ebola-situation-reports [ Links ]
2.CDC. CDC's response to the 2014-2016 Ebola epidemic - West Africa and the United States. MMWR. 2016;65(3):4-11. [ Links ]
3.Demartini JC, Green DE, Monath TP. Lassa virus infection in Mastomysnatalensis in Sierra Leone. Bull World Health Organ. 1975;52(4-6):651-663. [ Links ]
4.Global Health Security Agenda. About GHSA [homepage on the Internet]. 2014 [cited 2019 Oct 19]. Available from: https://www.ghsagenda.org/about [ Links ]
5.Erickson BR, Sealy TK, Fliestra T, et al. Ebola virus disease diagnostics, Sierra Leone: Analysis of real-time reverse transcription-polymerase chain reaction values for clinical blood and oral swab specimens. J Infect Dis. 2016 Oct 15;214(Suppl. 3):S258-S262. https://doi.org/10.1093/infdis/jiw296 [ Links ]
6.Kanu H, Wilson K, Sesay-Kamara N, et al. Creation of a national infection prevention and control programme in Sierra Leone, 2015. BMJ Glob Health. 2019;4(3):e001504. https://doi.org/10.1136/bmjgh-2019-001504 [ Links ]
7.Public Health England. PHE's legacy public health work in Sierra Leone [homepage on the Internet]. 2017 [cited 2017 Nov 02]. Available from http://sierraexpressmedia.com/?p=84573 [ Links ]
8.Baez S, Pannetier D, Oestereich L, et al. Emergence of Zaire Ebola virus in Guinea. N Engl J Med. 2014;371(15):1418-1425. https://doi.org/10.1056/NEJMoa1404505 [ Links ]
9.Saez AM, Weiss S, Nowak K, et al. Investigating the zoonotic origin of the West African Ebola epidemic. EMBO Mol Med. 2015;7(1):17-23. https://doi.org/10.15252/emmm.201404792 [ Links ]
10.Orozco JD, Greenberg LA, Desai IK, et al. Building laboratory capacity to strengthen health systems. Clin Lab Med. 2018; 38(1):101-117. https://doi.org/10.1016/j.cll.2017.10.008 [ Links ]
Correspondence:
Lance D. Presser
lpresser@mriglobal.org
Received: 08 Aug. 2018
Accepted: 21 Feb. 2020
Published: 15 June 2020
CASE STUDY
Post-procedural Bacillus cereus septic arthritis in a patient with systemic lupus erythematosus
Barend MittonI, II; Roxanne RuleI, II; Nontombi MbelleI, II; Wesley van Hougenhouck- TullekenIII, IV; Mohamed SaidI, II
IDepartment of Medical Microbiology, University of Pretoria, Pretoria, South Africa
IITshwane Academic Division, Department of Medical Microbiology, National Health Laboratory Service, Pretoria, South Africa
IIIDivision of Nephrology, Department of Internal Medicine, University of Pretoria, Pretoria, South Africa
IVDepartment of Internal Medicine, Steve Biko Academic Hospital, Pretoria, South Africa
ABSTRACT
INTRODUCTION: Bacillus species are often considered as contaminants when cultured from clinical samples. Bacillus cereus may be a pathogen in certain circumstances and is known to cause musculoskeletal infections. This report aims to educate clinicians and clinical microbiology laboratories on B. cereus musculoskeletal infections and to heighten awareness that Bacillus species should not always be dismissed as contaminants.
CASE PRESENTATION: We report the case of a patient who presented to a tertiary hospital in Pretoria, South Africa, in November 2018 with B. cereus septic arthritis and underlying systemic lupus erythematosus (SLE). The isolate would otherwise have been dismissed as a contaminant had it not been for the crucial interaction between the laboratory and the treating clinicians. To our knowledge, this is the first case report of septic arthritis caused by B. cereus in an SLE patient where the organism was cultured from the joint specimen. Identification of the organism was performed using matrix-assisted laser desorption/ionisation mass spectrometry.
MANAGEMENT AND OUTCOME: Definitive treatment was with intravenous vancomycin, continued for four weeks, in addition to arthroscopy and management of the underlying SLE. The patient had a good clinical outcome and regained full mobility.
CONCLUSION: Musculoskeletal infections, specifically septic arthritis caused by B. cereus, are exceedingly rare infections. Immune suppression, trauma, prosthetic implants and invasive procedures are important risk factors for B. cereus musculoskeletal infections. Close collaboration with a multi-disciplinary team approach will effect the best outcome for complicated patients with B. cereus infections.
Keywords: Bacillus cereus; septic arthritis; systemic lupus erythematosus; Matrix-assisted laser desorption/ionisation mass spectrometry; MALDI-TOF MS; musculoskeletal infection; arthroscopy.
Introduction
As the vast majority of Bacillus species are non-pathogenic and ubiquitous in the environment, many clinical microbiologists and clinicians dismiss Bacillus species cultured from clinical specimens as contaminants. Occasionally, this results in a missed diagnosis and inappropriate clinical decision-making. This case is important, because it illustrates the importance of communication between clinicians and the clinical laboratory staff in determining the significance of culture results. This report aims to educate healthcare workers on Bacillus cereus joint infections and further endeavours to assist healthcare practitioners in distinguishing when this organism should be dismissed as a contaminant and when it should be considered as a pathogen.
Ethical considerations
Written, informed consent was obtained from the patient. This research was approved by the University of Pretoria, Faculty of Health Sciences, Research Ethics Committee (ethics reference number 133/2019).
Case presentation
In November 2018, a 32-year-old male was referred to a tertiary academic hospital in Pretoria, South Africa, with a non-resolving septic arthritis of his right knee. The patient presented to a secondary hospital 10 days prior with a tender, swollen right knee, with no history of trauma. He underwent an arthroscopy at that centre and received intravenous amoxicillin-clavulanic acid, with a suboptimal response. In addition, he developed symptoms suggestive of systemic lupus erythematosus (SLE), which included polyarthritis, xerostomia, Raynaud's phenomenon, proteinuria and confusion. On examination he was haemodynamically stable with a pulse rate of 100 beats per minute, a blood pressure of 117/81 mmHg and a temperature of 36.5 °C. He had asymmetric polyarthritis, involving the right elbow, left wrist, right knee and both ankles. The right knee was the worst affected, with swelling, erythema and tenderness on examination. An emergency arthroscopy of the right knee was performed, revealing a purulent effusion. Intravenous ceftriaxone (1 g twice daily) was started empirically. X-rays of all affected joints revealed no accompanying osteomyelitis. No other imaging of the joints was done. The diagnosis of SLE was confirmed based on a Systemic Lupus International Collaborating Clinics score1 of five (anti-nuclear antibody positive, lupus nephritis class 3, arthritis, low C3 and neurologic SLE).
Laboratory investigations
Admission blood test revealed a white cell count of 8.04 × 10⁹ cells/L with neutrophilia (73%), a C-reactive protein of 107 mg/L, a positive anti-nuclear antibody (titre 160) and a low C3 (0.50 g/L). In addition, an Epstein-Barr virus viraemia of 530 copies/mL was found. Admission blood cultures had no growth. A pus sample taken during arthroscopy showed numerous Gram-positive bacilli on the direct Gram stain. Culture revealed large, flat, grey, beta-haemolytic colonies on 5% horse blood agar (Figure 1), which also grew on chocolate agar and MacConkey agar. This isolate was identified as Bacillus species and reported as a possible contaminant. The patient had a poor clinical response to the empiric ceftriaxone after 6 days of treatment, and a request was made by the attending clinicians for antimicrobial susceptibility testing on the isolate. The isolate was therefore referred for further identification to species level using matrix-assisted laser desorption/ionisation mass spectrometry by means of VITEK® MS (bioMérieux, Marcy l'Etoile, France), instrument software version 1.5.0.4, MYLA® version 4.5.1 (bioMérieux), Knowledge Base (database) version 3.2. The isolate was identified as Bacillus cereus. Antibiotic susceptibilities were performed by ETEST® (bioMérieux, Marcy l'Etoile, France) and interpreted using the Clinical & Laboratory Standards Institute M45 (2015) breakpoints.2 The isolate was resistant to penicillin (minimum inhibitory concentration [MIC] 32 µg/mL), and cefotaxime (MIC 32 µg/mL), but susceptible to vancomycin (MIC 4 µg/mL) and imipenem (MIC 4 µg/mL).

Management and outcome
Based on the report, the patient was started on intravenous vancomycin 1 g twice daily. The dose was adjusted to achieve a target vancomycin blood trough level of 15 mg/mL - 20 mg/mL. Trough levels were monitored roughly every 3 days over the treatment period, and the dosage adjusted accordingly. No vancomycin-related adverse events occurred during this time. Vancomycin was continued for 4 weeks; over this period, the pain and swelling improved dramatically, inflammatory markers normalised and the patient regained mobility. Management of the SLE included prednisone, mycophenolate mofetil and chloroquine, with good response.
Discussion
Bacillus species are Gram-positive, aerobic or facultative anaerobic sporulating bacilli, which are ubiquitous in the environment.3 Over 100 species are known to belong to the genus.3Bacillus cereus is a common cause of food poisoning and occasionally causes opportunistic infections, usually in vulnerable hosts. These infections include ophthalmic infections, wound infections, septicaemia, endocarditis, meningitis, necrotising pneumonia and orthopaedic infections.3,4 Important virulence factors of B. cereus include production of toxins and the formation of biofilms and spores.4 Except for B. cereus and B. anthracis, the genus Bacillus is rarely associated with disease.3,5,6,7 Therefore, Bacillus species are often reported as contaminants, even when cultured from sterile specimens. This may result in a delay in correct diagnosis and inappropriate treatment.
Bacillus cereus grows well on most routine culture media such as blood agar (Figure 1), chocolate agar and MacConkey agar. Routine laboratory tests will reveal large boxcar-shaped, Gram-positive bacilli (Figure 2) that are catalase positive. However, identification to species level requires specialised techniques such as matrix-assisted laser desorption/ionisation mass spectrometry or molecular techniques.7

Musculoskeletal infections caused by B. cereus are rare but have been previously reported in literature.4,5,6,7 Åkesson, Hedströum and Ripa.4 reported 12 cases of B. cereus orthopaedic infections, all occurring in post-operative or post-traumatic wounds, whilst Dubouix et al.5 reported 41 cases with B. cereus wound infections associated with open fractures. Gallo et al.6 reported two cases of B. cereus prosthesis-related septic arthritis, which were culture negative but identified using PCR-mass-spectrometric-technology and fluorescence in situ hybridisation of tissue. Ha et al.7 reported a single case of late prosthetic joint infection with B. cereus that occurred 13 years after total hip replacement surgery, confirmed by 16S ribosomal ribonucleic acid (rRNA) sequencing. In total, we found 56 cases reported over 25 years, highlighting the rarity of B. cereus musculoskeletal infections and emphasising the difficulty in making a definitive diagnosis. The scarcity of these infections may actually be the result of under-reporting, as Bacillus species are often reported as contaminants.
Bacillus cereus produces β-lactamases and is resistant to most β-lactam antibiotics, except carbapenems.3 Classically, Bacillus species are susceptible to vancomycin, aminoglycosides and fluoroquinolones, whilst resistance to erythromycin, tetracycline and even carbapenems have been reported.3 The empiric antibiotic of choice for invasive B. cereus infections is vancomycin.3,7 In addition to administering antibiotics, it is imperative to obtain source control at the infected site, as B. cereus is known to form biofilm. The removal of implanted medical devices may be necessary.7
The concomitant SLE may be considered a notable risk factor for invasive B. cereus infection in this patient. It is uncertain if the Epstein-Barr virus viraemia played a significant role in predisposing the patient further to this infection. However, both SLE and Epstein-Barr virus infection are known to be immune-modulatory, down-regulating the innate and humoral systems and placing the patient at increased risk of opportunistic infections.8,9 An additional risk factor was the preceding arthroscopy, which may have introduced spores into the joint space. To our knowledge, this is the first case of septic arthritis in an SLE patient where the organism was cultured from the joint specimen. The communication between the clinical and microbiology teams ensured that the organism was identified to species level and that antibiotic susceptibility testing was performed, resulting in a favourable outcome for the patient.
Conclusion
Bacillus species are often regarded as contaminants and receive little attention from the medical community. In certain high-risk patient groups, however, B. cereus may be a formidable pathogen. Clinical microbiology laboratorians and clinicians should have a high index of suspicion in these patients and identify Bacillus species in cultures from sterile sites to species level as well as perform antibiotic susceptibility when B. cereus is identified. Immune suppression, trauma, prosthetic implants and invasive procedures are important risk factors for B. cereus musculoskeletal infections. Bacillus cereus is universally resistant to most β-lactam antibiotics, with the exception of carbapenems. Treatment with vancomycin was successful in the case described. Close collaboration with a multi-disciplinary team approach will effect the best outcome for complicated patients with B. cereus infections.
Acknowledgements
Competing interests
The authors have declared that no competing interests exist.
Authors' contributions
B.M. designed the data collection tools, collected case data, analysed the data, and drafted and revised the paper. B.M. was also the guarantor. R.R. collected case data, and drafted and revised the paper. N.M. drafted and revised the paper. W.v.H-T. collected case data, analysed the data, and drafted and revised the paper. M.S. designed the data collection tools, analysed the data, and drafted and revised the paper.
Sources of support
This research did not receive any specific grant from funding agencies in the public, commercial or not-for-profit sectors.
Data availability statement
Data sharing is not applicable to this article as no new data were created or analysed in this study.
Disclaimer
The views and opinions expressed in this article are those of the authors and do not necessarily reflect the official policy or position of any affiliated agency of the authors.
References
1.Petri M, Orbai A-M, Alarcón GS, et al. Derivation and validation of the Systemic Lupus International Collaborating Clinics classification criteria for systemic lupus erythematosus. Arthritis Rheum. 2012;64(8):2677-2686. https://doi.org/10.1002/art.34473 [ Links ]
2.Clinical and Laboratory Standards Institute (CLSI). Methods for antimicrobial dilution and disk susceptibility testing of infrequently isolated or fastidious bacteria. 3rd ed. CLSI guideline M45. Wayne, PA: Clinical and Laboratory Standards Institute; 2015. [ Links ]
3.Bottone EJ. Bacillus cereus, a volatile human pathogen. Clin Mircobiol Rev. 2010;23(2):382-398. https://doi.org/10.1128/CMR.00073-09 [ Links ]
4.Åkesson A, Hedströum SÅ, Ripa T. Bacillus cereus: A significant pathogen in postoperative and post-traumatic wounds on orthopaedic wards. Scand J Infect Dis. 1991;23(1):71-77. https://doi.org/10.3109/00365549109023377 [ Links ]
5.Dubouix A, Bonnet E, Alvarez M, et al. Bacillus cereus infections in traumatology - Orthopaedics department: Retrospective investigation and improvement of healthcare practices. J Infect. 2005;50(1):22-30. https://doi.org/10.1016/j.jinf.2004.05.012 [ Links ]
6.Gallo PH, Melton-Kreft R, Nistico L, et al. Demonstration of Bacillus cereus in orthopaedic-implant-related infection with use of a multi-primer polymerase chain reaction-mass spectrometric assay: Report of two cases. J Bone Joint Surg. 2011;93(15):e85. https://doi.org/10.2106/JBJS.J.01181 [ Links ]
7.Ha J, Park YJ, Kim YJ, Oh HC. Late prosthetic joint infection and bacteremia by Bacillus cereus confirmed by 16S rRNA sequencing and hip joint tissue pathology. Ann Clin Microbiol. 2016;19(2):54-57. https://doi.org/10.5145/ACM.2016.19.2.54 [ Links ]
8.Ning S. Innate immune modulation in EBV infection. Herpesviridae. 2011;2(1):1. https://doi.org/10.1186/2042-4280-2-1 [ Links ]
9.Tikly M, Navarra SV. Lupus in the developing world - Is it any different? Best Pract Res Clin Rheumatol. 2008;22(4):643-655. https://doi.org/10.1016/j.berh.2008.05.003 [ Links ]
Correspondence:
Barend Mitton
barneymitton@gmail.com
Received: 06 Nov. 2019
Accepted: 27 May 2020
Published: 20 Aug. 2020
CASE STUDY
Response to a cluster of Severe Acute Respiratory Syndrome Coronavirus 2 cases at a diagnostic laboratory
Christoffel J. OppermanI; Gert J.K. MaraisII; Michelle NaidooII; Marvin HsiaoII; Nazlee SamodienI
IDivision of Medical Microbiology, National Health Laboratory Service, University of Cape Town, Cape Town, South Africa
IIDivision of Medical Virology, National Health Laboratory Service, University of Cape Town and Groote Schuur Hospital, Cape Town, South Africa
ABSTRACT
INTRODUCTION: We report on the first documented cluster of Coronavirus Disease 2019 cases amongst diagnostic laboratory staff and outline some of the initial and ongoing steps that are being implemented to manage and prevent the spread of Severe Acute Respiratory Syndrome Coronavirus 2 (SARS-CoV-2) in our laboratory.
CASE PRESENTATION: On 24 April 2020, three staff members of a tertiary diagnostic laboratory in Groote Schuur Hospital, Cape Town, South Africa, tested positive for SARS-CoV-2. Within seven days, a further nine cases were identified, which suggested an outbreak and prompted a full investigation.
MANAGEMENT AND OUTCOME: A multifaceted strategic approach was adopted to halt the spread of SARS-CoV-2 in our laboratory. Interventions focused on simultaneously establishing appropriate risk mitigation and stratification strategies through the upscaling of infection prevention and control measures, whilst minimising disruption to service delivery.
CONCLUSION: Laboratory Coronavirus Disease 2019 outbreaks have the potential to cripple a laboratory's testing capacity. Contingency planning and risk assessments should occur early, and interventions should be modified according to each laboratory's available resources and infrastructure
Keywords: SARS-CoV-2; COVID-19; diagnostic laboratory; outbreak; occupational exposure.
Introduction
To our knowledge this is the first reported cluster of Coronavirus Disease 2019 (COVID-19) cases in a laboratory in South Africa. With transmission of Severe Acute Respiratory Syndrome Coronavirus 2 (SARS-CoV-2) firmly established in our communities, infection amongst laboratory staff and laboratory outbreaks pose a serious threat to both private and public pathology laboratories and have the potential to derail the already-strained pathology services. We outline some of the initial and ongoing steps that are being implemented in our laboratory to manage and prevent the spread of SARS-CoV-2.
Ethical considerations
This work was done in accordance with all ethical standards for carrying out research, in an emergency situation, without direct contact with human or animal subjects. Institutional (National Health Laboratory Service) and departmental (Department Pathology, Division Microbiology,) approval was obtained.
Case presentation
On 24 April 2020, three staff members at the National Health Laboratory Service situated within Groote Schuur Hospital, tested positive for SARS-CoV-2. Within seven days, a further nine cases were identified, which suggested an outbreak and prompted a full investigation. This resulted in a temporary closure of affected sections of the laboratory and a significant disruption to laboratory services in the subsequent week.
Management and outcomes
Outbreak investigation strategy
Once the initial cluster was identified, a task team comprising pathologists and managers from multiple pathology disciplines was established to lead an outbreak investigation, whilst simultaneously upscaling infection prevention and control measures. The completion of a line list and analysis of the descriptive epidemiology allowed for the identification of laboratory-specific risk factors and transmission 'hotspots'.
Screening for Severe Acute Respiratory Syndrome Coronavirus 2 infection amongst staff members
It is well described that asymptomatic and pre-symptomatic people can transmit SARS-CoV-2 effiently.1 Thus, three days after the three initial confirmed cases, samples were collected from all staff members over a one-week period, regardless of exposure. A designated swabbing station was set up in the laboratory and staff were informed to collect their own swabs for reverse transcriptase polymerase chain reaction (RT-PCR) testing. A video on the correct technique for self-sampling was circulated prior to sample collection. This further limited potential exposure of laboratory staff, whilst reducing strain on hospital testing sites, and facilitated a shorter time to result, allowing for the resumption of clinical diagnostic services. Currently, all laboratory staff are being screened daily with a temperature check and a simple symptom-based questionnaire to help identify cases early.2
Response interventions and contact tracing
All staff that tested positive for SARS-CoV-2 by RT-PCR were instructed to self-isolate at home and to return to work only after two weeks, if there was a resolution of clinical symptoms. This was in accordance with the South African COVID-19 national guidelines.3 Contact tracing was carried out immediately for all laboratory personnel who tested positive, to contain the spread of the virus. The contact tracing was limited to laboratory workers. Expanded contact tracing, including family members, was conducted independently by the Western Cape Department of Health.
Asymptomatic staff with confirmed exposure to colleagues who tested positive by RT-PCR, were categorised as high-risk for COVID-19 according to national guidelines.4 These asymptomatic employees were given special leave to quarantine for seven days and were required to submit a nasopharyngeal or mid-turbinate swab on day 8 for RT-PCR testing. They were to return to work if their RT-PCR test was negative but had to continue daily symptom self-checks until day 14 post exposure.
In our laboratory, one staff member with known risk factors for severe COVID-19 passed away, whilst the remaining 11 (this includes the first three cases) qualified to return to work after 14 days; 10 of the 11 were mildly symptomatic and one was asymptomatic.3,4 Positive specimens have been stored with a view to conduct genomic sequencing and analysis. The resources to perform sequencing in real time were not available, although we did recognise that it would have been extremely helpful in deducing transmission dynamics.5
Infection prevention and control measures reinforced in the laboratory
Laboratory infection prevention and control measures were communicated swiftly to all staff. The local pathology management team recommended several measures to combat intra-laboratory transmission of SARS-CoV-2. These included: wearing of appropriate masks for all staff as opposed to virology and specimen reception personnel only, frequent and thorough hand-washing and cleaning of surfaces, frequent sanitisation of hands with 70% alcohol-based solutions, correct usage of personal protective equipment in addition to masks in appropriate circumstances and practice of social distancing. To aid the implementation of the above-mentioned measures, masks and personal protective equipment were made available, and extra bottles of alcohol-based solutions were placed at the entry and exit points of the laboratory.6
Risk mitigation strategies
A shift system was implemented where amenable, to increase social distancing and to avoid having to isolate or quarantine the whole workforce if virus transmission continued. The need to acutely reduce the size of the on-site workforce in the SARS-CoV-2 diagnostic laboratory had to be weighed carefully against the inevitable increase in test turn-around time this would cause and the resultant public health implications for the community it serves. Flexible solutions included staggering shifts and encouraging staff who could work from home to do so. In some departments, where feasible, senior staff over the age of 60 with risk factors7 for COVID-19 were advised not to return to work during the initial phase of the outbreak. It took much deliberation to determine which of the high-risk employees could stay at home, because it had to be balanced against the consequences on service delivery in the context of a pandemic. Extra personnel from other pathology departments within the National Health Laboratory Service, as well as from affiliated departments at the University of Cape Town, were trained as backup SARS-CoV-2 testing staff. Additional automated kit-based platforms requiring minimal molecular training to operate were also introduced. The purpose was to increase the operator pool and to avoid key-person dependency, which could potentially disrupt service delivery if any or all of the key persons were isolated or quarantined. Testing platforms included the Seegene Allplex™ 2019-nCoV assay (Seegene, Seoul, Republic of Korea) after in-house or NucliSENS® easyMag® nucleic acid extraction (bioMérieux, Marcy l'Étoile, France) and the Abbott RealTime SARS-CoV-2 assay (Abbott Laboratories, Abbott Park, Illinois, United States). Assay data were analysed according to the manufacturers' instructions.
Daily laboratory activities
All academic activities were suspended and only essential on-site meetings that did not violate social distancing measures were held. Areas where staff were less vigilant about infection prevention and control precautions, such as the tearoom, were identified and risks mitigated as far as possible. For the tea room, IPC measures included frequent reminders to practise social distancing, request that staff bring and clean their own crockery and cutlery, and limit on the number of staff members in the room at any given time to six people. In addition to the tearoom, high-touch areas, for example, communal telephones, scanners, keyboards, light switches and door handles, were also identified as high-risk areas. Therefore, more frequent surface cleaning and disinfection was instituted. Furthermore, carpooling by staff, especially from COVID-19 'hot spots' in the Cape Metropole, was discouraged and management provided masks for those commuting to and from work via public transport.
Maintaining service delivery
Sections of the laboratory (haematology and chemical pathology) needed to be closed briefly for decontamination during the outbreak. These samples were diverted to a neighbouring National Health Laboratory Service facility to avoid a breakdown in service delivery. However, the sudden transfer of large volume of samples to an understaffed and unprepared laboratory did present challenges that delayed result turn-around times. In another attempt for the laboratory to meet with the increased SARS-CoV-2 testing demands, non-priority tests were suspended unless suitably justified by the clinician.
Communication
Staff were kept abreast of new COVID-19-related laboratory information through regular small group or Zoom (Zoom Video Communications, San Jose, California, United States) meetings. Laboratory section-specific communication strategies, such as WhatsApp (WhatsApp, Menlo Park, California, United States) groups, were implemented. Pathologists were also in regular telephonic contact with affected staff members who were in isolation to ensure that they had the necessary support during recovery. Transparency and collaboration were a prominent feature of our response. In particular, the laboratory worked with Groote Schuur Hospital and the provincial outbreak response team to minimise the service disruption and to ensure that the laboratory could be reopened both safely and timeously.
Discussion
Challenges and lessons learned
The lack of a guideline specific for management of a SARS-CoV-2 laboratory outbreak posed a significant challenge in mobilising a quick outbreak response plan. Although international guidelines were available and consulted, they were not applicable to our setting. The dynamic nature of the outbreak necessitated frequent revisions to staff scheduling rosters when certain employees had to be isolated or quarantined. This was not an easy task, especially because the skill levels amongst all staff were not equally matched. Another difficulty was ensuring the safety of staff from SARS-CoV-2, whilst travelling to and from work. Many relied on public transport and carpooling and had no alternative means of travel.
Lessons learned include the importance of early implementation of a symptom screening tool to detect cases earlier and to prevent spread within the laboratory. We realised the importance of developing contingency plans for any crisis causing laboratory closure in the future. Had there been an existing plan, referral of large numbers of samples would probably have occurred faster and more smoothly, without impacting test turn-around time negatively. This outbreak emphasised the need for skills transfer amongst staff to avoid key person dependency issues. We need to institute training programmes that will allow staff to fulfil multiple roles, thereby making it less likely that we jeopardise testing.
Conclusion
A SARS-CoV-2 outbreak in a diagnostic laboratory can cripple its testing capacity, particularly one that is already under strain. A multifaceted strategic approach was adopted to halt the spread of SARS-CoV-2 in our laboratory, whilst minimising service delivery disruptions. Hopefully, our experiences serve to help other laboratories that find themselves in a similar situation. It is necessary for interventions to be modified based on each facility's infrastructure and available resources. These recommendations should also be adjunctive to good laboratory practice principles.
Acknowledgements
We would like to acknowledge all the staff in our laboratory who have worked tirelessly at the frontlines of this pandemic.
Competing interests
The authors have no competing conflict of interest to declare with regards to the material discussed in the article.
Authors' contributions
All authors contributed equally to this work.
Sources of support
The research received no specific grant from any funding agency in the public, commercial or not-for-profit sectors.
Data availability statement
Data sharing is not applicable to this article, as no new data were created or analysed in this study.
Disclaimer
The views and opinions expressed in this article are those of the authors and do not necessarily reflect an official policy or position of any affiliated agency of the authors.
References
1.Gandhi M, Yokoe DS, Havlir DV. Asymptomatic transmission, the Achilles' heel of current strategies to control Covid-19. N Engl J Med. 2020;382(22):2158-2160. https://doi.org/10.1056/NEJMe2009758 [ Links ]
2.World Health Organization. Risk assessment and management of exposure of health care workers in the context of COVID-19 Interim guidance [homepage on the Internet]. c2020 [cited 2020 May 14]. Available from: https://apps.who.int/iris/bitstream/handle/10665/331496/WHO-2019-nCovHW_risk_assessment-2020.2-eng.pdf [ Links ]
3.NICD Clinical management of suspected or confirmed COVID-19 disease Version 3 [homepage on the Internet]. c2020 [cited 2020 May 14]. Available from: https://www.nicd.ac.za/wp-content/uploads/2020/03/Clinical-management-of-suspected-or-acute-COVID-19-Version-3.pdf [ Links ]
4.Department of Health, South Africa. Guidelines for quarantine and isolation in relation to COVID-19 exposure and infection [homepage on the Internet]. c2020 [cited 2020 May 14]. Available from: https://www.nicd.ac.za/wp-content/uploads/2020/05/Guidelines-for-Quarantine-and-Isolation-in-relation-to-COVID-19.pdf [ Links ]
5.Nutman A, Marchaim D. How to: Molecular investigation of a hospital outbreak. Clin Microbiol Infect. 2019;25(6):688-695. https://doi.org/10.1016/j.cmi.2018.09.017 [ Links ]
6.Department of Health, South Africa. COVID-19 Disease: Infection prevention and control guidelines Version 1 [homepage on the Internet]. c2020 [cited 2020 May 14]. Available from: http://www.health.gov.za/index.php/component/phocadownload/category/626 [ Links ]
7.Zhou F, Yu T, Du R, et al. Clinical course and risk factors for mortality of adult inpatients with COVID-19 in Wuhan, China: A retrospective cohort study. Lancet. 2020;395(10229):1054-1062. https://doi.org/10.1016/S0140-6736(20)30566-3 [ Links ]
Correspondence:
Christoffel Opperman
stefanopperman1@gmail.com
Received: 18 June 2020
Accepted: 06 July 2020
Published: 25 Aug. 2020
BRIEF REPORT
Herpes simplex virus-2 infections in pregnant women from South Africa: Evaluation of the ImmunoFLOW rapid test
Shanthie GovenderI; Lungile MbamboI; Makandwe NyirendaII; Motshedisi SebitloaneIII; Nathlee AbbaiI
ISchool of Clinical Medicine Research Laboratory, Nelson Mandela School of Medicine, University of KwaZulu-Natal, Durban, South Africa
IISouth African Medical Research Council, HIV Prevention Research, Durban, South Africa
IIIDepartment of Obstetrics and Gynecology, School of Clinical Medicine Research Laboratory, Nelson Mandela School of Medicine, University of KwaZulu-Natal, Durban, South Africa
ABSTRACT
The diagnostic performance of ImmunoFLOW, a rapid test for detecting herpes simplex virus type-2 (HSV-2) infections, was investigated in 248 antenatal women. Approximately one hundred and seventy-seven (71%) of the enrolled women were infected with HSV-2. Sero-positivity was associated with older age ([≥ 30 years] 104/177, 58%), having a secondary level of education but not tertiary level of education (125/177, 70.6%), and being unmarried (150/177, 84.7%). The sensitivity of the ImmunoFLOW test in relation to the HerpeSelect HSV-2 enzyme-linked immunosorbent assay was 89.7% and specificity was 96.2%. The ImmunoFLOW therefore can serve as a valuable test in screening for HSV-2 infections in pregnant women.
Keywords: HSV-2 infection; pregnant women; rapid test; South Africa.
Introduction
The South African HIV/AIDS and Sexually Transmitted Infections (STI) Strategic Plan deems the prevention and early treatment of STIs to be a major health priority for the country; emphasis has been placed on the delivery of quality services for testing and treating of STIs.1 Simple, rapid and affordable point-of-care tests for diagnosing STIs may be advantageous, because patients can be tested and treatment commenced in a single visit.2 Cassette- and strip-based point-of-care tests are highly applicable for use in resource-poor settings, because they do not require electricity, a laboratory or highly trained staff to perform the testing.3 Additionally, such tests could have tremendous potential for use in community clinics in an STI-endemic country such as South Africa.
In highly endemic herpes simplex virus type-2 (HSV-2) regions such as South Africa,4,5 routine screening for HSV-2 infections would pose a huge financial burden on the health system, because the only available diagnostic tests for HSV-2 are enzyme-linked immunosorbent assays (ELISA), which are expensive and time consuming. Due to the high turn-around time to receive test results, many infected individuals may be lost to follow up. In addition, ELISA requires the use of specialised equipment and highly trained laboratory staff. To address these limitations, rapid point-of-care tests that: are easy to operate, provide results on the same day and are relatively inexpensive would result in a larger number of testing and subsequent treatment infected individuals. The ImmunoFLOW HSV Test (GenBio, San Diego, California, United States) is a point-of-care cassette test that detects IgG to HSV gG-2 (specific HSV type 2 and total HSV [type 1 + type 2]) for type-specific classification, which is not possible using whole virus lysate, and also provides epidemiological information on these diseases. Currently, the diagnostic performance of this test has not been evaluated in a South African setting. Additionally, there is a lack of published research studies on this point-of-care test, both locally and globally.
This study compared the results of the ImmunoFLOW with the HerpeSelect HSV-2 ELISA (Focus Diagnostics, Cypress, California, United States). We used the HerpeSelect HSV-2 ELISA from Focus Diagnostics as our reference test, because this test has been approved by the manufacturer and has a certification mark approval (GmbH, Hannover, Germany) for detection of HSV antibodies in pregnant women globally.
Methods
Ethical considerations
The study and all study related materials were approved by the Biomedical Research Ethics Committee, University of KwaZulu-Natal (BE392/17).
Study setting and population
The study was conducted between April 2017 and August 2017 at the King Edward VIII Hospital antenatal clinic in Durban, KwaZulu-Natal, South Africa. Two hundred and forty-eight women participated in this study. During screening, an estimated 20% of the women approached refused study participation. The study criteria included: being pregnant and aged 18 years or older, willing to give written informed consent, willing to undergo a blood draw, and willing to allow the study team to document their HIV status from their clinic cards.
Data and specimen collection
For this study, data on the women's demographics and clinical information were recorded on a case report form. Women who had symptoms of genital ulcers and sores were treated by syndromic management. For the syndromic management approach, patients presenting with a genital ulcer or sore were treated with aciclovir, oral, 400 mg 8-hourly for 7 days.
Venous blood (3.5 mL) was collected by a hospital professional nurse. The blood was collected into a serum separator gel tube. The blood was processed and tested at University of KwaZulu-Natal, School of Clinical Medicine Research Laboratory.
ImmunoFLOW test
The samples were tested according to the manufacturer's instructions. Test cassettes were placed on a dry level surface, and 100 µL of wash solution was added to the cassette. The patient samples were diluted in sample diluent and thereafter 200 µL of the dilution was added to the cassette. A second wash step was conducted before the addition of 100 µL of Color G to the cassette. A final wash step was performed and the results were available within 2 min. Each cassette included a reagent-positive control. The presence of a red or pink dot in the individual test and control windows was read as a positive result.
HerpeSelect HSV-2 enzyme-linked immunosorbent assay
The HerpeSelect HSV-2 ELISA assay is a glycoprotein G-based type-specific ELISA technique which produces qualitative results. Two hundred ul of each serum sample was tested according to the manufacturer's recommendations (Focus Diagnostics, Cypress California, United States). Controls that were provided with kits were included for all runs: IgG High Positive Control (index value greater than 3.5); IgG Low Positive Control (index value between 1.5-3.5); and Negative Control (index value less than 0.8). The cut-off value used to determine a positive result was > 1.10 index value; 0.9-1.10 index values were considered equivocal and index values < 0.9 were considered as negative results. All samples that produced equivocal index values were re-tested.
Data analysis
All analyses were performed using STATA, version 14 (StataCorp LLC, College Station, Texas, United States). The diagnostic performance (i.e. sensitivity, specificity, positive predictive value, and negative predictive value) of the ImmunoFLOW test was compared to the gold standard HerpeSelect HSV-2 ELISA. A p-value of < 0.05 was considered as significant.
Results
A prevalence of 177/248 (71.4%) for HSV-2 was observed on the ImmunoFLOW test and prevalence was 195/248 (78.6%) on the HerpeSelect HSV-2 ELISA. The prevalence of HIV in this population was 124/248 (50.0%). Approximately (107/177) of the women were positive for HSV-2 and were also HIV-positive. The majority of the women who tested positive for HSV-2 were older than age 30 years (104/177, 58%, p = 0.001), had completed secondary education but not tertiary education (125/177, 70.6%, p = 0.05), were unemployed (107/177, 60.5%, p = 0.55), were unmarried (150/177, 84.7%, p = 0.02) and reported having more than one lifetime sexual partners (164/177, 92.6%, p = 0.0002) (Table 1).
The sensitivity of the ImmunoFLOW test was 89.7% and its specificity was 96.2%. Of the 248 samples tested, 175 samples were correctly classified as positive by the ImmunoFLOW test. However, there were 2 samples that the ImmunoFLOW test classified as positive whereas the reference test classified these as negative. In addition, 20 samples were falsely classified as negative by the ImmunoFLOW (Table 2). The positive predictive value of the ImmunoFLOW was 98.9% and its negative predictive value was 71.8%. The overall predicitive accuracy of the ImmunoFLOW test was 91.1% (95% confidence interval: 86.9% - 94.4%) (Table 3).
Discussion
The 78.6% prevalence of HSV-2 reported in this study was found to be higher than other published studies on antenatal women.6,7,8,9,10 A high prevalence of HSV-2 was observed in women who had more partners, thereby emphasising the association between increased number of sex partners and risk of contracting STIs. The performance of the ImmunoFLOW was comparable to other published reports on HSV-2 rapid tests, which reported sensitivities and specificities > 90%.11,12,13,14,15 Other published studies on HSV-2 rapid tests have not reported on the performance of those tests in the presence of other viral infections, such as HIV, or genital symptoms relating to infection. In this study, the ImmunoFLOW rapid test performance was not shown to be negatively affected by HIV infection. The test yielded a sensitivity of 91.5% and specificity of 100% among HIV-positive women. In addition, the test was able to detect infection in women who were presenting with symptoms of genital ulcers or sores. Among women who were symptomatic, the sensitivity of the test was 91% and its specificity was 97%. This study highlights that having a test such as the ImmunoFLOW test could greatly contribute to early detection and treatment of women with herpes simplex viruses for improved outcomes for pregnant woman and their babies.
Limitations
The limitations of the study were as follows: Western blotting could not be performed as a second confirmatory test due to the high cost of the tests. The testing was performed at a research laboratory by medical technicians and is not a reflection of how the test would be performed at a clinic. Medical technicians are more experienced at laboratory procedures and quality checks. If the test had been conducted by a clinic nurse who has no laboratory experience, the results may have been different. This is yet to be confirmed. However, conducting evaluation studies at antenatal clinics will be a future research consideration. The test required the use of serum. With slight modifications, such as using blood collected by finger-prick instead of serum, this test could serve as a valuable test in screening for HSV-2 infections. However, this needs to be evaluated.
Conclusion
Overall, we have shown that the ImmunoFLOW rapid test performed well in relation to the ELISA. Rapid laboratory tests for diagnosis of STIs will directly contribute to United Nations Sustainable Development Goals that focus on improvement in health.16
Acknowledgements
We gratefully acknowledge the contribution of the women who participated in this study.
Competing interests
The authors declared no potential conflicts of interest with respect to the research, authorship or publication of this article.
Authors' contributions
N.A. designed and funded the study. M.N. performed all the statistical analysis. S.G. and L.M. performed all the laboratory testing and analysis. M.S. provided clinical assistance. All authors contributed to the writing of the final manuscript.
Sources of support
We thank the National Research Foundation of South Africa for funding this study.
Data availability statement
Data sharing is not applicable to this article as no new data were created or analysed in this study.
Disclaimer
The views and opinions expressed in this article are those of the authors and do not necessarily reflect the official policy or position of any affiliated agency of the authors.
References
1.Lewis DA, Maruma E. Revision of the national guideline for first-line comprehensive management and control of sexually transmitted infections: What's new and why? South Afr J Epidemiol Infect. 2009;24(2):6-9. https://doi.org/10.1080/10158782.2009.11441341 [ Links ]
2.Hsieh Y-H, Hogan MT, Barnes M, et al. Perceptions of an ideal point-of-care test for sexually transmitted infections-A qualitative study of focus group discussions with medical providers. PLoS One. 2010;5(11):e14144. https://doi.org/10.1371/journal.pone.0014144 [ Links ]
3.Tucker JD, Bien CH, Peeling RW. Point-of-care testing for sexually transmitted infections: Recent advances and implications for disease control. Curr Opin Infect Dis. 2013;26(1):73. https://doi.org/10.1097/QCO.0b013e32835c21b0 [ Links ]
4.Abbai NS, Wand H, Ramjee G. Socio-demographic and behavioural characteristics associated with HSV-2 sero-prevalence in high risk women in KwaZulu-Natal. BMC Rese Note. 2015;8(1):1. https://doi.org/10.1186/s13104-015-1093-0 [ Links ]
5.Kenyon C, Colebunders R, Buve A, Hens N. Partner-concurrency associated with herpes simplex virus 2 infection in young South Africans. Int J STD AIDS. 2013;24(10):804-812. https://doi.org/10.1177/0956462413482810 [ Links ]
6.Lima L, Padalecki G, Castro C, Cordeiro J, De Paula V. Seroprevalence of human herpesvirus type 2 in a reference center for pregnant women in Rio de Janeiro, Brazil. VRR. 2017;22:20-21. https://doi.org/10.17525/vrrjournal.v22i1.327 [ Links ]
7.Domercant JW, Louis FJ, Hulland E, et al. Seroprevalence of Herpes Simplex Virus type-2 (HSV-2) among pregnant women who participated in a national HIV surveillance activity in Haiti. BMC Infect Dis. 2017;17(1):577. https://doi.org/10.1186/s12879-017-2674-4 [ Links ]
8.Anjulo AA, Abebe T, Hailemichael F, Mihret A. Seroprevalence and risk factors of herpes simplex virus-2 among pregnant women attending antenatal care at health facilities in Wolaita zone, Ethiopia. Virol J. 2016;13(1):43. https://doi.org/10.1186/s12985-016-0501-y [ Links ]
9.Nakubulwa S, Kaye DK, Bwanga F, Tumwesigye NM, Nakku-Joloba E, Mirembe FM. Incidence and risk factors for herpes simplex virus type 2 seroconversion among pregnant women in Uganda: A prospective study. J Infect Dev Countr. 2016;10(10):1108-1115. https://doi.org/10.3855/jidc.6874 [ Links ]
10.Perti T, Nyati M, Gray G, et al. Frequent genital HSV-2 shedding among women during labor in Soweto, South Africa. Infect Dis Obstet Gynecol. 2014;2014:Article ID 258291:8 pages. https://doi.org/10.1155/2014/258291 [ Links ]
11.Ashley RL, Eagleton M, Pfeiffer N. Ability of a rapid serology test to detect seroconversion to herpes simplex virus type 2 glycoprotein G soon after infection. JCM. 1999;37(5):1632-1633. https://doi.org/10.1128/JCM.37.5.1632-1633.1999 [ Links ]
12.Wald A, Ashley-Morrow R. Serological testing for Herpes Simplex Virus (HSV)-1 and HSV-2 infection. Clin Infect Dis. 2002;35(2):S173-S182. https://doi.org/10.1086/342104 [ Links ]
13.Philip SS, Ahrens K, Shayevich C, et al. Evaluation of a new point-of-care serologic assay for herpes simplex virus type 2 infection. Clin Infect Dis. 2008;47(10):e79-e82. https://doi.org/10.1086/592696 [ Links ]
14.Laderman EI, Whitworth E, Dumaual E, et al. Rapid, sensitive, and specific lateral-flow immunochromatographic point-of-care device for detection of herpes simplex virus type 2-specific immunoglobulin G antibodies in serum and whole blood. CVI. 2008;15(1):159-163. https://doi.org/10.1128/CVI.00218-07 [ Links ]
15.Shevlin E, Morrow RA. Comparative performance of the Uni-Gold™ HSV-2 Rapid: A point-of-care HSV-2 diagnostic test in unselected sera from a reference laboratory. J Clin Virol. 2014;61(3):378-381. https://doi.org/10.1016/j.jcv.2014.08.012 [ Links ]
16.United Nations General Assembly. Sustainable devlopment goals [homepage on the Internet]. 2015 [cited 2018 Jun 27]. Available from: https://www.un.org/sustainabledevelopment/sustainable-development-goals/ [ Links ]
Correspondence:
Nathlee Abbai
abbain@ukzn.ac.za
Received: 27 June 2018
Accepted: 17 Apr. 2020
Published: 31 Aug. 2020
OPINION PAPER
Scaling up testing for COVID-19 in Africa: Responding to the pandemic in ways that strengthen health systems
Farouk A. Umaru
Department of Global Public Health, United States Pharmacopeia, Rockville, Maryland, United States
In the midst of responding to the coronavirus disease 2019 (COVID-19) pandemic, public health practitioners, agencies and the private sector are partnering to provide urgent emergency solutions to the ongoing crisis. In the words of World Health Organization Director General, Dr Tedros Ghebreyesus, a critical component of this response is to 'test, test and test'. This need for testing continues to spur multiple innovations in testing techniques, strategies and applications.
As of 08 April 2020, more than 48 different in vitro diagnostic devices for COVID-19 diagnosis were listed on the World Health Organization website under the International Medical Devices Regulatory Forum jurisdiction as having received Emergency Use Authorization (EUA) from nine countries, with China authorising 19 devices or technologies (including antibody test kits).1 Although no country in Africa has issued an EUA on any of these devices, it is very likely that most of these devices may be marketed or distributed on the continent.
While developed countries like the United States, Italy and Spain have struggled to cope with large-scale testing on multiple devices, many countries in Africa are disproportionately hit by the need for testing because of severe limitations in testing technologies. The lack of Africa-issued EUAs on emerging technologies specific to severe acute respiratory syndrome coronavirus 2 (SARS-CoV-2), the virus responsible for COVID-19, may continue to handicap Africa's response to the pandemic. But, should African regulatory agencies or the Africa Centres for Disease Control and Prevention (CDC) begin to issue EUAs for emerging technologies, with limited validation information in response to the COVID-19 pandemic?
African Union Member States, through the efforts of Africa CDC and partners, have received technical support to use existing real-time polymerase chain reaction (RT-PCR) instruments to conduct testing, mostly at national reference or equivalent laboratories. Although this technology may be inadequate to entirely meet the scale of testing required for COVID-19 (because of limited numbers of instruments), these instruments are within the existing tiered laboratory network. Leveraging existing RT-PCR instruments for COVID-19 diagnosis is an important step in strengthening health systems on the continent for future emergency pandemics. Responding to the current pandemic in ways that strengthen health systems and that go beyond emergency solutions to consider long-term solutions will benefit the continent as a whole.
The Ebola outbreak in West Africa provides useful lessons on how emergency responses can impact health systems.2 During the Ebola outbreak, novel technologies were provided to countries without consideration to the existing tiered laboratory network. As a consequence, some countries have been unable to incorporate those novel technologies into their laboratory networks, which impacts the overall sustainability of their health systems. It is time to remind both national and regional communities on the continent to think beyond the current COVID-19 pandemic so that when Africa emerges on the other side, its health systems will be stronger and more prepared to respond to the next one.
Central questions to keep in mind during the COVID-19 response include: How will countries absorb multiple novel technologies within their health systems post-COVID-19? How will emergency-use-authorised in vitro diagnostics be part of national tiered laboratory systems post-pandemic? What role will manufacturers play in initiating long-term evaluation procedures for COVID-19 technologies? Will these technologies be left to countries to manage without adequate support, guidance or capacity? Answers to these questions are critical now.
It is therefore imperative that national regulatory agencies, diagnostics manufacturers and national diagnostics technical working groups not 'rush' into issuing or adopting EUAs for new and untested devices outside their networks, but to consider the long-term impact of those technologies on their health systems. Some of these approaches may include:
•Update the current RT-PCR instruments to incorporate COVID-19 testing. As the gold standard for viral testing, countries must work with their existing RT-PCR technology manufacturers to upgrade reagents, kits and software to accommodate COVID-19.3 The latest EUA from the United States Food and Drug Administration for the Cepheid Xpress cartridge on GeneXpert instruments (Cepheid, Sunnyvale, California, United States) and the Abbott r-SARS-CoV-2 reagents on Abbott m2000 instrument (Abbott Laboratories, Chicago, Illinois, United States) are typical examples.4
•National regulatory agencies should develop guidelines that outline clear and unambiguous procedures for issuing EUA for new technologies. These guidelines should incorporate manufacturers' plans to work with national agencies to incorporate new devices into existing tiered networks as EUAs expire.
•National regulatory agencies should limit EUA approvals to devices that employ the gold standard of RT-PCR in their technologies over antigen-antibody-based, lateral-flow rapid diagnostic test kits, which may not demonstrate comparable sensitivity and specificity to SARS-CoV-2 as with RT-PCR instruments.
•In cases where rapid diagnostic tests are considered (because of urgency to scale up testing), scientifically prudent testing algorithms must be developed by national stakeholders and enforced. In this algorithm, any positive COVID-19 sample from a rapid diagnostic test should be accompanied an RT-PCR-based confirmatory test. In addition, a percentage of negative test samples should also be confirmed with RT-PCR, in order to continuously monitor and confirm the specificity and sensitivity of rapid diagnostic tests.
•National regulatory agencies should seek the support of international technical partners, including the World Health Association, Africa CDC, the African Society for Laboratory Medicine and other non-governmental organisations such as the United States Pharmacopeia and Foundation for Innovative New Diagnostics, to help support and build capacity to rapidly scale up testing for enhanced case management and long-term emergency preparedness.
These strategies and others, supported by national stakeholders, will support African countries in strengthening systems and improve preparedness for emerging pandemics, while building sustainable laboratory systems to help support better healthcare across the continent.
Acknowledgements
The manuscript went through internal United States Pharmacopeia technical and editorial process workflow. No need to mention individuals.
Competing interests
The author has declared that no competing interest exists.
Authors' contributions
F.A.U. was the sole author of this article.
Ethical considerations
This article followed all ethical standards for research without direct contact with human or animal subjects.
Sources of support
This research received no specific grant from any funding agency in the public, commercial or not-for-profit sector.
Data availability statement
Data sharing is not applicable to this article as no new data were created or analysed in this study.
Disclaimer
The views and opinions expressed in this article are those of the author and do not necessarily reflect the official policy or position of any affiliated agency of the author.
References
1.World Health Organization. In vitro diagnostics and laboratory technology: Prequalification of IVDs and medical devices. [homepage on the Internet]. Geneva: World Health Organization; c2020 [cited 2020 Apr 8]. Available from: https://www.who.int/diagnostics_laboratory/200408_imdrf_collated_table_8_april_2020.pdf?ua=1 [ Links ]
2.Kieny M-P, Evans DB, Schumets G, et al. Health-system resilience: Reflection on the Ebola crisis in western Africa. Geneva: World Health Organization 2014;92:850. https://doi.org/10.2471/BLT.14.149278 [ Links ]
3.World Health Organization. Emergency use listing (EUL), Weekly update. [homepage on the Internet]. date [cited 2020 Apr 4]. Available from: https://www.who.int/diagnostics_laboratory/200403_eul_covid19_ivd_update.pdf?ua=1 [ Links ]
4.United States Food & Drug Administration (FDA). Xpert Xpress SARS-CoV-2 test. [email discussion on the Internet] 2020 March 20 [cited 2020 Apr 8]. Available from: https://www.fda.gov/media/136316/download [ Links ]
Correspondence:
Farouk Umaru
faroukumaru@yahoo.com
Received: 10 Apr. 2020
Accepted: 25 Apr. 2020
Published: 14 May 2020


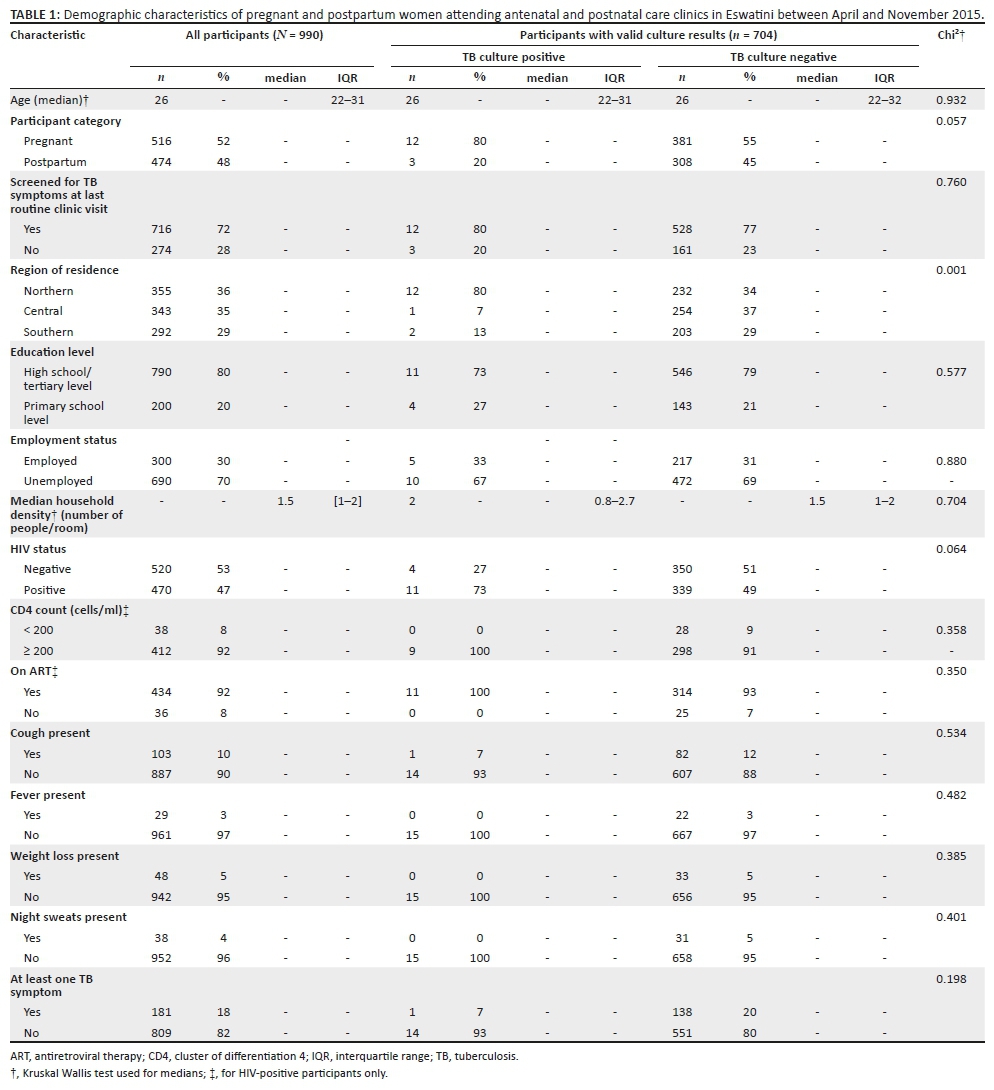
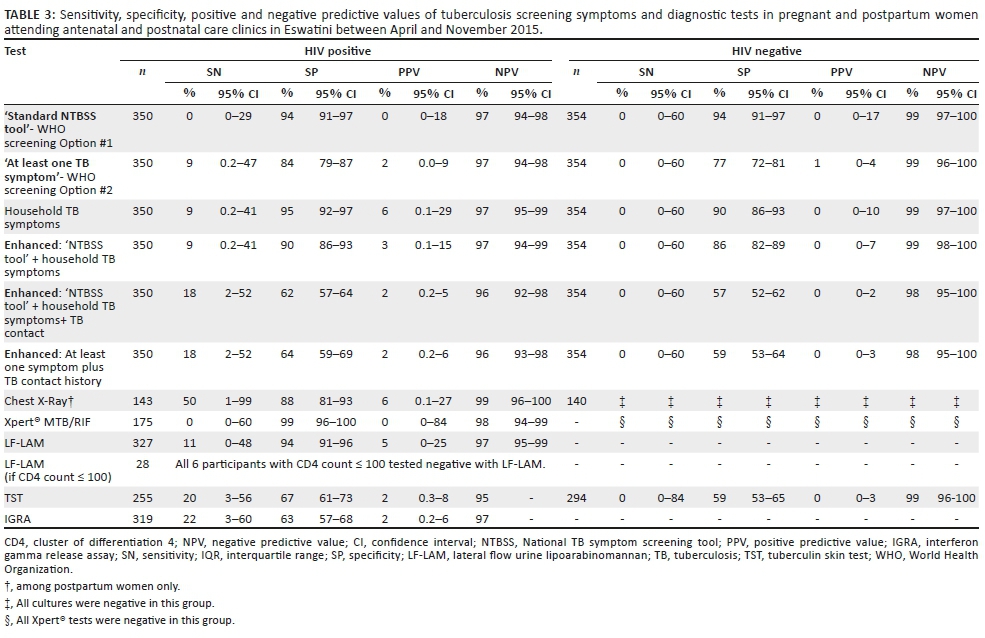
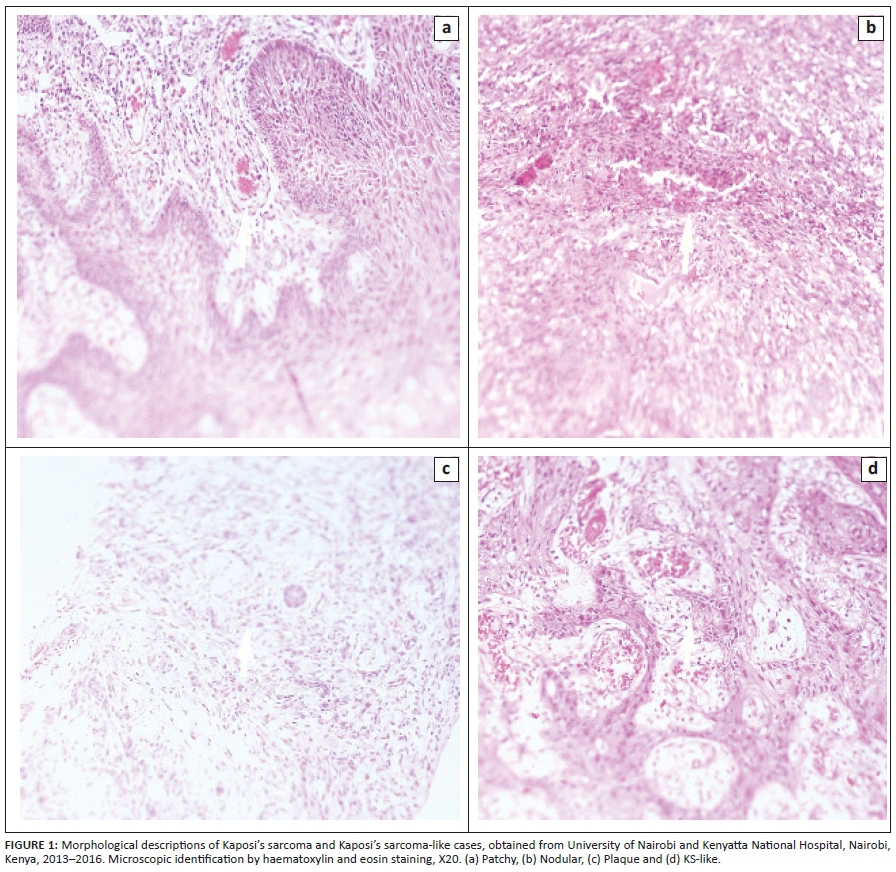
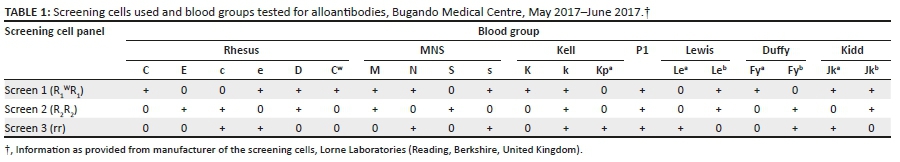
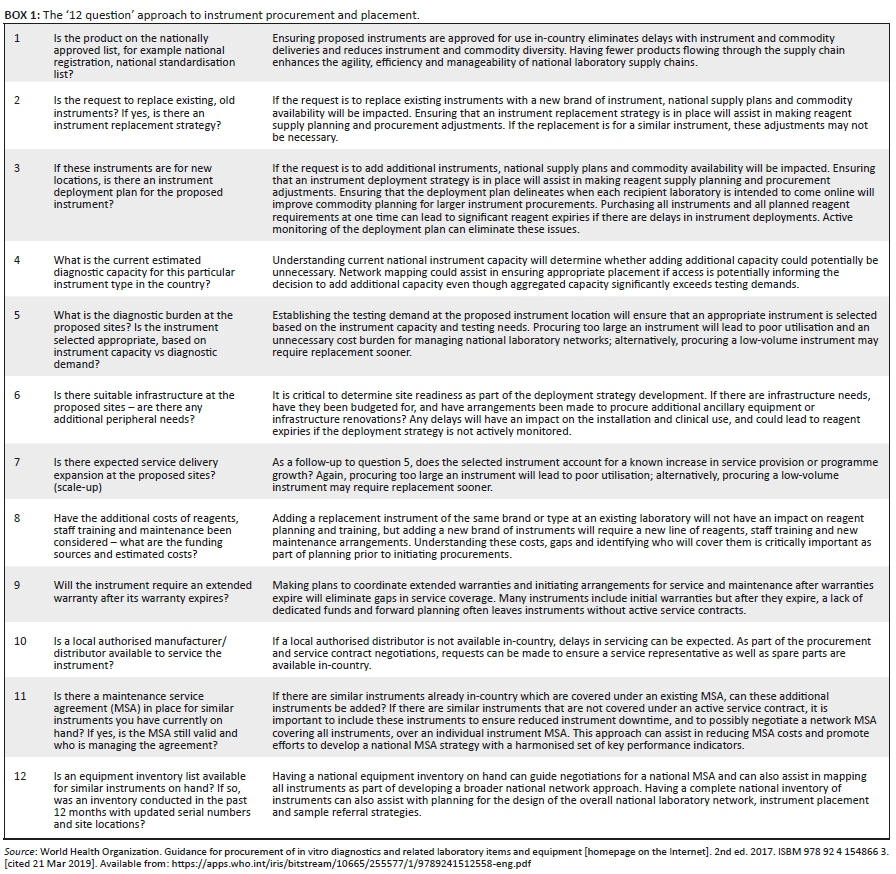
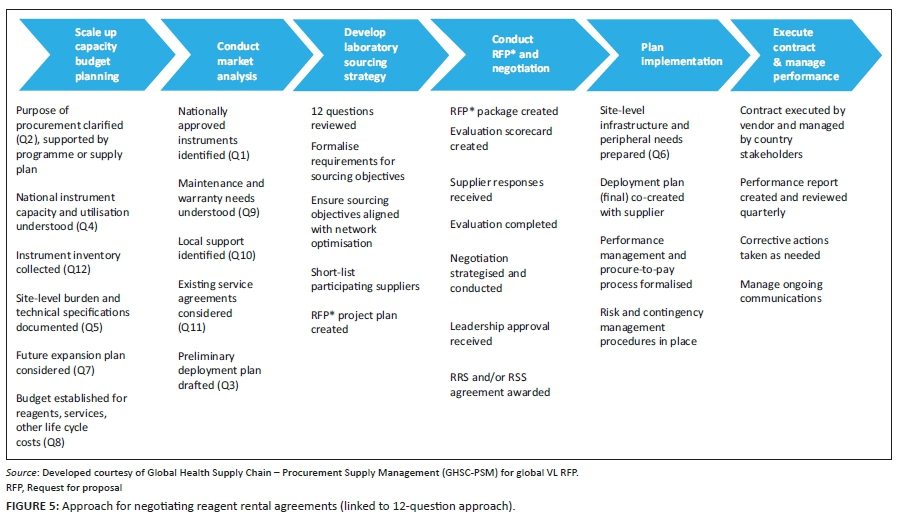
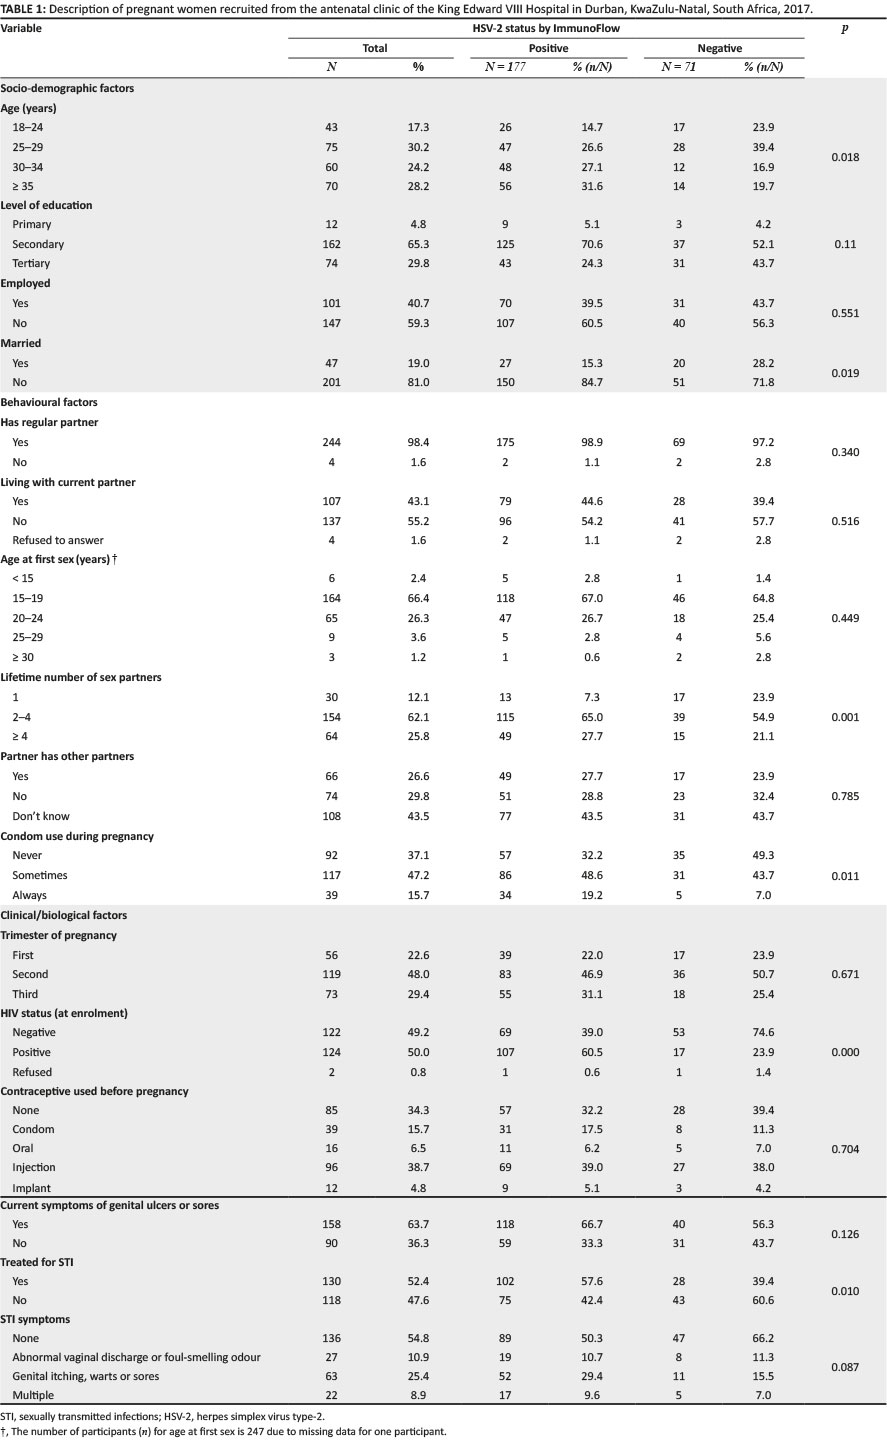
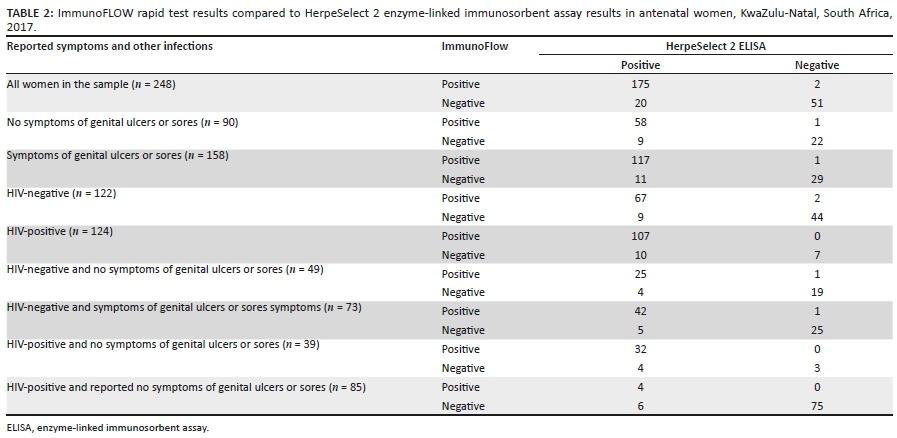
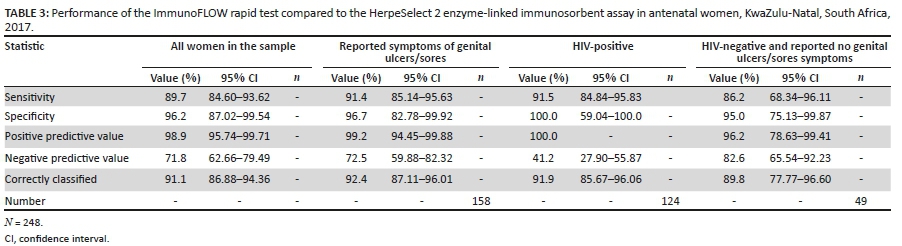